Immigrants from Middle Africa vs Sudanese Cognitive Disability
COMPARE
Immigrants from Middle Africa
Sudanese
Cognitive Disability
Cognitive Disability Comparison
Immigrants from Middle Africa
Sudanese
18.6%
COGNITIVE DISABILITY
0.0/ 100
METRIC RATING
316th/ 347
METRIC RANK
18.9%
COGNITIVE DISABILITY
0.0/ 100
METRIC RATING
334th/ 347
METRIC RANK
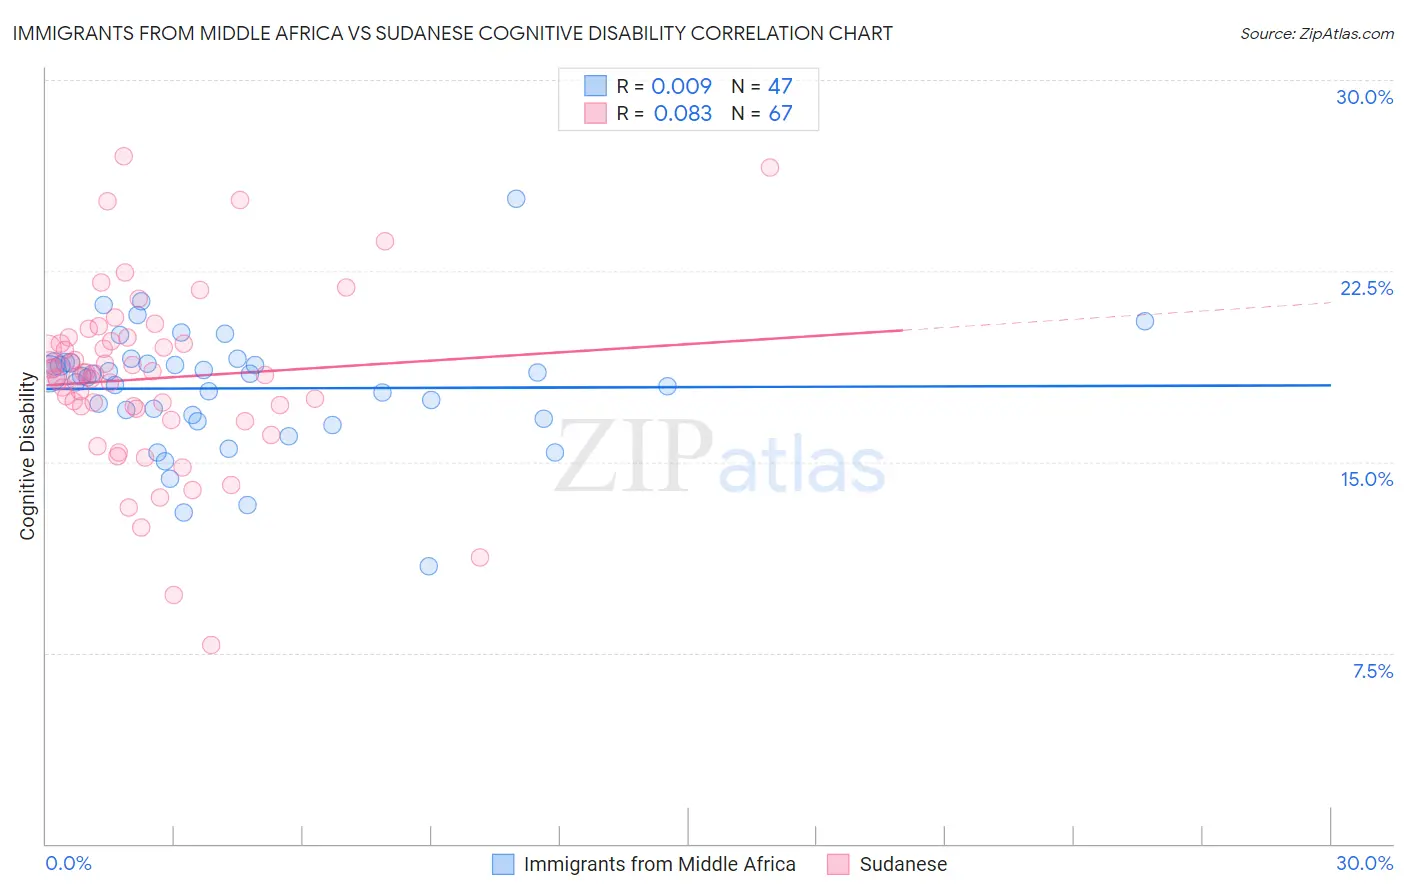
Immigrants from Middle Africa vs Sudanese Cognitive Disability Correlation Chart
The statistical analysis conducted on geographies consisting of 202,719,317 people shows no correlation between the proportion of Immigrants from Middle Africa and percentage of population with cognitive disability in the United States with a correlation coefficient (R) of 0.009 and weighted average of 18.6%. Similarly, the statistical analysis conducted on geographies consisting of 110,121,585 people shows a slight positive correlation between the proportion of Sudanese and percentage of population with cognitive disability in the United States with a correlation coefficient (R) of 0.083 and weighted average of 18.9%, a difference of 1.6%.
Cognitive Disability Correlation Summary
| Measurement | Immigrants from Middle Africa | Sudanese |
| Minimum | 10.9% | 7.8% |
| Maximum | 25.3% | 27.0% |
| Range | 14.4% | 19.2% |
| Mean | 17.9% | 18.3% |
| Median | 18.4% | 18.4% |
| Interquartile 25% (IQ1) | 16.7% | 17.1% |
| Interquartile 75% (IQ3) | 18.9% | 19.7% |
| Interquartile Range (IQR) | 2.2% | 2.7% |
| Standard Deviation (Sample) | 2.4% | 3.5% |
| Standard Deviation (Population) | 2.4% | 3.4% |
Demographics Similar to Immigrants from Middle Africa and Sudanese by Cognitive Disability
In terms of cognitive disability, the demographic groups most similar to Immigrants from Middle Africa are Immigrants from Dominica (18.6%, a difference of 0.080%), Liberian (18.6%, a difference of 0.080%), Bangladeshi (18.6%, a difference of 0.20%), Comanche (18.6%, a difference of 0.24%), and Apache (18.6%, a difference of 0.28%). Similarly, the demographic groups most similar to Sudanese are Immigrants from Yemen (18.8%, a difference of 0.38%), Immigrants from Sudan (18.8%, a difference of 0.44%), Pima (18.8%, a difference of 0.45%), Immigrants from Dominican Republic (18.8%, a difference of 0.52%), and Senegalese (19.0%, a difference of 0.54%).
| Demographics | Rating | Rank | Cognitive Disability |
| Immigrants | Dominica | 0.0 /100 | #315 | Tragic 18.6% |
| Immigrants | Middle Africa | 0.0 /100 | #316 | Tragic 18.6% |
| Liberians | 0.0 /100 | #317 | Tragic 18.6% |
| Bangladeshis | 0.0 /100 | #318 | Tragic 18.6% |
| Comanche | 0.0 /100 | #319 | Tragic 18.6% |
| Apache | 0.0 /100 | #320 | Tragic 18.6% |
| Africans | 0.0 /100 | #321 | Tragic 18.6% |
| Immigrants | Liberia | 0.0 /100 | #322 | Tragic 18.7% |
| Pueblo | 0.0 /100 | #323 | Tragic 18.7% |
| Dominicans | 0.0 /100 | #324 | Tragic 18.7% |
| Indonesians | 0.0 /100 | #325 | Tragic 18.7% |
| Immigrants | Senegal | 0.0 /100 | #326 | Tragic 18.7% |
| U.S. Virgin Islanders | 0.0 /100 | #327 | Tragic 18.7% |
| Kiowa | 0.0 /100 | #328 | Tragic 18.7% |
| Navajo | 0.0 /100 | #329 | Tragic 18.8% |
| Immigrants | Dominican Republic | 0.0 /100 | #330 | Tragic 18.8% |
| Pima | 0.0 /100 | #331 | Tragic 18.8% |
| Immigrants | Sudan | 0.0 /100 | #332 | Tragic 18.8% |
| Immigrants | Yemen | 0.0 /100 | #333 | Tragic 18.8% |
| Sudanese | 0.0 /100 | #334 | Tragic 18.9% |
| Senegalese | 0.0 /100 | #335 | Tragic 19.0% |