Celtic vs Tsimshian Disability Age 18 to 34
COMPARE
Celtic
Tsimshian
Disability Age 18 to 34
Disability Age 18 to 34 Comparison
Celtics
Tsimshian
7.6%
DISABILITY AGE 18 TO 34
0.0/ 100
METRIC RATING
286th/ 347
METRIC RANK
7.4%
DISABILITY AGE 18 TO 34
0.1/ 100
METRIC RATING
272nd/ 347
METRIC RANK
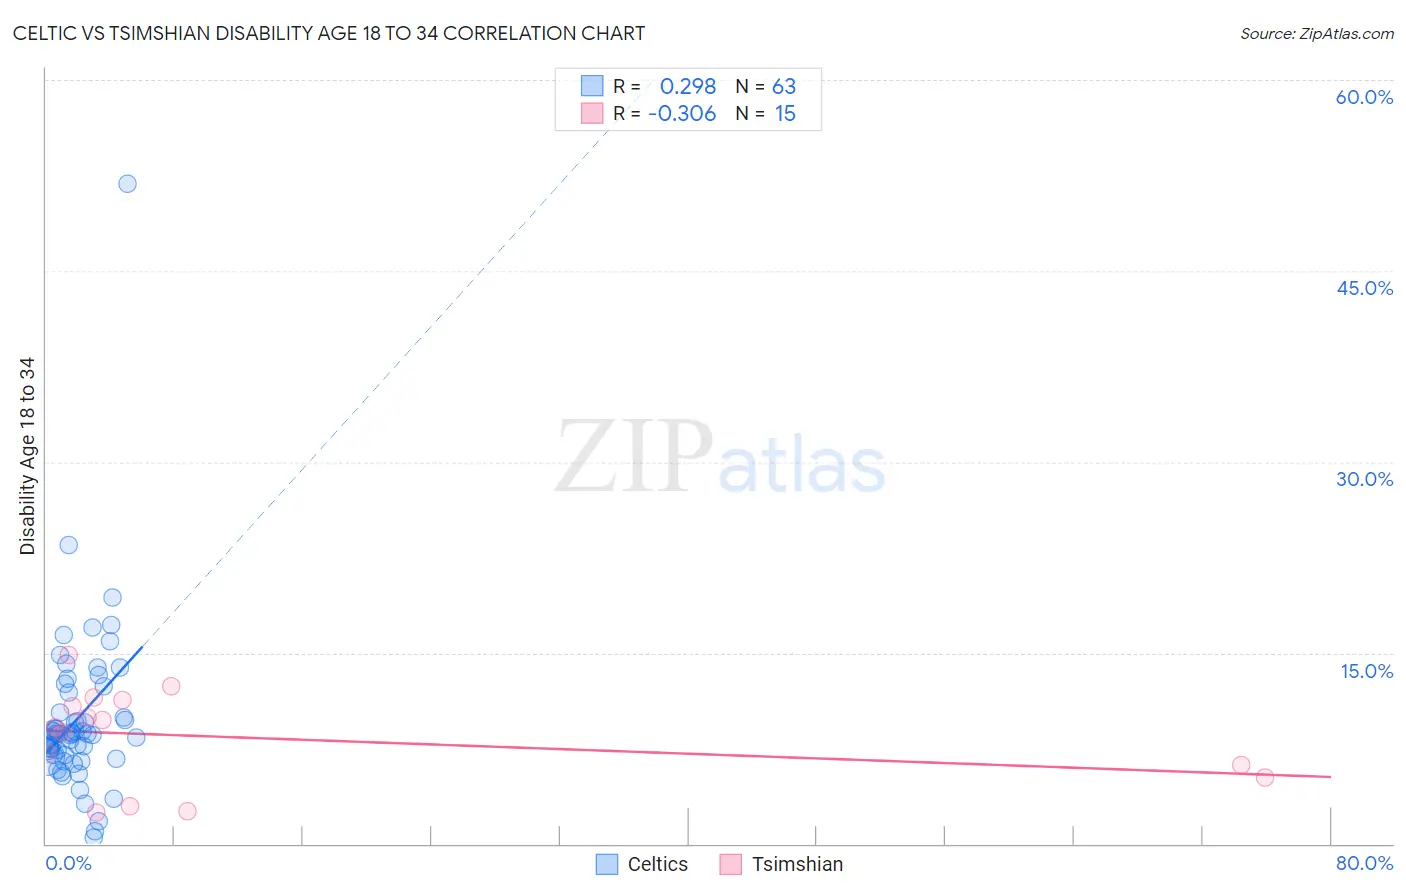
Celtic vs Tsimshian Disability Age 18 to 34 Correlation Chart
The statistical analysis conducted on geographies consisting of 168,660,531 people shows a weak positive correlation between the proportion of Celtics and percentage of population with a disability between the ages 18 and 35 in the United States with a correlation coefficient (R) of 0.298 and weighted average of 7.6%. Similarly, the statistical analysis conducted on geographies consisting of 15,623,227 people shows a mild negative correlation between the proportion of Tsimshian and percentage of population with a disability between the ages 18 and 35 in the United States with a correlation coefficient (R) of -0.306 and weighted average of 7.4%, a difference of 3.0%.
Disability Age 18 to 34 Correlation Summary
| Measurement | Celtic | Tsimshian |
| Minimum | 0.45% | 2.4% |
| Maximum | 51.9% | 14.9% |
| Range | 51.4% | 12.4% |
| Mean | 9.9% | 8.3% |
| Median | 8.6% | 9.1% |
| Interquartile 25% (IQ1) | 6.9% | 5.2% |
| Interquartile 75% (IQ3) | 11.9% | 11.3% |
| Interquartile Range (IQR) | 4.9% | 6.1% |
| Standard Deviation (Sample) | 6.8% | 3.8% |
| Standard Deviation (Population) | 6.8% | 3.7% |
Demographics Similar to Celtics and Tsimshian by Disability Age 18 to 34
In terms of disability age 18 to 34, the demographic groups most similar to Celtics are Norwegian (7.6%, a difference of 0.28%), White/Caucasian (7.6%, a difference of 0.37%), Nonimmigrants (7.6%, a difference of 0.49%), Swedish (7.5%, a difference of 0.90%), and Hopi (7.5%, a difference of 1.3%). Similarly, the demographic groups most similar to Tsimshian are Slavic (7.4%, a difference of 0.050%), African (7.4%, a difference of 0.060%), Swiss (7.4%, a difference of 0.090%), Immigrants from Somalia (7.4%, a difference of 0.13%), and Belgian (7.4%, a difference of 0.14%).
| Demographics | Rating | Rank | Disability Age 18 to 34 |
| Basques | 0.1 /100 | #269 | Tragic 7.4% |
| Belgians | 0.1 /100 | #270 | Tragic 7.4% |
| Swiss | 0.1 /100 | #271 | Tragic 7.4% |
| Tsimshian | 0.1 /100 | #272 | Tragic 7.4% |
| Slavs | 0.1 /100 | #273 | Tragic 7.4% |
| Africans | 0.1 /100 | #274 | Tragic 7.4% |
| Immigrants | Somalia | 0.1 /100 | #275 | Tragic 7.4% |
| Europeans | 0.1 /100 | #276 | Tragic 7.4% |
| Immigrants | Portugal | 0.1 /100 | #277 | Tragic 7.4% |
| Lumbee | 0.1 /100 | #278 | Tragic 7.4% |
| Czechoslovakians | 0.1 /100 | #279 | Tragic 7.4% |
| Yaqui | 0.1 /100 | #280 | Tragic 7.4% |
| Paiute | 0.0 /100 | #281 | Tragic 7.5% |
| Spanish | 0.0 /100 | #282 | Tragic 7.5% |
| Danes | 0.0 /100 | #283 | Tragic 7.5% |
| Hopi | 0.0 /100 | #284 | Tragic 7.5% |
| Swedes | 0.0 /100 | #285 | Tragic 7.5% |
| Celtics | 0.0 /100 | #286 | Tragic 7.6% |
| Norwegians | 0.0 /100 | #287 | Tragic 7.6% |
| Whites/Caucasians | 0.0 /100 | #288 | Tragic 7.6% |
| Immigrants | Nonimmigrants | 0.0 /100 | #289 | Tragic 7.6% |