Celtic vs Burmese Disability Age 18 to 34
COMPARE
Celtic
Burmese
Disability Age 18 to 34
Disability Age 18 to 34 Comparison
Celtics
Burmese
7.6%
DISABILITY AGE 18 TO 34
0.0/ 100
METRIC RATING
286th/ 347
METRIC RANK
6.0%
DISABILITY AGE 18 TO 34
99.5/ 100
METRIC RATING
66th/ 347
METRIC RANK
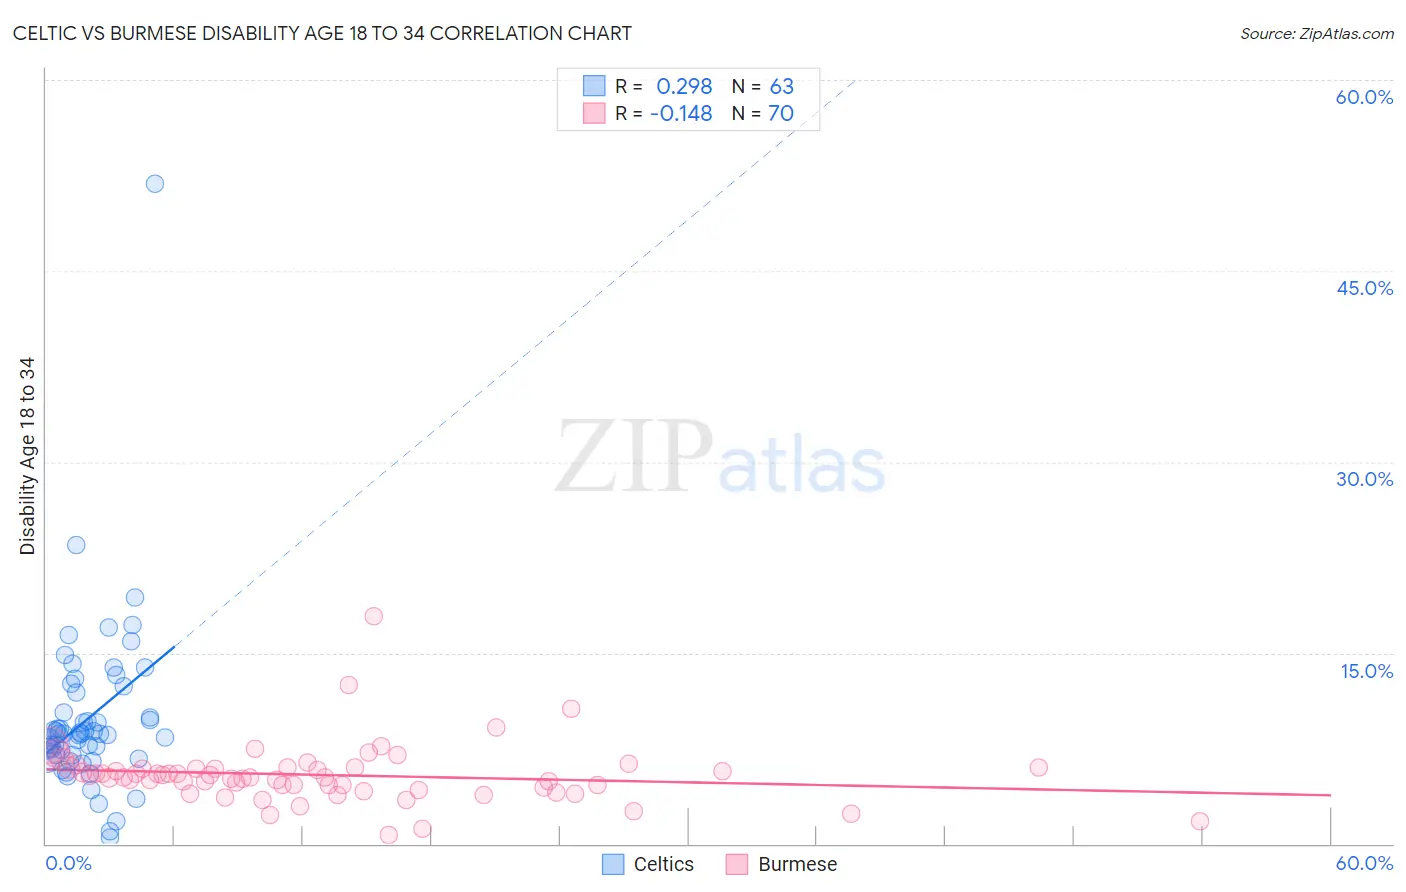
Celtic vs Burmese Disability Age 18 to 34 Correlation Chart
The statistical analysis conducted on geographies consisting of 168,660,531 people shows a weak positive correlation between the proportion of Celtics and percentage of population with a disability between the ages 18 and 35 in the United States with a correlation coefficient (R) of 0.298 and weighted average of 7.6%. Similarly, the statistical analysis conducted on geographies consisting of 464,073,050 people shows a poor negative correlation between the proportion of Burmese and percentage of population with a disability between the ages 18 and 35 in the United States with a correlation coefficient (R) of -0.148 and weighted average of 6.0%, a difference of 27.0%.
Disability Age 18 to 34 Correlation Summary
| Measurement | Celtic | Burmese |
| Minimum | 0.45% | 0.73% |
| Maximum | 51.9% | 17.9% |
| Range | 51.4% | 17.1% |
| Mean | 9.9% | 5.4% |
| Median | 8.6% | 5.3% |
| Interquartile 25% (IQ1) | 6.9% | 4.5% |
| Interquartile 75% (IQ3) | 11.9% | 6.0% |
| Interquartile Range (IQR) | 4.9% | 1.5% |
| Standard Deviation (Sample) | 6.8% | 2.4% |
| Standard Deviation (Population) | 6.8% | 2.4% |
Similar Demographics by Disability Age 18 to 34
Demographics Similar to Celtics by Disability Age 18 to 34
In terms of disability age 18 to 34, the demographic groups most similar to Celtics are Norwegian (7.6%, a difference of 0.28%), White/Caucasian (7.6%, a difference of 0.37%), Nonimmigrants (7.6%, a difference of 0.49%), Slovak (7.7%, a difference of 0.59%), and Irish (7.7%, a difference of 0.63%).
| Demographics | Rating | Rank | Disability Age 18 to 34 |
| Czechoslovakians | 0.1 /100 | #279 | Tragic 7.4% |
| Yaqui | 0.1 /100 | #280 | Tragic 7.4% |
| Paiute | 0.0 /100 | #281 | Tragic 7.5% |
| Spanish | 0.0 /100 | #282 | Tragic 7.5% |
| Danes | 0.0 /100 | #283 | Tragic 7.5% |
| Hopi | 0.0 /100 | #284 | Tragic 7.5% |
| Swedes | 0.0 /100 | #285 | Tragic 7.5% |
| Celtics | 0.0 /100 | #286 | Tragic 7.6% |
| Norwegians | 0.0 /100 | #287 | Tragic 7.6% |
| Whites/Caucasians | 0.0 /100 | #288 | Tragic 7.6% |
| Immigrants | Nonimmigrants | 0.0 /100 | #289 | Tragic 7.6% |
| Slovaks | 0.0 /100 | #290 | Tragic 7.7% |
| Irish | 0.0 /100 | #291 | Tragic 7.7% |
| Blacks/African Americans | 0.0 /100 | #292 | Tragic 7.7% |
| Scandinavians | 0.0 /100 | #293 | Tragic 7.7% |
Demographics Similar to Burmese by Disability Age 18 to 34
In terms of disability age 18 to 34, the demographic groups most similar to Burmese are Immigrants from North Macedonia (6.0%, a difference of 0.040%), Immigrants from Poland (6.0%, a difference of 0.10%), Trinidadian and Tobagonian (6.0%, a difference of 0.14%), Taiwanese (6.0%, a difference of 0.28%), and Salvadoran (6.0%, a difference of 0.29%).
| Demographics | Rating | Rank | Disability Age 18 to 34 |
| Immigrants | Caribbean | 99.6 /100 | #59 | Exceptional 6.0% |
| Immigrants | Sri Lanka | 99.6 /100 | #60 | Exceptional 6.0% |
| British West Indians | 99.6 /100 | #61 | Exceptional 6.0% |
| Peruvians | 99.6 /100 | #62 | Exceptional 6.0% |
| Salvadorans | 99.6 /100 | #63 | Exceptional 6.0% |
| Taiwanese | 99.6 /100 | #64 | Exceptional 6.0% |
| Trinidadians and Tobagonians | 99.5 /100 | #65 | Exceptional 6.0% |
| Burmese | 99.5 /100 | #66 | Exceptional 6.0% |
| Immigrants | North Macedonia | 99.5 /100 | #67 | Exceptional 6.0% |
| Immigrants | Poland | 99.5 /100 | #68 | Exceptional 6.0% |
| Immigrants | West Indies | 99.4 /100 | #69 | Exceptional 6.0% |
| Immigrants | Greece | 99.4 /100 | #70 | Exceptional 6.0% |
| Immigrants | Japan | 99.3 /100 | #71 | Exceptional 6.0% |
| Immigrants | Lebanon | 99.2 /100 | #72 | Exceptional 6.0% |
| Cypriots | 99.2 /100 | #73 | Exceptional 6.0% |