Celtic vs Choctaw Disability Age 18 to 34
COMPARE
Celtic
Choctaw
Disability Age 18 to 34
Disability Age 18 to 34 Comparison
Celtics
Choctaw
7.6%
DISABILITY AGE 18 TO 34
0.0/ 100
METRIC RATING
286th/ 347
METRIC RANK
9.0%
DISABILITY AGE 18 TO 34
0.0/ 100
METRIC RATING
340th/ 347
METRIC RANK
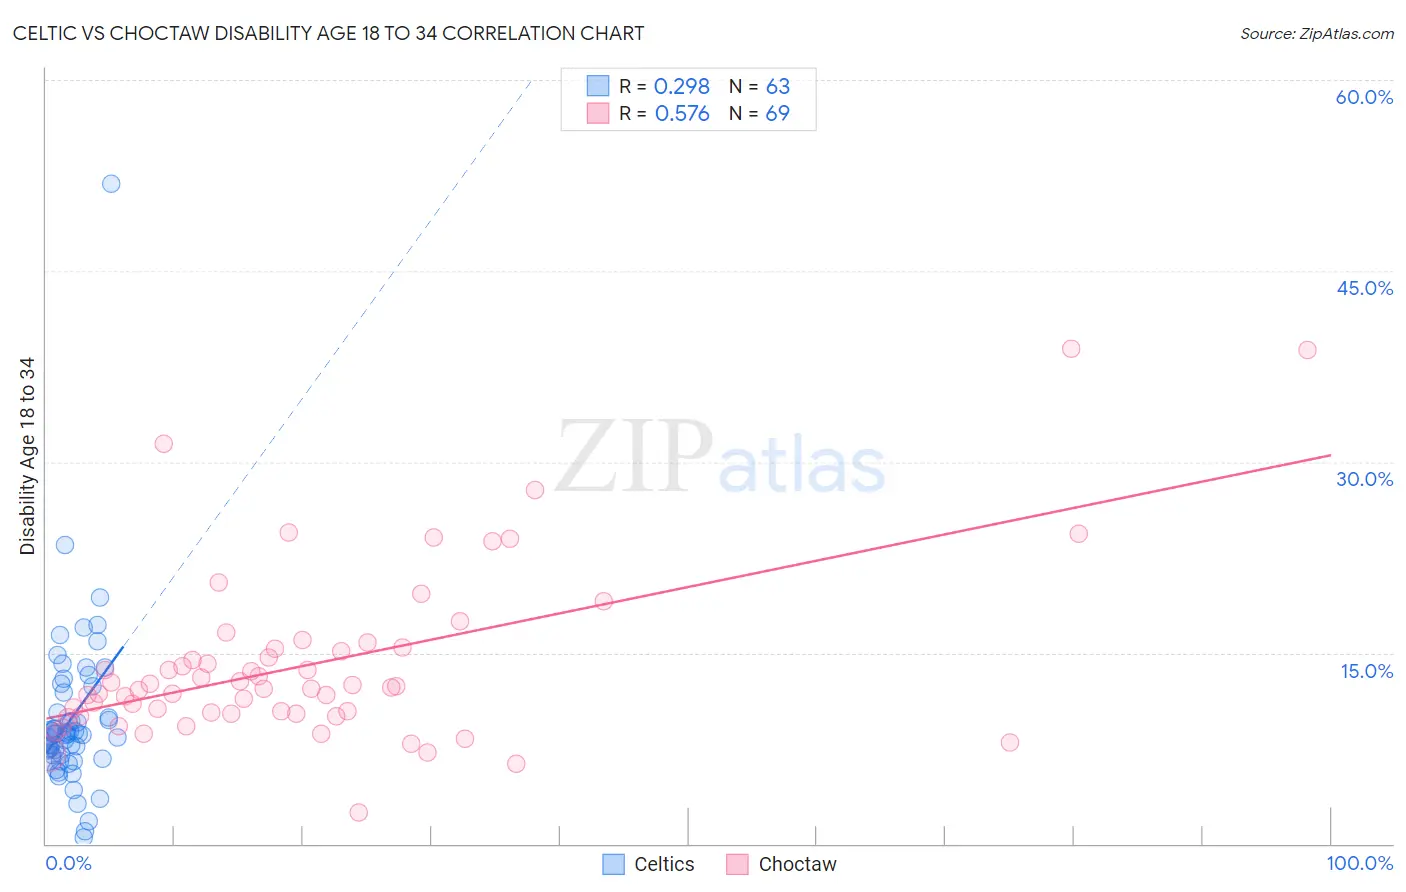
Celtic vs Choctaw Disability Age 18 to 34 Correlation Chart
The statistical analysis conducted on geographies consisting of 168,660,531 people shows a weak positive correlation between the proportion of Celtics and percentage of population with a disability between the ages 18 and 35 in the United States with a correlation coefficient (R) of 0.298 and weighted average of 7.6%. Similarly, the statistical analysis conducted on geographies consisting of 269,208,215 people shows a substantial positive correlation between the proportion of Choctaw and percentage of population with a disability between the ages 18 and 35 in the United States with a correlation coefficient (R) of 0.576 and weighted average of 9.0%, a difference of 17.8%.
Disability Age 18 to 34 Correlation Summary
| Measurement | Celtic | Choctaw |
| Minimum | 0.45% | 2.4% |
| Maximum | 51.9% | 38.9% |
| Range | 51.4% | 36.5% |
| Mean | 9.9% | 14.1% |
| Median | 8.6% | 12.2% |
| Interquartile 25% (IQ1) | 6.9% | 10.2% |
| Interquartile 75% (IQ3) | 11.9% | 15.4% |
| Interquartile Range (IQR) | 4.9% | 5.2% |
| Standard Deviation (Sample) | 6.8% | 6.8% |
| Standard Deviation (Population) | 6.8% | 6.7% |
Similar Demographics by Disability Age 18 to 34
Demographics Similar to Celtics by Disability Age 18 to 34
In terms of disability age 18 to 34, the demographic groups most similar to Celtics are Norwegian (7.6%, a difference of 0.28%), White/Caucasian (7.6%, a difference of 0.37%), Nonimmigrants (7.6%, a difference of 0.49%), Slovak (7.7%, a difference of 0.59%), and Irish (7.7%, a difference of 0.63%).
| Demographics | Rating | Rank | Disability Age 18 to 34 |
| Czechoslovakians | 0.1 /100 | #279 | Tragic 7.4% |
| Yaqui | 0.1 /100 | #280 | Tragic 7.4% |
| Paiute | 0.0 /100 | #281 | Tragic 7.5% |
| Spanish | 0.0 /100 | #282 | Tragic 7.5% |
| Danes | 0.0 /100 | #283 | Tragic 7.5% |
| Hopi | 0.0 /100 | #284 | Tragic 7.5% |
| Swedes | 0.0 /100 | #285 | Tragic 7.5% |
| Celtics | 0.0 /100 | #286 | Tragic 7.6% |
| Norwegians | 0.0 /100 | #287 | Tragic 7.6% |
| Whites/Caucasians | 0.0 /100 | #288 | Tragic 7.6% |
| Immigrants | Nonimmigrants | 0.0 /100 | #289 | Tragic 7.6% |
| Slovaks | 0.0 /100 | #290 | Tragic 7.7% |
| Irish | 0.0 /100 | #291 | Tragic 7.7% |
| Blacks/African Americans | 0.0 /100 | #292 | Tragic 7.7% |
| Scandinavians | 0.0 /100 | #293 | Tragic 7.7% |
Demographics Similar to Choctaw by Disability Age 18 to 34
In terms of disability age 18 to 34, the demographic groups most similar to Choctaw are Chickasaw (9.0%, a difference of 0.080%), Yakama (9.0%, a difference of 0.14%), Chippewa (9.0%, a difference of 0.15%), Creek (9.0%, a difference of 0.53%), and Kiowa (8.8%, a difference of 1.5%).
| Demographics | Rating | Rank | Disability Age 18 to 34 |
| Apache | 0.0 /100 | #333 | Tragic 8.4% |
| Dutch West Indians | 0.0 /100 | #334 | Tragic 8.4% |
| Seminole | 0.0 /100 | #335 | Tragic 8.4% |
| Immigrants | Azores | 0.0 /100 | #336 | Tragic 8.5% |
| Ottawa | 0.0 /100 | #337 | Tragic 8.6% |
| Cherokee | 0.0 /100 | #338 | Tragic 8.7% |
| Kiowa | 0.0 /100 | #339 | Tragic 8.8% |
| Choctaw | 0.0 /100 | #340 | Tragic 9.0% |
| Chickasaw | 0.0 /100 | #341 | Tragic 9.0% |
| Yakama | 0.0 /100 | #342 | Tragic 9.0% |
| Chippewa | 0.0 /100 | #343 | Tragic 9.0% |
| Creek | 0.0 /100 | #344 | Tragic 9.0% |
| Alaskan Athabascans | 0.0 /100 | #345 | Tragic 9.4% |
| Houma | 0.0 /100 | #346 | Tragic 9.7% |
| Yuman | 0.0 /100 | #347 | Tragic 10.6% |