Cree vs Tsimshian Disability Age 18 to 34
COMPARE
Cree
Tsimshian
Disability Age 18 to 34
Disability Age 18 to 34 Comparison
Cree
Tsimshian
8.1%
DISABILITY AGE 18 TO 34
0.0/ 100
METRIC RATING
322nd/ 347
METRIC RANK
7.4%
DISABILITY AGE 18 TO 34
0.1/ 100
METRIC RATING
272nd/ 347
METRIC RANK
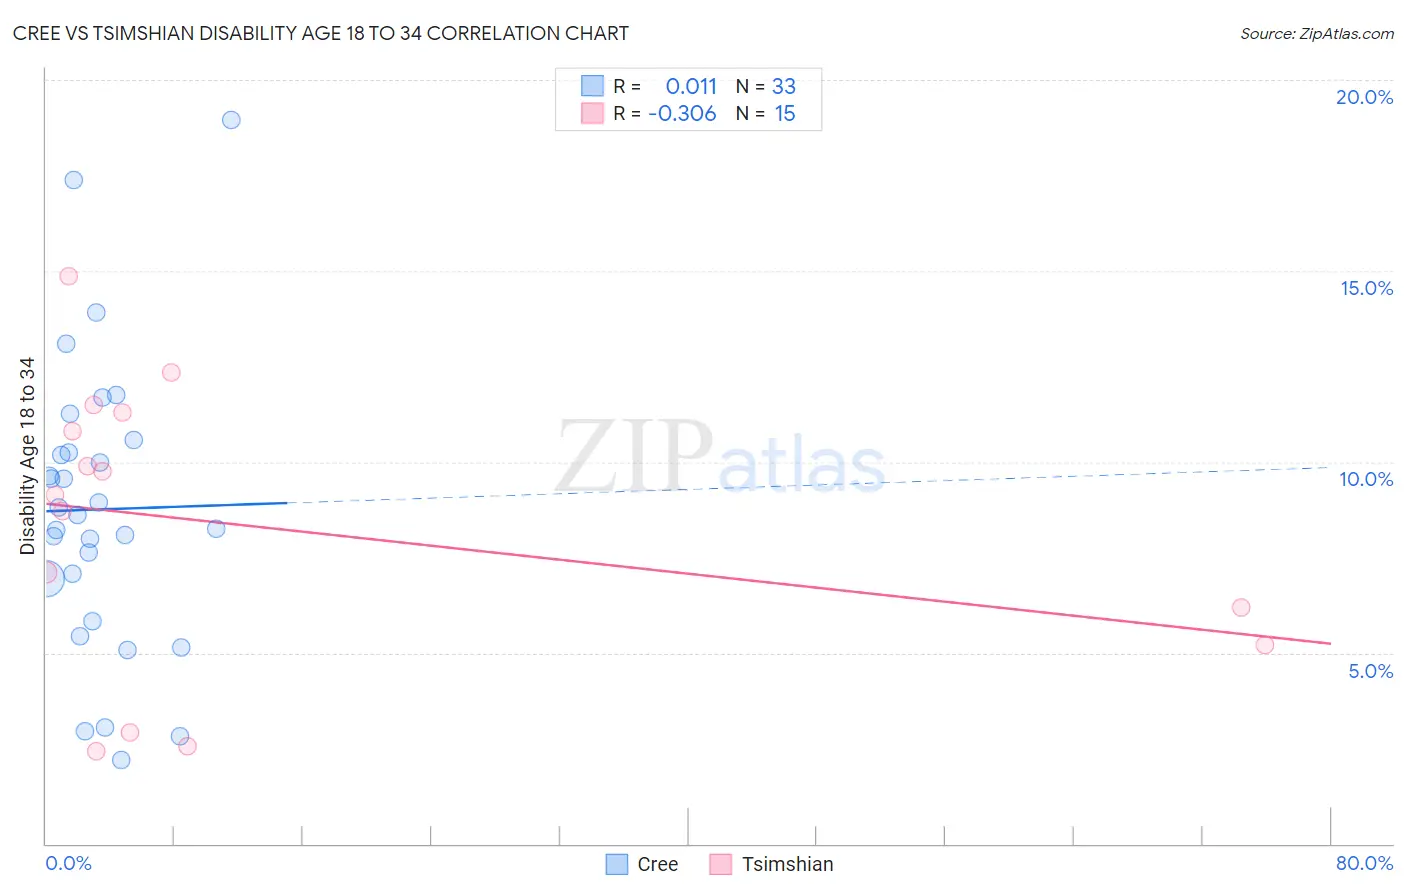
Cree vs Tsimshian Disability Age 18 to 34 Correlation Chart
The statistical analysis conducted on geographies consisting of 76,144,663 people shows no correlation between the proportion of Cree and percentage of population with a disability between the ages 18 and 35 in the United States with a correlation coefficient (R) of 0.011 and weighted average of 8.1%. Similarly, the statistical analysis conducted on geographies consisting of 15,623,227 people shows a mild negative correlation between the proportion of Tsimshian and percentage of population with a disability between the ages 18 and 35 in the United States with a correlation coefficient (R) of -0.306 and weighted average of 7.4%, a difference of 10.0%.
Disability Age 18 to 34 Correlation Summary
| Measurement | Cree | Tsimshian |
| Minimum | 2.2% | 2.4% |
| Maximum | 19.0% | 14.9% |
| Range | 16.8% | 12.4% |
| Mean | 8.8% | 8.3% |
| Median | 8.6% | 9.1% |
| Interquartile 25% (IQ1) | 6.4% | 5.2% |
| Interquartile 75% (IQ3) | 10.4% | 11.3% |
| Interquartile Range (IQR) | 4.0% | 6.1% |
| Standard Deviation (Sample) | 3.8% | 3.8% |
| Standard Deviation (Population) | 3.7% | 3.7% |
Similar Demographics by Disability Age 18 to 34
Demographics Similar to Cree by Disability Age 18 to 34
In terms of disability age 18 to 34, the demographic groups most similar to Cree are Blackfeet (8.1%, a difference of 0.060%), Navajo (8.1%, a difference of 0.42%), Aleut (8.1%, a difference of 0.46%), French Canadian (8.1%, a difference of 0.51%), and French American Indian (8.2%, a difference of 0.51%).
| Demographics | Rating | Rank | Disability Age 18 to 34 |
| Americans | 0.0 /100 | #315 | Tragic 8.0% |
| Puerto Ricans | 0.0 /100 | #316 | Tragic 8.0% |
| Hmong | 0.0 /100 | #317 | Tragic 8.1% |
| French Canadians | 0.0 /100 | #318 | Tragic 8.1% |
| Aleuts | 0.0 /100 | #319 | Tragic 8.1% |
| Navajo | 0.0 /100 | #320 | Tragic 8.1% |
| Blackfeet | 0.0 /100 | #321 | Tragic 8.1% |
| Cree | 0.0 /100 | #322 | Tragic 8.1% |
| French American Indians | 0.0 /100 | #323 | Tragic 8.2% |
| Cajuns | 0.0 /100 | #324 | Tragic 8.2% |
| Natives/Alaskans | 0.0 /100 | #325 | Tragic 8.2% |
| Potawatomi | 0.0 /100 | #326 | Tragic 8.2% |
| Sioux | 0.0 /100 | #327 | Tragic 8.2% |
| Delaware | 0.0 /100 | #328 | Tragic 8.2% |
| Crow | 0.0 /100 | #329 | Tragic 8.3% |
Demographics Similar to Tsimshian by Disability Age 18 to 34
In terms of disability age 18 to 34, the demographic groups most similar to Tsimshian are Slavic (7.4%, a difference of 0.050%), African (7.4%, a difference of 0.060%), Swiss (7.4%, a difference of 0.090%), Immigrants from Somalia (7.4%, a difference of 0.13%), and Belgian (7.4%, a difference of 0.14%).
| Demographics | Rating | Rank | Disability Age 18 to 34 |
| Slovenes | 0.1 /100 | #265 | Tragic 7.3% |
| German Russians | 0.1 /100 | #266 | Tragic 7.4% |
| Bangladeshis | 0.1 /100 | #267 | Tragic 7.4% |
| Portuguese | 0.1 /100 | #268 | Tragic 7.4% |
| Basques | 0.1 /100 | #269 | Tragic 7.4% |
| Belgians | 0.1 /100 | #270 | Tragic 7.4% |
| Swiss | 0.1 /100 | #271 | Tragic 7.4% |
| Tsimshian | 0.1 /100 | #272 | Tragic 7.4% |
| Slavs | 0.1 /100 | #273 | Tragic 7.4% |
| Africans | 0.1 /100 | #274 | Tragic 7.4% |
| Immigrants | Somalia | 0.1 /100 | #275 | Tragic 7.4% |
| Europeans | 0.1 /100 | #276 | Tragic 7.4% |
| Immigrants | Portugal | 0.1 /100 | #277 | Tragic 7.4% |
| Lumbee | 0.1 /100 | #278 | Tragic 7.4% |
| Czechoslovakians | 0.1 /100 | #279 | Tragic 7.4% |