Celtic vs Ute Disability Age 35 to 64
COMPARE
Celtic
Ute
Disability Age 35 to 64
Disability Age 35 to 64 Comparison
Celtics
Ute
12.9%
DISABILITY AGE 35 TO 64
0.1/ 100
METRIC RATING
274th/ 347
METRIC RANK
13.4%
DISABILITY AGE 35 TO 64
0.0/ 100
METRIC RATING
293rd/ 347
METRIC RANK
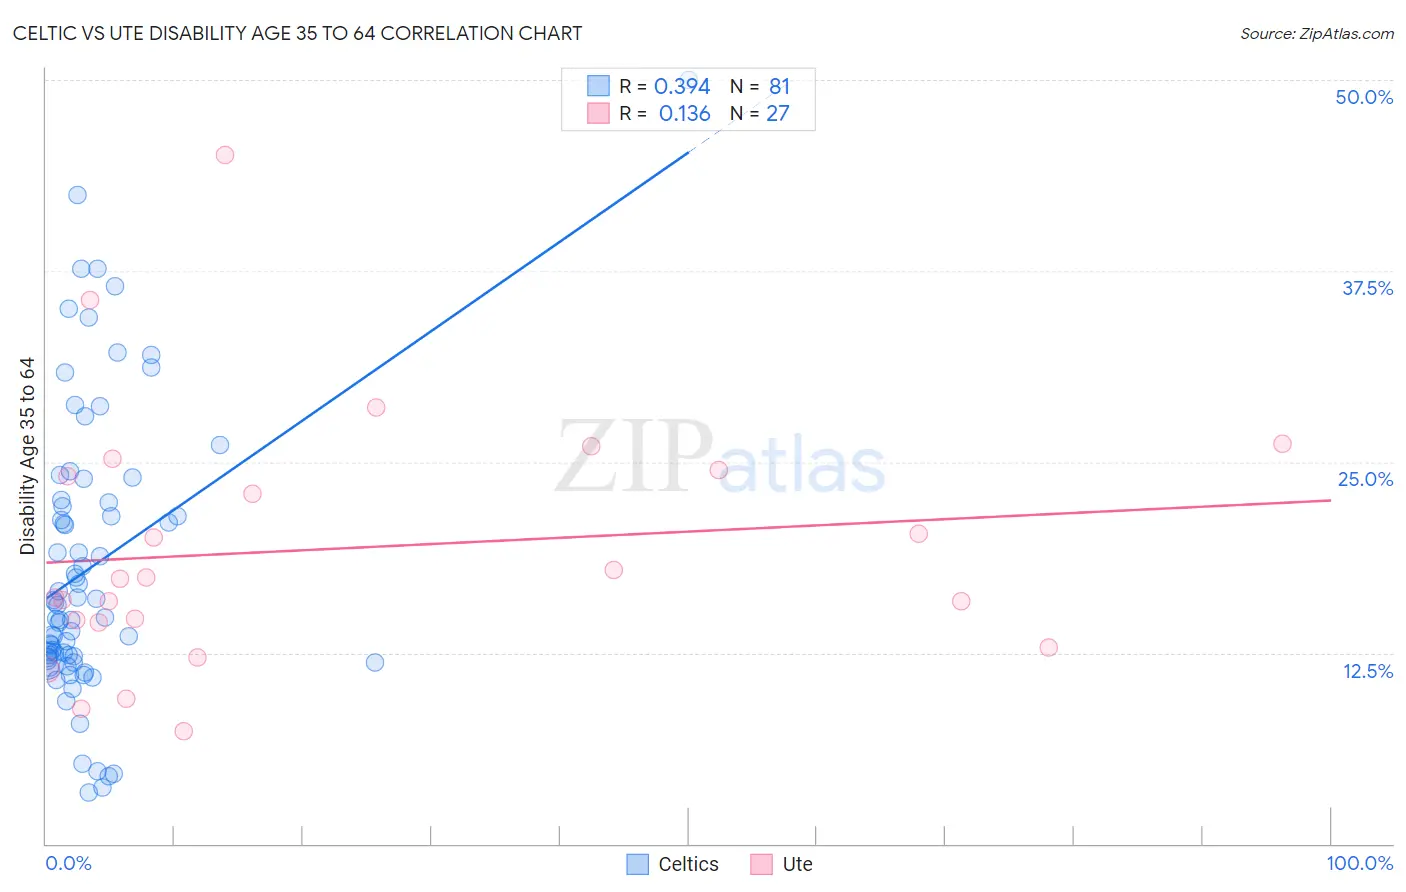
Celtic vs Ute Disability Age 35 to 64 Correlation Chart
The statistical analysis conducted on geographies consisting of 168,843,567 people shows a mild positive correlation between the proportion of Celtics and percentage of population with a disability between the ages 34 and 64 in the United States with a correlation coefficient (R) of 0.394 and weighted average of 12.9%. Similarly, the statistical analysis conducted on geographies consisting of 55,657,463 people shows a poor positive correlation between the proportion of Ute and percentage of population with a disability between the ages 34 and 64 in the United States with a correlation coefficient (R) of 0.136 and weighted average of 13.4%, a difference of 4.1%.
Disability Age 35 to 64 Correlation Summary
| Measurement | Celtic | Ute |
| Minimum | 3.4% | 7.4% |
| Maximum | 50.0% | 45.1% |
| Range | 46.6% | 37.7% |
| Mean | 18.2% | 19.3% |
| Median | 15.6% | 17.4% |
| Interquartile 25% (IQ1) | 12.1% | 14.4% |
| Interquartile 75% (IQ3) | 22.4% | 24.4% |
| Interquartile Range (IQR) | 10.3% | 10.0% |
| Standard Deviation (Sample) | 9.4% | 8.4% |
| Standard Deviation (Population) | 9.3% | 8.2% |
Demographics Similar to Celtics and Ute by Disability Age 35 to 64
In terms of disability age 35 to 64, the demographic groups most similar to Celtics are Pennsylvania German (12.8%, a difference of 0.030%), Dominican (12.9%, a difference of 0.14%), Somali (12.9%, a difference of 0.26%), Immigrants from Dominican Republic (12.9%, a difference of 0.45%), and French Canadian (12.9%, a difference of 0.48%). Similarly, the demographic groups most similar to Ute are Puget Sound Salish (13.3%, a difference of 0.47%), Immigrants from Congo (13.3%, a difference of 0.52%), Immigrants from Liberia (13.2%, a difference of 1.0%), Indonesian (13.2%, a difference of 1.1%), and Fijian (13.2%, a difference of 1.2%).
| Demographics | Rating | Rank | Disability Age 35 to 64 |
| Pennsylvania Germans | 0.1 /100 | #273 | Tragic 12.8% |
| Celtics | 0.1 /100 | #274 | Tragic 12.9% |
| Dominicans | 0.1 /100 | #275 | Tragic 12.9% |
| Somalis | 0.1 /100 | #276 | Tragic 12.9% |
| Immigrants | Dominican Republic | 0.1 /100 | #277 | Tragic 12.9% |
| French Canadians | 0.1 /100 | #278 | Tragic 12.9% |
| Immigrants | Micronesia | 0.1 /100 | #279 | Tragic 12.9% |
| Liberians | 0.1 /100 | #280 | Tragic 12.9% |
| Scotch-Irish | 0.1 /100 | #281 | Tragic 13.0% |
| Immigrants | Laos | 0.1 /100 | #282 | Tragic 13.0% |
| Central American Indians | 0.0 /100 | #283 | Tragic 13.0% |
| Immigrants | Nonimmigrants | 0.0 /100 | #284 | Tragic 13.0% |
| Immigrants | Somalia | 0.0 /100 | #285 | Tragic 13.1% |
| Hmong | 0.0 /100 | #286 | Tragic 13.1% |
| Tlingit-Haida | 0.0 /100 | #287 | Tragic 13.2% |
| Fijians | 0.0 /100 | #288 | Tragic 13.2% |
| Indonesians | 0.0 /100 | #289 | Tragic 13.2% |
| Immigrants | Liberia | 0.0 /100 | #290 | Tragic 13.2% |
| Immigrants | Congo | 0.0 /100 | #291 | Tragic 13.3% |
| Puget Sound Salish | 0.0 /100 | #292 | Tragic 13.3% |
| Ute | 0.0 /100 | #293 | Tragic 13.4% |