Celtic vs Hawaiian Disability Age 35 to 64
COMPARE
Celtic
Hawaiian
Disability Age 35 to 64
Disability Age 35 to 64 Comparison
Celtics
Hawaiians
12.9%
DISABILITY AGE 35 TO 64
0.1/ 100
METRIC RATING
274th/ 347
METRIC RANK
12.3%
DISABILITY AGE 35 TO 64
0.9/ 100
METRIC RATING
254th/ 347
METRIC RANK
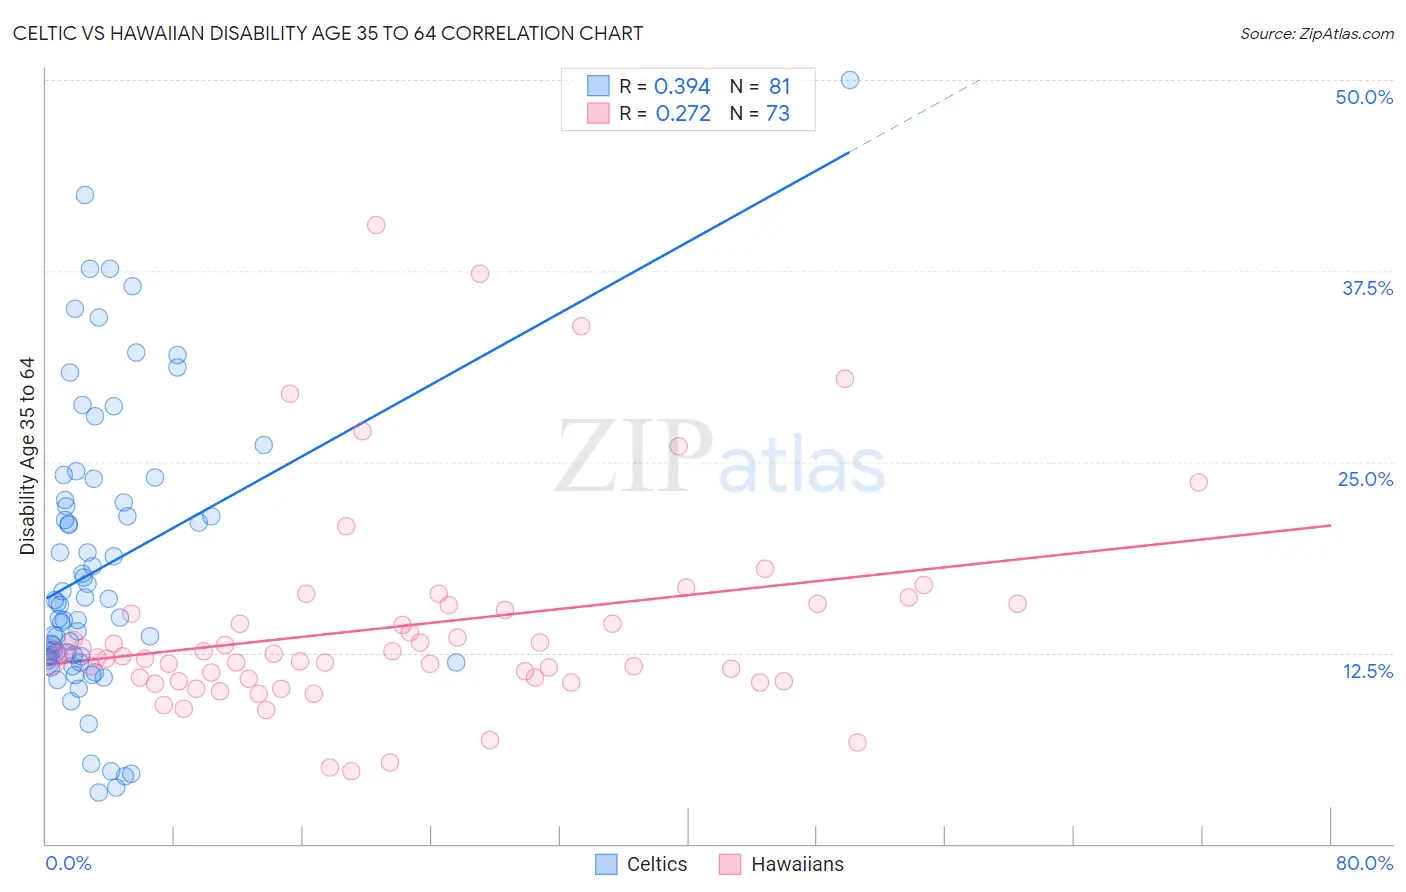
Celtic vs Hawaiian Disability Age 35 to 64 Correlation Chart
The statistical analysis conducted on geographies consisting of 168,843,567 people shows a mild positive correlation between the proportion of Celtics and percentage of population with a disability between the ages 34 and 64 in the United States with a correlation coefficient (R) of 0.394 and weighted average of 12.9%. Similarly, the statistical analysis conducted on geographies consisting of 327,340,087 people shows a weak positive correlation between the proportion of Hawaiians and percentage of population with a disability between the ages 34 and 64 in the United States with a correlation coefficient (R) of 0.272 and weighted average of 12.3%, a difference of 4.2%.
Disability Age 35 to 64 Correlation Summary
| Measurement | Celtic | Hawaiian |
| Minimum | 3.4% | 4.7% |
| Maximum | 50.0% | 40.5% |
| Range | 46.6% | 35.8% |
| Mean | 18.2% | 14.2% |
| Median | 15.6% | 12.3% |
| Interquartile 25% (IQ1) | 12.1% | 10.7% |
| Interquartile 75% (IQ3) | 22.4% | 15.5% |
| Interquartile Range (IQR) | 10.3% | 4.7% |
| Standard Deviation (Sample) | 9.4% | 6.8% |
| Standard Deviation (Population) | 9.3% | 6.8% |
Demographics Similar to Celtics and Hawaiians by Disability Age 35 to 64
In terms of disability age 35 to 64, the demographic groups most similar to Celtics are Pennsylvania German (12.8%, a difference of 0.030%), U.S. Virgin Islander (12.8%, a difference of 0.11%), Nepalese (12.8%, a difference of 0.23%), French (12.7%, a difference of 1.3%), and Spanish (12.7%, a difference of 1.4%). Similarly, the demographic groups most similar to Hawaiians are Japanese (12.3%, a difference of 0.13%), Scottish (12.4%, a difference of 0.30%), Mexican (12.4%, a difference of 0.56%), Welsh (12.4%, a difference of 0.64%), and English (12.4%, a difference of 0.76%).
| Demographics | Rating | Rank | Disability Age 35 to 64 |
| Hawaiians | 0.9 /100 | #254 | Tragic 12.3% |
| Japanese | 0.8 /100 | #255 | Tragic 12.3% |
| Scottish | 0.8 /100 | #256 | Tragic 12.4% |
| Mexicans | 0.7 /100 | #257 | Tragic 12.4% |
| Welsh | 0.6 /100 | #258 | Tragic 12.4% |
| English | 0.6 /100 | #259 | Tragic 12.4% |
| German Russians | 0.5 /100 | #260 | Tragic 12.5% |
| Malaysians | 0.5 /100 | #261 | Tragic 12.5% |
| Senegalese | 0.5 /100 | #262 | Tragic 12.5% |
| Immigrants | Zaire | 0.4 /100 | #263 | Tragic 12.5% |
| Immigrants | Portugal | 0.4 /100 | #264 | Tragic 12.5% |
| Marshallese | 0.4 /100 | #265 | Tragic 12.5% |
| Whites/Caucasians | 0.3 /100 | #266 | Tragic 12.6% |
| Sub-Saharan Africans | 0.2 /100 | #267 | Tragic 12.6% |
| Immigrants | Dominica | 0.2 /100 | #268 | Tragic 12.7% |
| Spanish | 0.2 /100 | #269 | Tragic 12.7% |
| French | 0.2 /100 | #270 | Tragic 12.7% |
| Nepalese | 0.1 /100 | #271 | Tragic 12.8% |
| U.S. Virgin Islanders | 0.1 /100 | #272 | Tragic 12.8% |
| Pennsylvania Germans | 0.1 /100 | #273 | Tragic 12.8% |
| Celtics | 0.1 /100 | #274 | Tragic 12.9% |