Russian vs Cape Verdean Disability Age Over 75
COMPARE
Russian
Cape Verdean
Disability Age Over 75
Disability Age Over 75 Comparison
Russians
Cape Verdeans
45.5%
DISABILITY AGE OVER 75
99.9/ 100
METRIC RATING
34th/ 347
METRIC RANK
50.1%
DISABILITY AGE OVER 75
0.0/ 100
METRIC RATING
300th/ 347
METRIC RANK
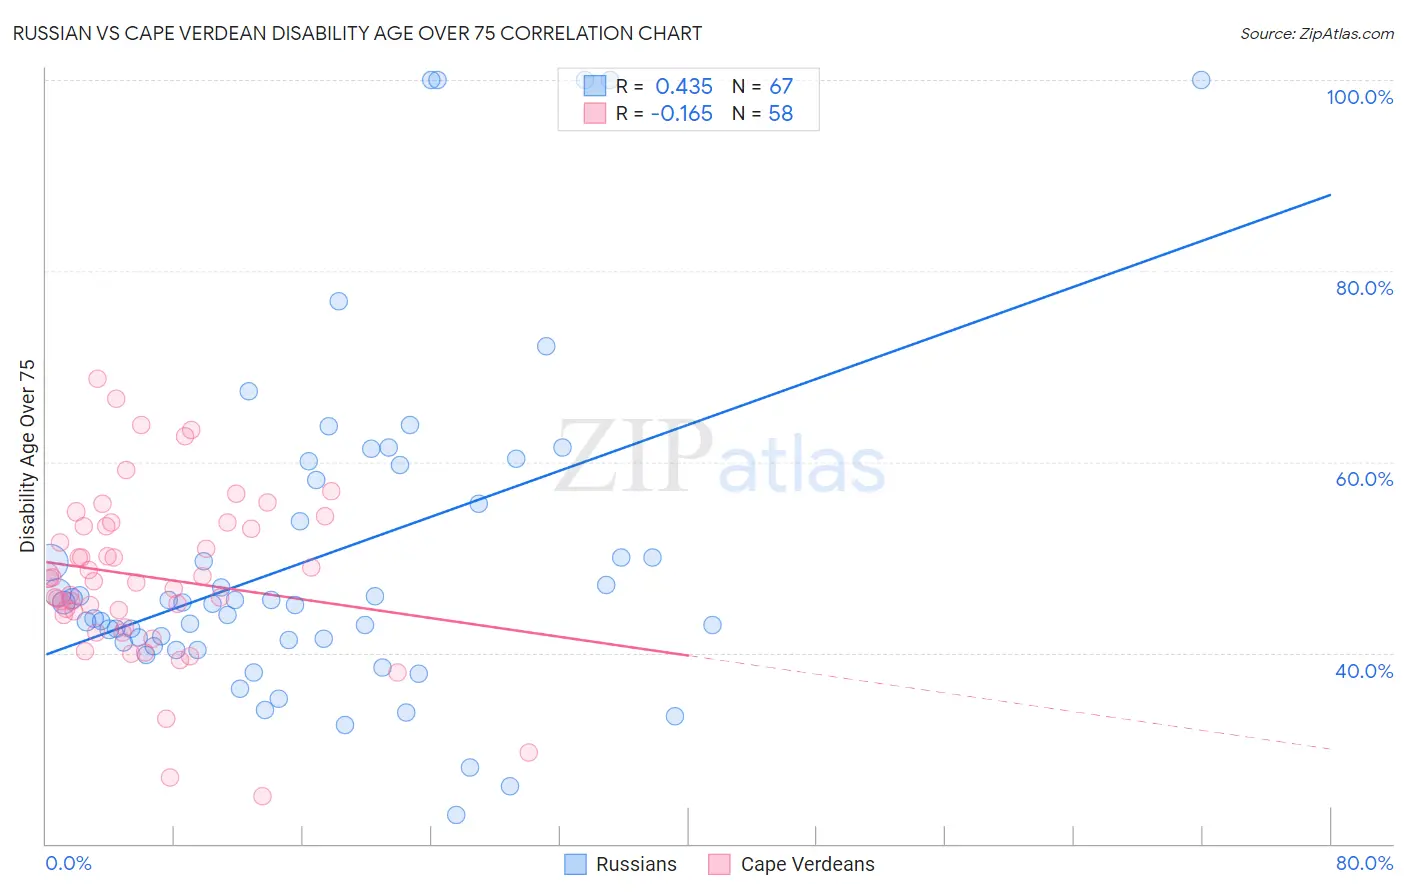
Russian vs Cape Verdean Disability Age Over 75 Correlation Chart
The statistical analysis conducted on geographies consisting of 510,763,509 people shows a moderate positive correlation between the proportion of Russians and percentage of population with a disability over the age of 75 in the United States with a correlation coefficient (R) of 0.435 and weighted average of 45.5%. Similarly, the statistical analysis conducted on geographies consisting of 107,500,329 people shows a poor negative correlation between the proportion of Cape Verdeans and percentage of population with a disability over the age of 75 in the United States with a correlation coefficient (R) of -0.165 and weighted average of 50.1%, a difference of 10.1%.
Disability Age Over 75 Correlation Summary
| Measurement | Russian | Cape Verdean |
| Minimum | 23.1% | 24.9% |
| Maximum | 100.0% | 68.8% |
| Range | 76.9% | 43.8% |
| Mean | 50.2% | 47.9% |
| Median | 45.2% | 47.7% |
| Interquartile 25% (IQ1) | 41.1% | 44.0% |
| Interquartile 75% (IQ3) | 58.1% | 53.2% |
| Interquartile Range (IQR) | 17.0% | 9.2% |
| Standard Deviation (Sample) | 17.6% | 8.8% |
| Standard Deviation (Population) | 17.4% | 8.7% |
Similar Demographics by Disability Age Over 75
Demographics Similar to Russians by Disability Age Over 75
In terms of disability age over 75, the demographic groups most similar to Russians are Norwegian (45.5%, a difference of 0.010%), Immigrants from Croatia (45.5%, a difference of 0.030%), Immigrants from Taiwan (45.5%, a difference of 0.040%), South African (45.5%, a difference of 0.040%), and Italian (45.6%, a difference of 0.090%).
| Demographics | Rating | Rank | Disability Age Over 75 |
| Immigrants | Poland | 99.9 /100 | #27 | Exceptional 45.4% |
| Thais | 99.9 /100 | #28 | Exceptional 45.4% |
| Filipinos | 99.9 /100 | #29 | Exceptional 45.4% |
| Immigrants | Denmark | 99.9 /100 | #30 | Exceptional 45.4% |
| Immigrants | Bulgaria | 99.9 /100 | #31 | Exceptional 45.5% |
| Immigrants | Australia | 99.9 /100 | #32 | Exceptional 45.5% |
| Immigrants | Croatia | 99.9 /100 | #33 | Exceptional 45.5% |
| Russians | 99.9 /100 | #34 | Exceptional 45.5% |
| Norwegians | 99.9 /100 | #35 | Exceptional 45.5% |
| Immigrants | Taiwan | 99.9 /100 | #36 | Exceptional 45.5% |
| South Africans | 99.9 /100 | #37 | Exceptional 45.5% |
| Italians | 99.9 /100 | #38 | Exceptional 45.6% |
| Estonians | 99.9 /100 | #39 | Exceptional 45.6% |
| Slovenes | 99.9 /100 | #40 | Exceptional 45.6% |
| Immigrants | Singapore | 99.8 /100 | #41 | Exceptional 45.6% |
Demographics Similar to Cape Verdeans by Disability Age Over 75
In terms of disability age over 75, the demographic groups most similar to Cape Verdeans are Immigrants from Micronesia (50.1%, a difference of 0.040%), Dominican (50.2%, a difference of 0.060%), Marshallese (50.1%, a difference of 0.10%), Armenian (50.0%, a difference of 0.16%), and Mexican American Indian (50.0%, a difference of 0.19%).
| Demographics | Rating | Rank | Disability Age Over 75 |
| Spanish American Indians | 0.0 /100 | #293 | Tragic 49.9% |
| Immigrants | Cambodia | 0.0 /100 | #294 | Tragic 50.0% |
| Spanish Americans | 0.0 /100 | #295 | Tragic 50.0% |
| Mexican American Indians | 0.0 /100 | #296 | Tragic 50.0% |
| Armenians | 0.0 /100 | #297 | Tragic 50.0% |
| Marshallese | 0.0 /100 | #298 | Tragic 50.1% |
| Immigrants | Micronesia | 0.0 /100 | #299 | Tragic 50.1% |
| Cape Verdeans | 0.0 /100 | #300 | Tragic 50.1% |
| Dominicans | 0.0 /100 | #301 | Tragic 50.2% |
| Cherokee | 0.0 /100 | #302 | Tragic 50.2% |
| Japanese | 0.0 /100 | #303 | Tragic 50.2% |
| Immigrants | Dominican Republic | 0.0 /100 | #304 | Tragic 50.3% |
| Central American Indians | 0.0 /100 | #305 | Tragic 50.5% |
| Immigrants | Central America | 0.0 /100 | #306 | Tragic 50.5% |
| Immigrants | Fiji | 0.0 /100 | #307 | Tragic 50.6% |