Cape Verdean vs South African Disability Age 65 to 74
COMPARE
Cape Verdean
South African
Disability Age 65 to 74
Disability Age 65 to 74 Comparison
Cape Verdeans
South Africans
25.4%
DISABILITY AGE 65 TO 74
0.2/ 100
METRIC RATING
261st/ 347
METRIC RANK
21.9%
DISABILITY AGE 65 TO 74
98.4/ 100
METRIC RATING
86th/ 347
METRIC RANK
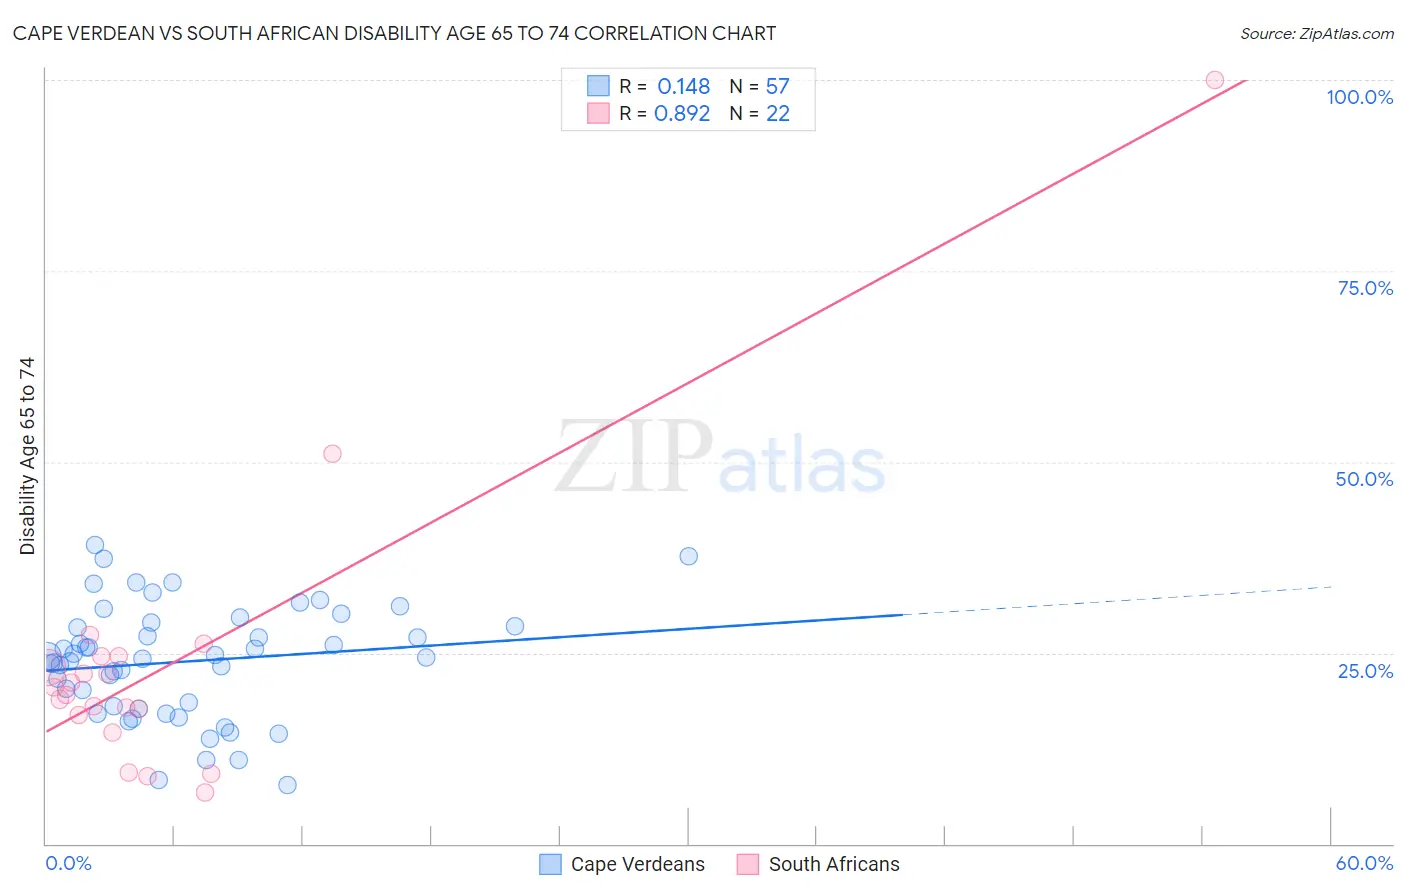
Cape Verdean vs South African Disability Age 65 to 74 Correlation Chart
The statistical analysis conducted on geographies consisting of 107,487,290 people shows a poor positive correlation between the proportion of Cape Verdeans and percentage of population with a disability between the ages 65 and 75 in the United States with a correlation coefficient (R) of 0.148 and weighted average of 25.4%. Similarly, the statistical analysis conducted on geographies consisting of 182,352,793 people shows a very strong positive correlation between the proportion of South Africans and percentage of population with a disability between the ages 65 and 75 in the United States with a correlation coefficient (R) of 0.892 and weighted average of 21.9%, a difference of 15.8%.
Disability Age 65 to 74 Correlation Summary
| Measurement | Cape Verdean | South African |
| Minimum | 7.7% | 6.7% |
| Maximum | 39.2% | 100.0% |
| Range | 31.5% | 93.3% |
| Mean | 23.8% | 23.6% |
| Median | 24.3% | 20.0% |
| Interquartile 25% (IQ1) | 17.8% | 16.9% |
| Interquartile 75% (IQ3) | 28.7% | 24.5% |
| Interquartile Range (IQR) | 10.9% | 7.6% |
| Standard Deviation (Sample) | 7.3% | 19.3% |
| Standard Deviation (Population) | 7.3% | 18.8% |
Similar Demographics by Disability Age 65 to 74
Demographics Similar to Cape Verdeans by Disability Age 65 to 74
In terms of disability age 65 to 74, the demographic groups most similar to Cape Verdeans are Malaysian (25.4%, a difference of 0.080%), Samoan (25.4%, a difference of 0.10%), Iroquois (25.4%, a difference of 0.10%), Immigrants from Cambodia (25.3%, a difference of 0.40%), and Hawaiian (25.5%, a difference of 0.45%).
| Demographics | Rating | Rank | Disability Age 65 to 74 |
| Somalis | 0.6 /100 | #254 | Tragic 25.1% |
| Central Americans | 0.5 /100 | #255 | Tragic 25.1% |
| Immigrants | Somalia | 0.4 /100 | #256 | Tragic 25.2% |
| Guamanians/Chamorros | 0.3 /100 | #257 | Tragic 25.3% |
| Marshallese | 0.3 /100 | #258 | Tragic 25.3% |
| Immigrants | Cambodia | 0.3 /100 | #259 | Tragic 25.3% |
| Malaysians | 0.2 /100 | #260 | Tragic 25.4% |
| Cape Verdeans | 0.2 /100 | #261 | Tragic 25.4% |
| Samoans | 0.2 /100 | #262 | Tragic 25.4% |
| Iroquois | 0.2 /100 | #263 | Tragic 25.4% |
| Hawaiians | 0.2 /100 | #264 | Tragic 25.5% |
| Guatemalans | 0.2 /100 | #265 | Tragic 25.5% |
| Immigrants | Latin America | 0.1 /100 | #266 | Tragic 25.6% |
| Ottawa | 0.1 /100 | #267 | Tragic 25.6% |
| Liberians | 0.1 /100 | #268 | Tragic 25.6% |
Demographics Similar to South Africans by Disability Age 65 to 74
In terms of disability age 65 to 74, the demographic groups most similar to South Africans are Immigrants from Lebanon (21.9%, a difference of 0.080%), Immigrants from Spain (21.9%, a difference of 0.18%), Immigrants from Brazil (21.9%, a difference of 0.20%), Australian (22.0%, a difference of 0.34%), and Immigrants from Netherlands (22.0%, a difference of 0.35%).
| Demographics | Rating | Rank | Disability Age 65 to 74 |
| Venezuelans | 99.0 /100 | #79 | Exceptional 21.8% |
| Immigrants | Norway | 98.9 /100 | #80 | Exceptional 21.8% |
| Croatians | 98.9 /100 | #81 | Exceptional 21.8% |
| Immigrants | Indonesia | 98.7 /100 | #82 | Exceptional 21.9% |
| Immigrants | Brazil | 98.5 /100 | #83 | Exceptional 21.9% |
| Immigrants | Spain | 98.5 /100 | #84 | Exceptional 21.9% |
| Immigrants | Lebanon | 98.4 /100 | #85 | Exceptional 21.9% |
| South Africans | 98.4 /100 | #86 | Exceptional 21.9% |
| Australians | 98.0 /100 | #87 | Exceptional 22.0% |
| Immigrants | Netherlands | 97.9 /100 | #88 | Exceptional 22.0% |
| Immigrants | Kuwait | 97.9 /100 | #89 | Exceptional 22.0% |
| Italians | 97.9 /100 | #90 | Exceptional 22.0% |
| Chileans | 97.9 /100 | #91 | Exceptional 22.0% |
| Poles | 97.8 /100 | #92 | Exceptional 22.0% |
| Immigrants | Canada | 97.8 /100 | #93 | Exceptional 22.1% |