Belgian vs South African Disability Age 65 to 74
COMPARE
Belgian
South African
Disability Age 65 to 74
Disability Age 65 to 74 Comparison
Belgians
South Africans
22.7%
DISABILITY AGE 65 TO 74
85.3/ 100
METRIC RATING
141st/ 347
METRIC RANK
21.9%
DISABILITY AGE 65 TO 74
98.4/ 100
METRIC RATING
86th/ 347
METRIC RANK
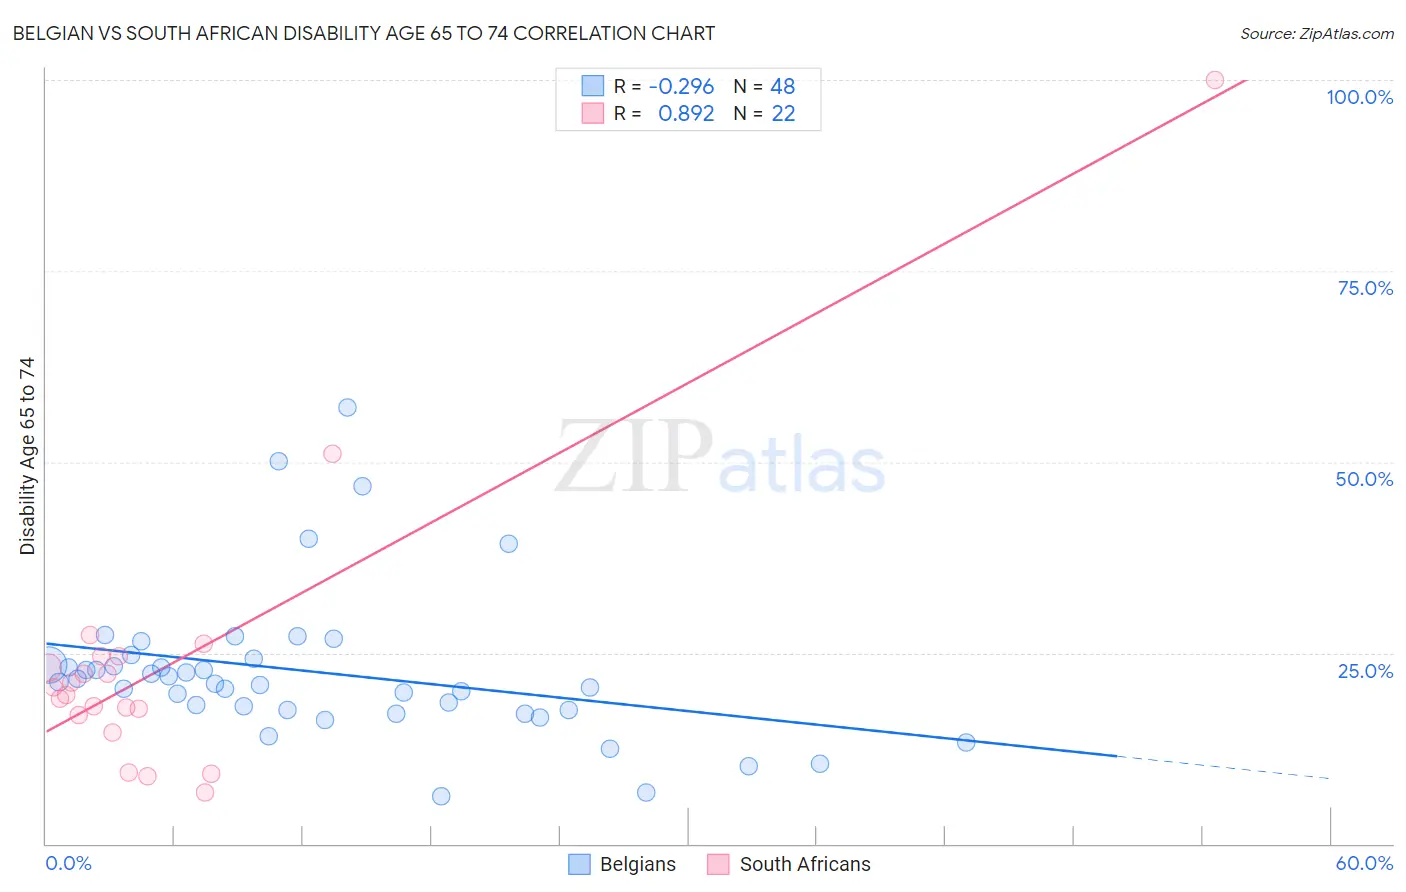
Belgian vs South African Disability Age 65 to 74 Correlation Chart
The statistical analysis conducted on geographies consisting of 355,442,637 people shows a weak negative correlation between the proportion of Belgians and percentage of population with a disability between the ages 65 and 75 in the United States with a correlation coefficient (R) of -0.296 and weighted average of 22.7%. Similarly, the statistical analysis conducted on geographies consisting of 182,352,793 people shows a very strong positive correlation between the proportion of South Africans and percentage of population with a disability between the ages 65 and 75 in the United States with a correlation coefficient (R) of 0.892 and weighted average of 21.9%, a difference of 3.6%.
Disability Age 65 to 74 Correlation Summary
| Measurement | Belgian | South African |
| Minimum | 6.1% | 6.7% |
| Maximum | 57.1% | 100.0% |
| Range | 51.0% | 93.3% |
| Mean | 22.5% | 23.6% |
| Median | 21.0% | 20.0% |
| Interquartile 25% (IQ1) | 17.5% | 16.9% |
| Interquartile 75% (IQ3) | 23.8% | 24.5% |
| Interquartile Range (IQR) | 6.3% | 7.6% |
| Standard Deviation (Sample) | 9.9% | 19.3% |
| Standard Deviation (Population) | 9.8% | 18.8% |
Similar Demographics by Disability Age 65 to 74
Demographics Similar to Belgians by Disability Age 65 to 74
In terms of disability age 65 to 74, the demographic groups most similar to Belgians are Ugandan (22.7%, a difference of 0.010%), Immigrants from Ethiopia (22.7%, a difference of 0.010%), Immigrants from Syria (22.7%, a difference of 0.050%), Arab (22.8%, a difference of 0.070%), and Danish (22.8%, a difference of 0.11%).
| Demographics | Rating | Rank | Disability Age 65 to 74 |
| Afghans | 88.6 /100 | #134 | Excellent 22.6% |
| Immigrants | Ukraine | 88.4 /100 | #135 | Excellent 22.6% |
| Ethiopians | 87.9 /100 | #136 | Excellent 22.7% |
| Taiwanese | 87.6 /100 | #137 | Excellent 22.7% |
| Immigrants | Moldova | 87.3 /100 | #138 | Excellent 22.7% |
| Immigrants | Syria | 85.8 /100 | #139 | Excellent 22.7% |
| Ugandans | 85.4 /100 | #140 | Excellent 22.7% |
| Belgians | 85.3 /100 | #141 | Excellent 22.7% |
| Immigrants | Ethiopia | 85.3 /100 | #142 | Excellent 22.7% |
| Arabs | 84.8 /100 | #143 | Excellent 22.8% |
| Danes | 84.4 /100 | #144 | Excellent 22.8% |
| Immigrants | Uganda | 84.0 /100 | #145 | Excellent 22.8% |
| Alsatians | 83.7 /100 | #146 | Excellent 22.8% |
| Immigrants | Uzbekistan | 83.1 /100 | #147 | Excellent 22.8% |
| New Zealanders | 79.9 /100 | #148 | Good 22.9% |
Demographics Similar to South Africans by Disability Age 65 to 74
In terms of disability age 65 to 74, the demographic groups most similar to South Africans are Immigrants from Lebanon (21.9%, a difference of 0.080%), Immigrants from Spain (21.9%, a difference of 0.18%), Immigrants from Brazil (21.9%, a difference of 0.20%), Australian (22.0%, a difference of 0.34%), and Immigrants from Netherlands (22.0%, a difference of 0.35%).
| Demographics | Rating | Rank | Disability Age 65 to 74 |
| Venezuelans | 99.0 /100 | #79 | Exceptional 21.8% |
| Immigrants | Norway | 98.9 /100 | #80 | Exceptional 21.8% |
| Croatians | 98.9 /100 | #81 | Exceptional 21.8% |
| Immigrants | Indonesia | 98.7 /100 | #82 | Exceptional 21.9% |
| Immigrants | Brazil | 98.5 /100 | #83 | Exceptional 21.9% |
| Immigrants | Spain | 98.5 /100 | #84 | Exceptional 21.9% |
| Immigrants | Lebanon | 98.4 /100 | #85 | Exceptional 21.9% |
| South Africans | 98.4 /100 | #86 | Exceptional 21.9% |
| Australians | 98.0 /100 | #87 | Exceptional 22.0% |
| Immigrants | Netherlands | 97.9 /100 | #88 | Exceptional 22.0% |
| Immigrants | Kuwait | 97.9 /100 | #89 | Exceptional 22.0% |
| Italians | 97.9 /100 | #90 | Exceptional 22.0% |
| Chileans | 97.9 /100 | #91 | Exceptional 22.0% |
| Poles | 97.8 /100 | #92 | Exceptional 22.0% |
| Immigrants | Canada | 97.8 /100 | #93 | Exceptional 22.1% |