Cape Verdean vs Bahamian Disability Age 65 to 74
COMPARE
Cape Verdean
Bahamian
Disability Age 65 to 74
Disability Age 65 to 74 Comparison
Cape Verdeans
Bahamians
25.4%
DISABILITY AGE 65 TO 74
0.2/ 100
METRIC RATING
261st/ 347
METRIC RANK
24.4%
DISABILITY AGE 65 TO 74
4.5/ 100
METRIC RATING
233rd/ 347
METRIC RANK
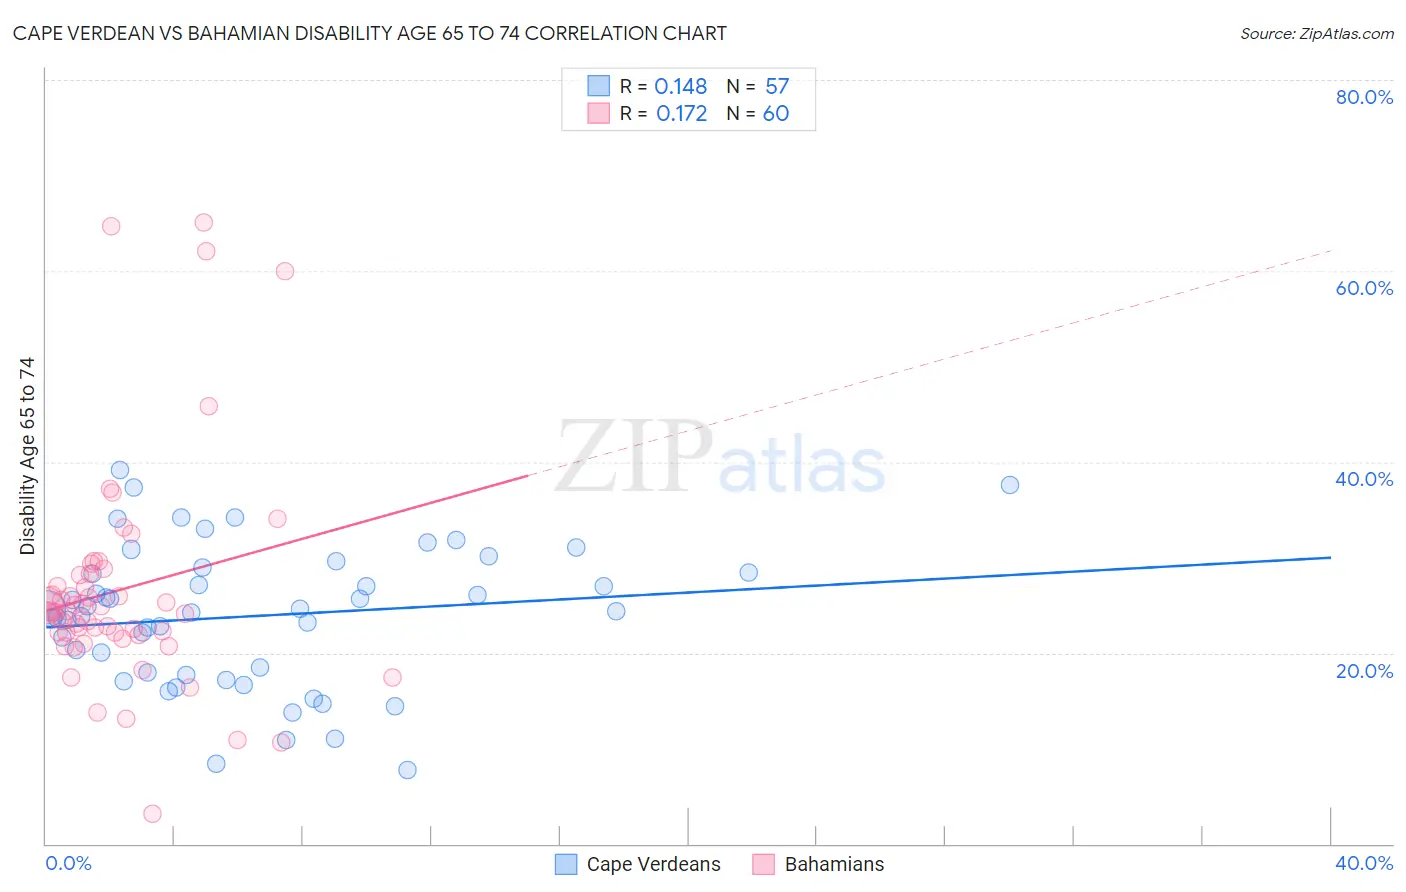
Cape Verdean vs Bahamian Disability Age 65 to 74 Correlation Chart
The statistical analysis conducted on geographies consisting of 107,487,290 people shows a poor positive correlation between the proportion of Cape Verdeans and percentage of population with a disability between the ages 65 and 75 in the United States with a correlation coefficient (R) of 0.148 and weighted average of 25.4%. Similarly, the statistical analysis conducted on geographies consisting of 112,540,799 people shows a poor positive correlation between the proportion of Bahamians and percentage of population with a disability between the ages 65 and 75 in the United States with a correlation coefficient (R) of 0.172 and weighted average of 24.4%, a difference of 4.3%.
Disability Age 65 to 74 Correlation Summary
| Measurement | Cape Verdean | Bahamian |
| Minimum | 7.7% | 3.1% |
| Maximum | 39.2% | 65.1% |
| Range | 31.5% | 61.9% |
| Mean | 23.8% | 26.6% |
| Median | 24.3% | 24.3% |
| Interquartile 25% (IQ1) | 17.8% | 22.0% |
| Interquartile 75% (IQ3) | 28.7% | 28.2% |
| Interquartile Range (IQR) | 10.9% | 6.2% |
| Standard Deviation (Sample) | 7.3% | 11.8% |
| Standard Deviation (Population) | 7.3% | 11.7% |
Similar Demographics by Disability Age 65 to 74
Demographics Similar to Cape Verdeans by Disability Age 65 to 74
In terms of disability age 65 to 74, the demographic groups most similar to Cape Verdeans are Malaysian (25.4%, a difference of 0.080%), Samoan (25.4%, a difference of 0.10%), Iroquois (25.4%, a difference of 0.10%), Immigrants from Cambodia (25.3%, a difference of 0.40%), and Hawaiian (25.5%, a difference of 0.45%).
| Demographics | Rating | Rank | Disability Age 65 to 74 |
| Somalis | 0.6 /100 | #254 | Tragic 25.1% |
| Central Americans | 0.5 /100 | #255 | Tragic 25.1% |
| Immigrants | Somalia | 0.4 /100 | #256 | Tragic 25.2% |
| Guamanians/Chamorros | 0.3 /100 | #257 | Tragic 25.3% |
| Marshallese | 0.3 /100 | #258 | Tragic 25.3% |
| Immigrants | Cambodia | 0.3 /100 | #259 | Tragic 25.3% |
| Malaysians | 0.2 /100 | #260 | Tragic 25.4% |
| Cape Verdeans | 0.2 /100 | #261 | Tragic 25.4% |
| Samoans | 0.2 /100 | #262 | Tragic 25.4% |
| Iroquois | 0.2 /100 | #263 | Tragic 25.4% |
| Hawaiians | 0.2 /100 | #264 | Tragic 25.5% |
| Guatemalans | 0.2 /100 | #265 | Tragic 25.5% |
| Immigrants | Latin America | 0.1 /100 | #266 | Tragic 25.6% |
| Ottawa | 0.1 /100 | #267 | Tragic 25.6% |
| Liberians | 0.1 /100 | #268 | Tragic 25.6% |
Demographics Similar to Bahamians by Disability Age 65 to 74
In terms of disability age 65 to 74, the demographic groups most similar to Bahamians are Panamanian (24.4%, a difference of 0.11%), Immigrants from Zaire (24.3%, a difference of 0.16%), Immigrants from Thailand (24.3%, a difference of 0.21%), Scotch-Irish (24.4%, a difference of 0.26%), and German Russian (24.4%, a difference of 0.30%).
| Demographics | Rating | Rank | Disability Age 65 to 74 |
| Iraqis | 8.1 /100 | #226 | Tragic 24.2% |
| Nigerians | 7.8 /100 | #227 | Tragic 24.2% |
| Whites/Caucasians | 6.6 /100 | #228 | Tragic 24.2% |
| Celtics | 6.4 /100 | #229 | Tragic 24.2% |
| Barbadians | 6.0 /100 | #230 | Tragic 24.3% |
| Immigrants | Thailand | 5.2 /100 | #231 | Tragic 24.3% |
| Immigrants | Zaire | 5.0 /100 | #232 | Tragic 24.3% |
| Bahamians | 4.5 /100 | #233 | Tragic 24.4% |
| Panamanians | 4.2 /100 | #234 | Tragic 24.4% |
| Scotch-Irish | 3.8 /100 | #235 | Tragic 24.4% |
| German Russians | 3.7 /100 | #236 | Tragic 24.4% |
| West Indians | 3.4 /100 | #237 | Tragic 24.5% |
| Immigrants | Ghana | 3.0 /100 | #238 | Tragic 24.5% |
| Immigrants | Caribbean | 2.6 /100 | #239 | Tragic 24.6% |
| Spaniards | 2.4 /100 | #240 | Tragic 24.6% |