Yaqui vs Cypriot Cognitive Disability
COMPARE
Yaqui
Cypriot
Cognitive Disability
Cognitive Disability Comparison
Yaqui
Cypriots
18.5%
COGNITIVE DISABILITY
0.0/ 100
METRIC RATING
313th/ 347
METRIC RANK
17.1%
COGNITIVE DISABILITY
85.7/ 100
METRIC RATING
149th/ 347
METRIC RANK
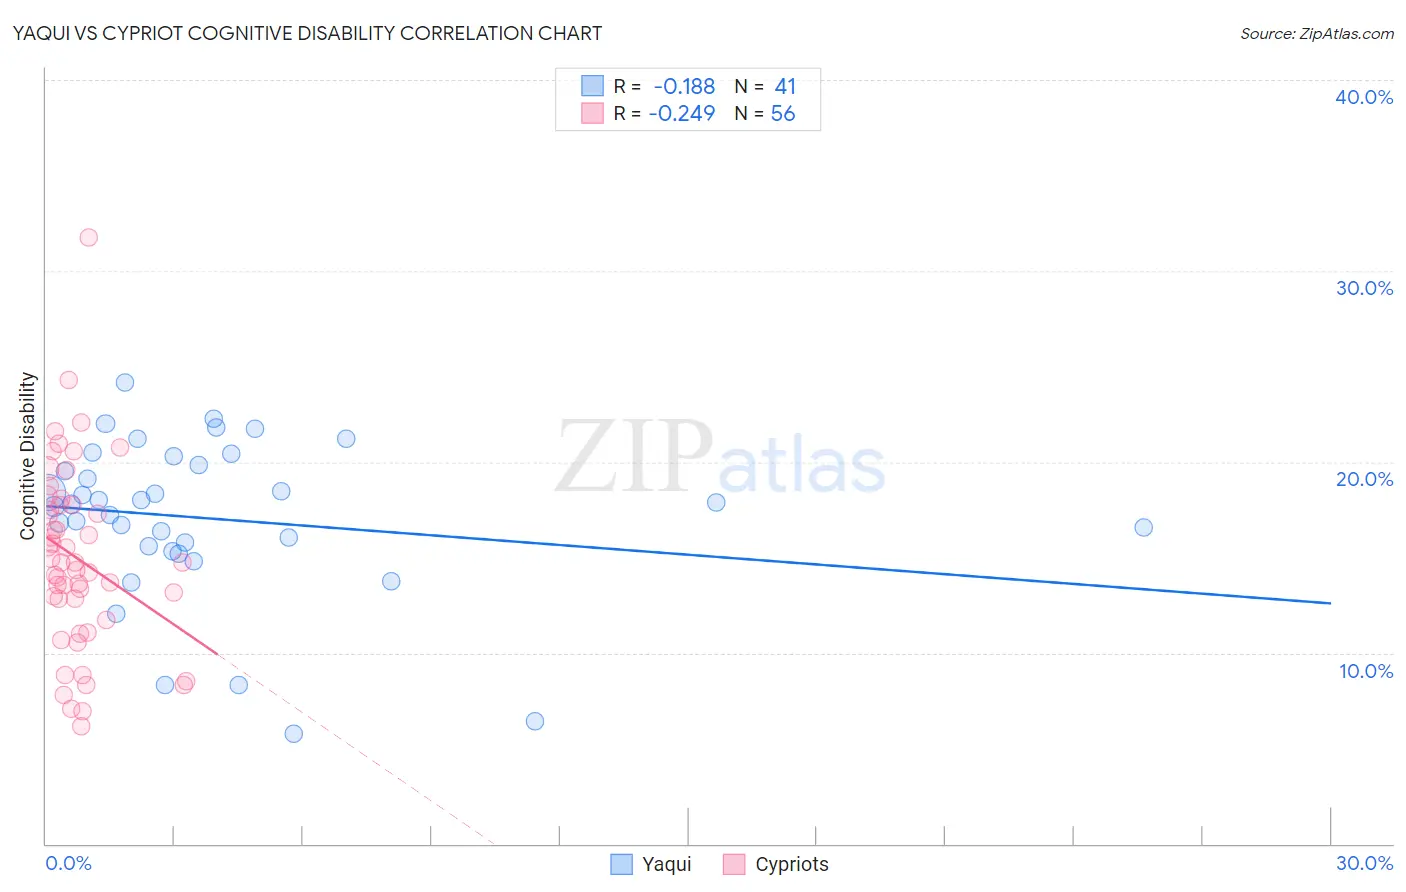
Yaqui vs Cypriot Cognitive Disability Correlation Chart
The statistical analysis conducted on geographies consisting of 107,721,250 people shows a poor negative correlation between the proportion of Yaqui and percentage of population with cognitive disability in the United States with a correlation coefficient (R) of -0.188 and weighted average of 18.5%. Similarly, the statistical analysis conducted on geographies consisting of 61,869,277 people shows a weak negative correlation between the proportion of Cypriots and percentage of population with cognitive disability in the United States with a correlation coefficient (R) of -0.249 and weighted average of 17.1%, a difference of 8.5%.
Cognitive Disability Correlation Summary
| Measurement | Yaqui | Cypriot |
| Minimum | 5.8% | 6.1% |
| Maximum | 24.2% | 31.8% |
| Range | 18.4% | 25.6% |
| Mean | 17.0% | 14.9% |
| Median | 17.8% | 14.7% |
| Interquartile 25% (IQ1) | 15.4% | 12.3% |
| Interquartile 75% (IQ3) | 20.1% | 17.7% |
| Interquartile Range (IQR) | 4.7% | 5.5% |
| Standard Deviation (Sample) | 4.2% | 4.8% |
| Standard Deviation (Population) | 4.1% | 4.8% |
Similar Demographics by Cognitive Disability
Demographics Similar to Yaqui by Cognitive Disability
In terms of cognitive disability, the demographic groups most similar to Yaqui are Subsaharan African (18.5%, a difference of 0.060%), Chickasaw (18.5%, a difference of 0.11%), Immigrants from Dominica (18.6%, a difference of 0.24%), Immigrants from Middle Africa (18.6%, a difference of 0.32%), and Hmong (18.4%, a difference of 0.39%).
| Demographics | Rating | Rank | Cognitive Disability |
| Seminole | 0.0 /100 | #306 | Tragic 18.3% |
| Ugandans | 0.0 /100 | #307 | Tragic 18.3% |
| Immigrants | Western Africa | 0.0 /100 | #308 | Tragic 18.4% |
| Immigrants | Eastern Africa | 0.0 /100 | #309 | Tragic 18.4% |
| Choctaw | 0.0 /100 | #310 | Tragic 18.4% |
| Hmong | 0.0 /100 | #311 | Tragic 18.4% |
| Chickasaw | 0.0 /100 | #312 | Tragic 18.5% |
| Yaqui | 0.0 /100 | #313 | Tragic 18.5% |
| Sub-Saharan Africans | 0.0 /100 | #314 | Tragic 18.5% |
| Immigrants | Dominica | 0.0 /100 | #315 | Tragic 18.6% |
| Immigrants | Middle Africa | 0.0 /100 | #316 | Tragic 18.6% |
| Liberians | 0.0 /100 | #317 | Tragic 18.6% |
| Bangladeshis | 0.0 /100 | #318 | Tragic 18.6% |
| Comanche | 0.0 /100 | #319 | Tragic 18.6% |
| Apache | 0.0 /100 | #320 | Tragic 18.6% |
Demographics Similar to Cypriots by Cognitive Disability
In terms of cognitive disability, the demographic groups most similar to Cypriots are French Canadian (17.1%, a difference of 0.0%), Scotch-Irish (17.1%, a difference of 0.010%), Basque (17.1%, a difference of 0.010%), Costa Rican (17.0%, a difference of 0.14%), and Syrian (17.1%, a difference of 0.15%).
| Demographics | Rating | Rank | Cognitive Disability |
| Carpatho Rusyns | 89.6 /100 | #142 | Excellent 17.0% |
| British | 89.3 /100 | #143 | Excellent 17.0% |
| Immigrants | Brazil | 89.3 /100 | #144 | Excellent 17.0% |
| Immigrants | South Eastern Asia | 88.7 /100 | #145 | Excellent 17.0% |
| Costa Ricans | 88.0 /100 | #146 | Excellent 17.0% |
| Scotch-Irish | 85.9 /100 | #147 | Excellent 17.1% |
| French Canadians | 85.7 /100 | #148 | Excellent 17.1% |
| Cypriots | 85.7 /100 | #149 | Excellent 17.1% |
| Basques | 85.5 /100 | #150 | Excellent 17.1% |
| Syrians | 83.0 /100 | #151 | Excellent 17.1% |
| Immigrants | Indonesia | 82.7 /100 | #152 | Excellent 17.1% |
| Immigrants | Kazakhstan | 80.5 /100 | #153 | Excellent 17.1% |
| Immigrants | Malaysia | 79.3 /100 | #154 | Good 17.1% |
| Brazilians | 78.9 /100 | #155 | Good 17.1% |
| Sri Lankans | 78.9 /100 | #156 | Good 17.1% |