Cambodian vs Spaniard Disability Age Under 5
COMPARE
Cambodian
Spaniard
Disability Age Under 5
Disability Age Under 5 Comparison
Cambodians
Spaniards
1.2%
DISABILITY AGE UNDER 5
95.4/ 100
METRIC RATING
106th/ 347
METRIC RANK
1.4%
DISABILITY AGE UNDER 5
1.4/ 100
METRIC RATING
244th/ 347
METRIC RANK
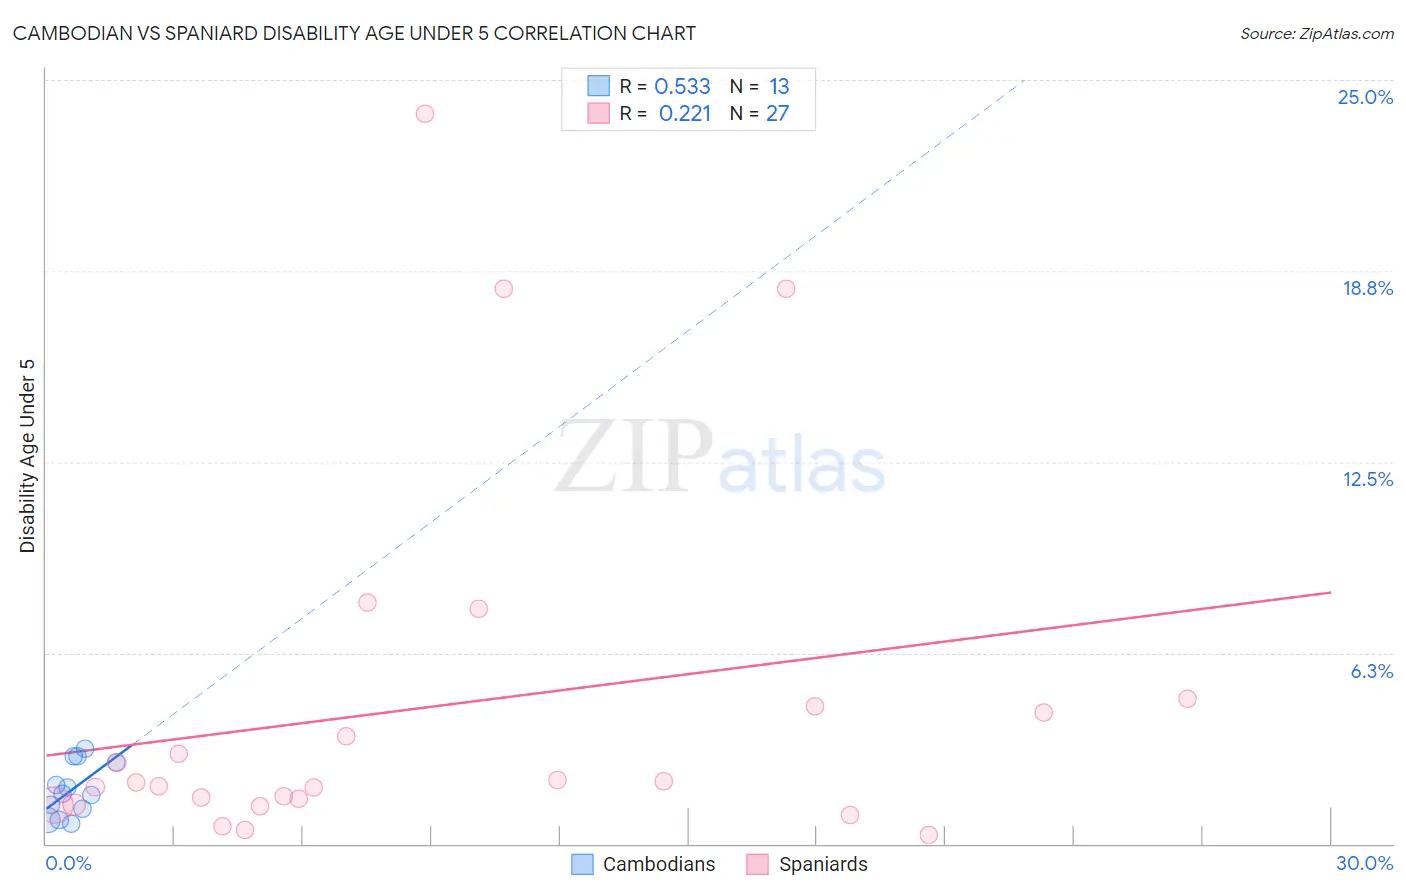
Cambodian vs Spaniard Disability Age Under 5 Correlation Chart
The statistical analysis conducted on geographies consisting of 77,498,292 people shows a substantial positive correlation between the proportion of Cambodians and percentage of population with a disability under the age of 5 in the United States with a correlation coefficient (R) of 0.533 and weighted average of 1.2%. Similarly, the statistical analysis conducted on geographies consisting of 233,722,649 people shows a weak positive correlation between the proportion of Spaniards and percentage of population with a disability under the age of 5 in the United States with a correlation coefficient (R) of 0.221 and weighted average of 1.4%, a difference of 17.7%.
Disability Age Under 5 Correlation Summary
| Measurement | Cambodian | Spaniard |
| Minimum | 0.67% | 0.27% |
| Maximum | 3.1% | 23.9% |
| Range | 2.4% | 23.6% |
| Mean | 1.8% | 4.5% |
| Median | 1.6% | 2.0% |
| Interquartile 25% (IQ1) | 0.96% | 1.3% |
| Interquartile 75% (IQ3) | 2.8% | 4.5% |
| Interquartile Range (IQR) | 1.8% | 3.2% |
| Standard Deviation (Sample) | 0.86% | 6.0% |
| Standard Deviation (Population) | 0.82% | 5.9% |
Similar Demographics by Disability Age Under 5
Demographics Similar to Cambodians by Disability Age Under 5
In terms of disability age under 5, the demographic groups most similar to Cambodians are Immigrants from West Indies (1.2%, a difference of 0.040%), Immigrants from South Africa (1.2%, a difference of 0.10%), Iraqi (1.2%, a difference of 0.17%), Immigrants from Panama (1.2%, a difference of 0.19%), and Immigrants from Lebanon (1.2%, a difference of 0.21%).
| Demographics | Rating | Rank | Disability Age Under 5 |
| Dominicans | 96.3 /100 | #99 | Exceptional 1.1% |
| Nicaraguans | 96.3 /100 | #100 | Exceptional 1.1% |
| Immigrants | Uganda | 96.1 /100 | #101 | Exceptional 1.1% |
| Immigrants | Morocco | 96.0 /100 | #102 | Exceptional 1.2% |
| Immigrants | Nicaragua | 96.0 /100 | #103 | Exceptional 1.2% |
| Indonesians | 95.9 /100 | #104 | Exceptional 1.2% |
| Immigrants | South Africa | 95.6 /100 | #105 | Exceptional 1.2% |
| Cambodians | 95.4 /100 | #106 | Exceptional 1.2% |
| Immigrants | West Indies | 95.3 /100 | #107 | Exceptional 1.2% |
| Iraqis | 95.1 /100 | #108 | Exceptional 1.2% |
| Immigrants | Panama | 95.0 /100 | #109 | Exceptional 1.2% |
| Immigrants | Lebanon | 95.0 /100 | #110 | Exceptional 1.2% |
| Senegalese | 94.6 /100 | #111 | Exceptional 1.2% |
| Immigrants | Australia | 94.4 /100 | #112 | Exceptional 1.2% |
| Immigrants | Oceania | 94.2 /100 | #113 | Exceptional 1.2% |
Demographics Similar to Spaniards by Disability Age Under 5
In terms of disability age under 5, the demographic groups most similar to Spaniards are Immigrants from Cameroon (1.4%, a difference of 0.43%), Potawatomi (1.4%, a difference of 0.52%), Russian (1.4%, a difference of 0.65%), Immigrants from England (1.4%, a difference of 0.66%), and Eastern European (1.4%, a difference of 0.70%).
| Demographics | Rating | Rank | Disability Age Under 5 |
| Basques | 3.0 /100 | #237 | Tragic 1.3% |
| Spanish American Indians | 2.4 /100 | #238 | Tragic 1.3% |
| Immigrants | Austria | 2.3 /100 | #239 | Tragic 1.3% |
| Native Hawaiians | 2.2 /100 | #240 | Tragic 1.3% |
| Maltese | 2.2 /100 | #241 | Tragic 1.3% |
| Lumbee | 2.1 /100 | #242 | Tragic 1.3% |
| Immigrants | Cameroon | 1.7 /100 | #243 | Tragic 1.4% |
| Spaniards | 1.4 /100 | #244 | Tragic 1.4% |
| Potawatomi | 1.1 /100 | #245 | Tragic 1.4% |
| Russians | 1.0 /100 | #246 | Tragic 1.4% |
| Immigrants | England | 1.0 /100 | #247 | Tragic 1.4% |
| Eastern Europeans | 1.0 /100 | #248 | Tragic 1.4% |
| Bermudans | 1.0 /100 | #249 | Tragic 1.4% |
| Africans | 1.0 /100 | #250 | Tragic 1.4% |
| Immigrants | Hungary | 1.0 /100 | #251 | Tragic 1.4% |