British West Indian vs Assyrian/Chaldean/Syriac Disability Age 18 to 34
COMPARE
British West Indian
Assyrian/Chaldean/Syriac
Disability Age 18 to 34
Disability Age 18 to 34 Comparison
British West Indians
Assyrians/Chaldeans/Syriacs
6.0%
DISABILITY AGE 18 TO 34
99.6/ 100
METRIC RATING
61st/ 347
METRIC RANK
6.1%
DISABILITY AGE 18 TO 34
98.9/ 100
METRIC RATING
78th/ 347
METRIC RANK
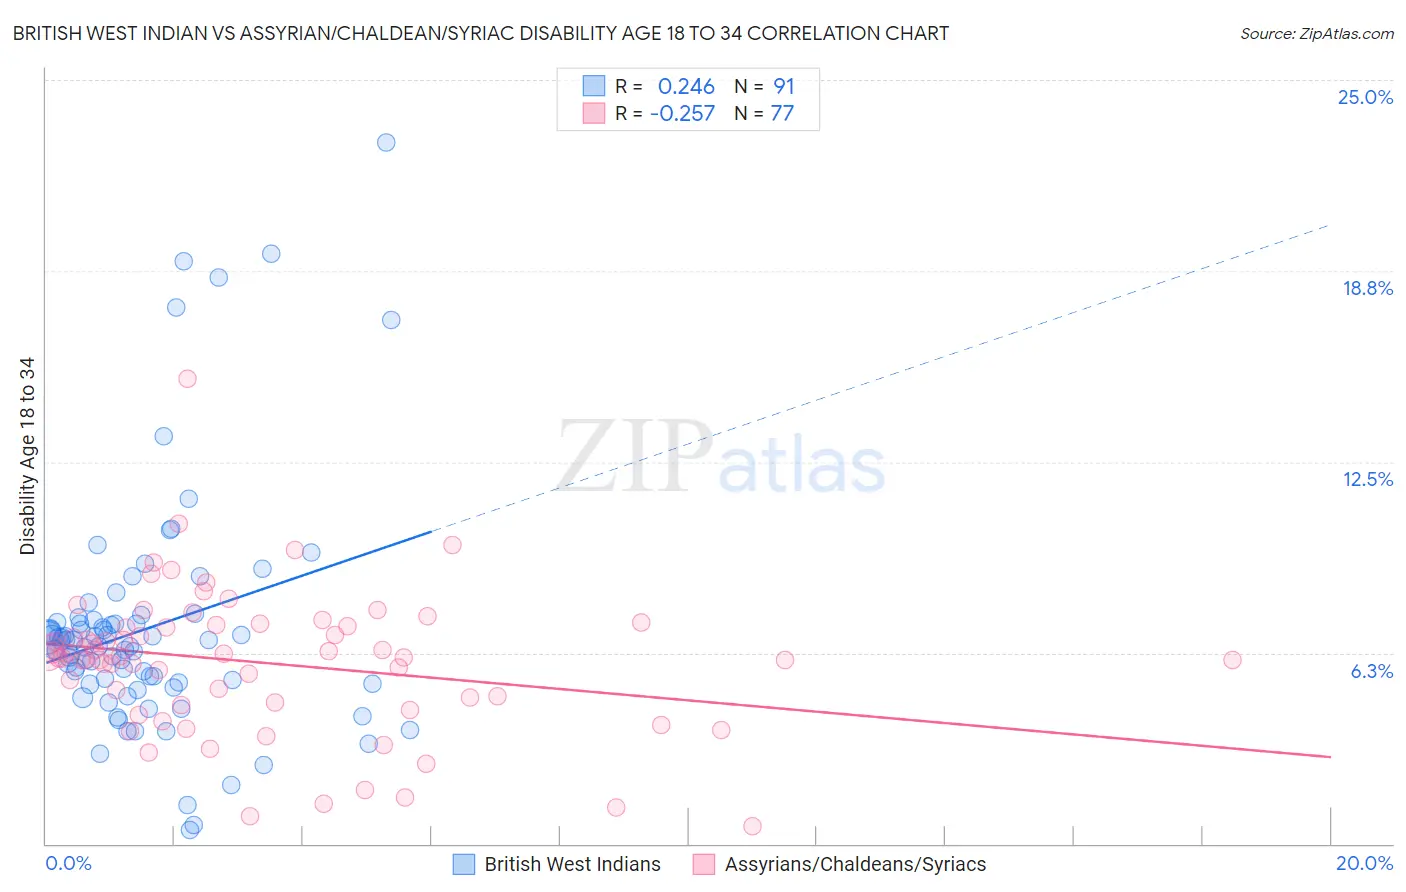
British West Indian vs Assyrian/Chaldean/Syriac Disability Age 18 to 34 Correlation Chart
The statistical analysis conducted on geographies consisting of 152,620,566 people shows a weak positive correlation between the proportion of British West Indians and percentage of population with a disability between the ages 18 and 35 in the United States with a correlation coefficient (R) of 0.246 and weighted average of 6.0%. Similarly, the statistical analysis conducted on geographies consisting of 110,269,916 people shows a weak negative correlation between the proportion of Assyrians/Chaldeans/Syriacs and percentage of population with a disability between the ages 18 and 35 in the United States with a correlation coefficient (R) of -0.257 and weighted average of 6.1%, a difference of 1.9%.
Disability Age 18 to 34 Correlation Summary
| Measurement | British West Indian | Assyrian/Chaldean/Syriac |
| Minimum | 0.44% | 0.58% |
| Maximum | 23.0% | 15.2% |
| Range | 22.5% | 14.6% |
| Mean | 7.0% | 5.9% |
| Median | 6.5% | 6.1% |
| Interquartile 25% (IQ1) | 5.3% | 4.6% |
| Interquartile 75% (IQ3) | 7.3% | 7.1% |
| Interquartile Range (IQR) | 2.0% | 2.5% |
| Standard Deviation (Sample) | 3.9% | 2.4% |
| Standard Deviation (Population) | 3.8% | 2.3% |
Demographics Similar to British West Indians and Assyrians/Chaldeans/Syriacs by Disability Age 18 to 34
In terms of disability age 18 to 34, the demographic groups most similar to British West Indians are Peruvian (6.0%, a difference of 0.030%), Salvadoran (6.0%, a difference of 0.080%), Taiwanese (6.0%, a difference of 0.090%), Trinidadian and Tobagonian (6.0%, a difference of 0.23%), and Immigrants from Caribbean (6.0%, a difference of 0.26%). Similarly, the demographic groups most similar to Assyrians/Chaldeans/Syriacs are Immigrants from Russia (6.1%, a difference of 0.0%), Immigrants from Western Asia (6.1%, a difference of 0.10%), Afghan (6.1%, a difference of 0.29%), Immigrants from Turkey (6.1%, a difference of 0.38%), and Haitian (6.0%, a difference of 0.68%).
| Demographics | Rating | Rank | Disability Age 18 to 34 |
| Immigrants | Caribbean | 99.6 /100 | #59 | Exceptional 6.0% |
| Immigrants | Sri Lanka | 99.6 /100 | #60 | Exceptional 6.0% |
| British West Indians | 99.6 /100 | #61 | Exceptional 6.0% |
| Peruvians | 99.6 /100 | #62 | Exceptional 6.0% |
| Salvadorans | 99.6 /100 | #63 | Exceptional 6.0% |
| Taiwanese | 99.6 /100 | #64 | Exceptional 6.0% |
| Trinidadians and Tobagonians | 99.5 /100 | #65 | Exceptional 6.0% |
| Burmese | 99.5 /100 | #66 | Exceptional 6.0% |
| Immigrants | North Macedonia | 99.5 /100 | #67 | Exceptional 6.0% |
| Immigrants | Poland | 99.5 /100 | #68 | Exceptional 6.0% |
| Immigrants | West Indies | 99.4 /100 | #69 | Exceptional 6.0% |
| Immigrants | Greece | 99.4 /100 | #70 | Exceptional 6.0% |
| Immigrants | Japan | 99.3 /100 | #71 | Exceptional 6.0% |
| Immigrants | Lebanon | 99.2 /100 | #72 | Exceptional 6.0% |
| Cypriots | 99.2 /100 | #73 | Exceptional 6.0% |
| Haitians | 99.2 /100 | #74 | Exceptional 6.0% |
| Immigrants | Turkey | 99.1 /100 | #75 | Exceptional 6.1% |
| Immigrants | Western Asia | 98.9 /100 | #76 | Exceptional 6.1% |
| Immigrants | Russia | 98.9 /100 | #77 | Exceptional 6.1% |
| Assyrians/Chaldeans/Syriacs | 98.9 /100 | #78 | Exceptional 6.1% |
| Afghans | 98.7 /100 | #79 | Exceptional 6.1% |