British West Indian vs Immigrants from West Indies Householder Income Ages 45 - 64 years
COMPARE
British West Indian
Immigrants from West Indies
Householder Income Ages 45 - 64 years
Householder Income Ages 45 - 64 years Comparison
British West Indians
Immigrants from West Indies
$85,571
HOUSEHOLDER INCOME AGES 45 - 64 YEARS
0.1/ 100
METRIC RATING
294th/ 347
METRIC RANK
$88,164
HOUSEHOLDER INCOME AGES 45 - 64 YEARS
0.2/ 100
METRIC RATING
266th/ 347
METRIC RANK
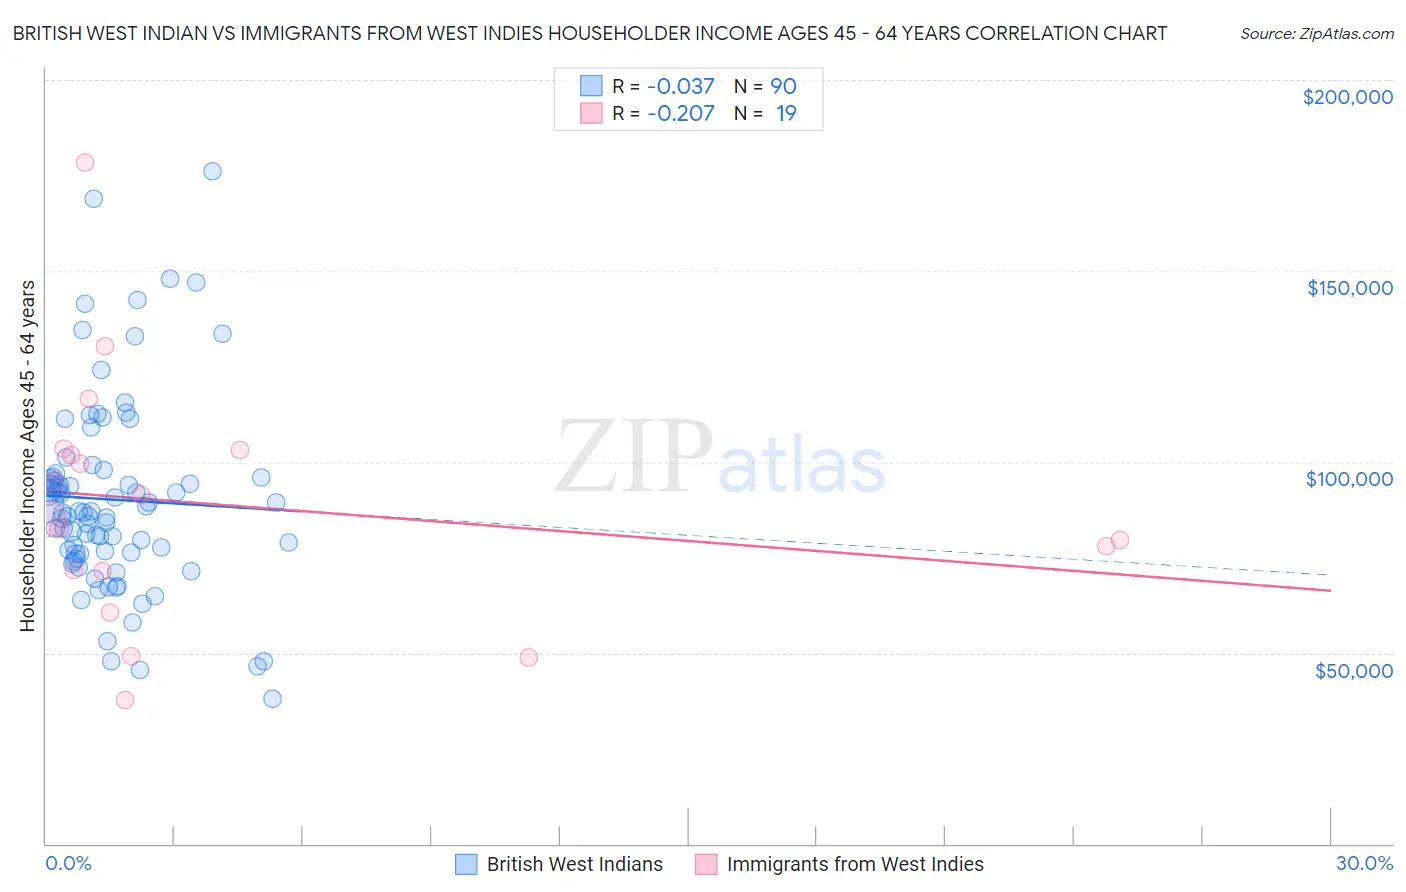
British West Indian vs Immigrants from West Indies Householder Income Ages 45 - 64 years Correlation Chart
The statistical analysis conducted on geographies consisting of 152,542,369 people shows no correlation between the proportion of British West Indians and household income with householder between the ages 45 and 64 in the United States with a correlation coefficient (R) of -0.037 and weighted average of $85,571. Similarly, the statistical analysis conducted on geographies consisting of 72,426,675 people shows a weak negative correlation between the proportion of Immigrants from West Indies and household income with householder between the ages 45 and 64 in the United States with a correlation coefficient (R) of -0.207 and weighted average of $88,164, a difference of 3.0%.
Householder Income Ages 45 - 64 years Correlation Summary
| Measurement | British West Indian | Immigrants from West Indies |
| Minimum | $37,917 | $37,750 |
| Maximum | $176,146 | $178,534 |
| Range | $138,229 | $140,784 |
| Mean | $90,120 | $88,607 |
| Median | $86,807 | $84,978 |
| Interquartile 25% (IQ1) | $76,092 | $71,324 |
| Interquartile 75% (IQ3) | $95,919 | $103,214 |
| Interquartile Range (IQR) | $19,827 | $31,890 |
| Standard Deviation (Sample) | $25,567 | $32,229 |
| Standard Deviation (Population) | $25,425 | $31,370 |
Similar Demographics by Householder Income Ages 45 - 64 years
Demographics Similar to British West Indians by Householder Income Ages 45 - 64 years
In terms of householder income ages 45 - 64 years, the demographic groups most similar to British West Indians are Immigrants from Grenada ($85,552, a difference of 0.020%), Comanche ($85,787, a difference of 0.25%), Immigrants from Zaire ($85,207, a difference of 0.43%), Fijian ($85,187, a difference of 0.45%), and Immigrants from Central America ($85,965, a difference of 0.46%).
| Demographics | Rating | Rank | Householder Income Ages 45 - 64 years |
| Bangladeshis | 0.1 /100 | #287 | Tragic $86,402 |
| Immigrants | St. Vincent and the Grenadines | 0.1 /100 | #288 | Tragic $86,394 |
| Cubans | 0.1 /100 | #289 | Tragic $86,301 |
| Cherokee | 0.1 /100 | #290 | Tragic $86,125 |
| Hispanics or Latinos | 0.1 /100 | #291 | Tragic $86,006 |
| Immigrants | Central America | 0.1 /100 | #292 | Tragic $85,965 |
| Comanche | 0.1 /100 | #293 | Tragic $85,787 |
| British West Indians | 0.1 /100 | #294 | Tragic $85,571 |
| Immigrants | Grenada | 0.1 /100 | #295 | Tragic $85,552 |
| Immigrants | Zaire | 0.1 /100 | #296 | Tragic $85,207 |
| Fijians | 0.1 /100 | #297 | Tragic $85,187 |
| Africans | 0.0 /100 | #298 | Tragic $84,925 |
| Immigrants | Mexico | 0.0 /100 | #299 | Tragic $84,910 |
| Indonesians | 0.0 /100 | #300 | Tragic $84,890 |
| Potawatomi | 0.0 /100 | #301 | Tragic $84,613 |
Demographics Similar to Immigrants from West Indies by Householder Income Ages 45 - 64 years
In terms of householder income ages 45 - 64 years, the demographic groups most similar to Immigrants from West Indies are Hmong ($88,115, a difference of 0.050%), Jamaican ($88,327, a difference of 0.19%), Osage ($88,390, a difference of 0.26%), Immigrants from Senegal ($88,421, a difference of 0.29%), and Immigrants from Micronesia ($87,864, a difference of 0.34%).
| Demographics | Rating | Rank | Householder Income Ages 45 - 64 years |
| Immigrants | Nicaragua | 0.4 /100 | #259 | Tragic $89,108 |
| Liberians | 0.3 /100 | #260 | Tragic $88,929 |
| Belizeans | 0.3 /100 | #261 | Tragic $88,684 |
| Somalis | 0.3 /100 | #262 | Tragic $88,600 |
| Immigrants | Senegal | 0.3 /100 | #263 | Tragic $88,421 |
| Osage | 0.3 /100 | #264 | Tragic $88,390 |
| Jamaicans | 0.2 /100 | #265 | Tragic $88,327 |
| Immigrants | West Indies | 0.2 /100 | #266 | Tragic $88,164 |
| Hmong | 0.2 /100 | #267 | Tragic $88,115 |
| Immigrants | Micronesia | 0.2 /100 | #268 | Tragic $87,864 |
| Spanish Americans | 0.2 /100 | #269 | Tragic $87,836 |
| Immigrants | Liberia | 0.2 /100 | #270 | Tragic $87,739 |
| Guatemalans | 0.2 /100 | #271 | Tragic $87,705 |
| Cape Verdeans | 0.2 /100 | #272 | Tragic $87,580 |
| Spanish American Indians | 0.2 /100 | #273 | Tragic $87,561 |