Bolivian vs Iroquois Male Disability
COMPARE
Bolivian
Iroquois
Male Disability
Male Disability Comparison
Bolivians
Iroquois
9.6%
MALE DISABILITY
100.0/ 100
METRIC RATING
12th/ 347
METRIC RANK
13.6%
MALE DISABILITY
0.0/ 100
METRIC RATING
315th/ 347
METRIC RANK
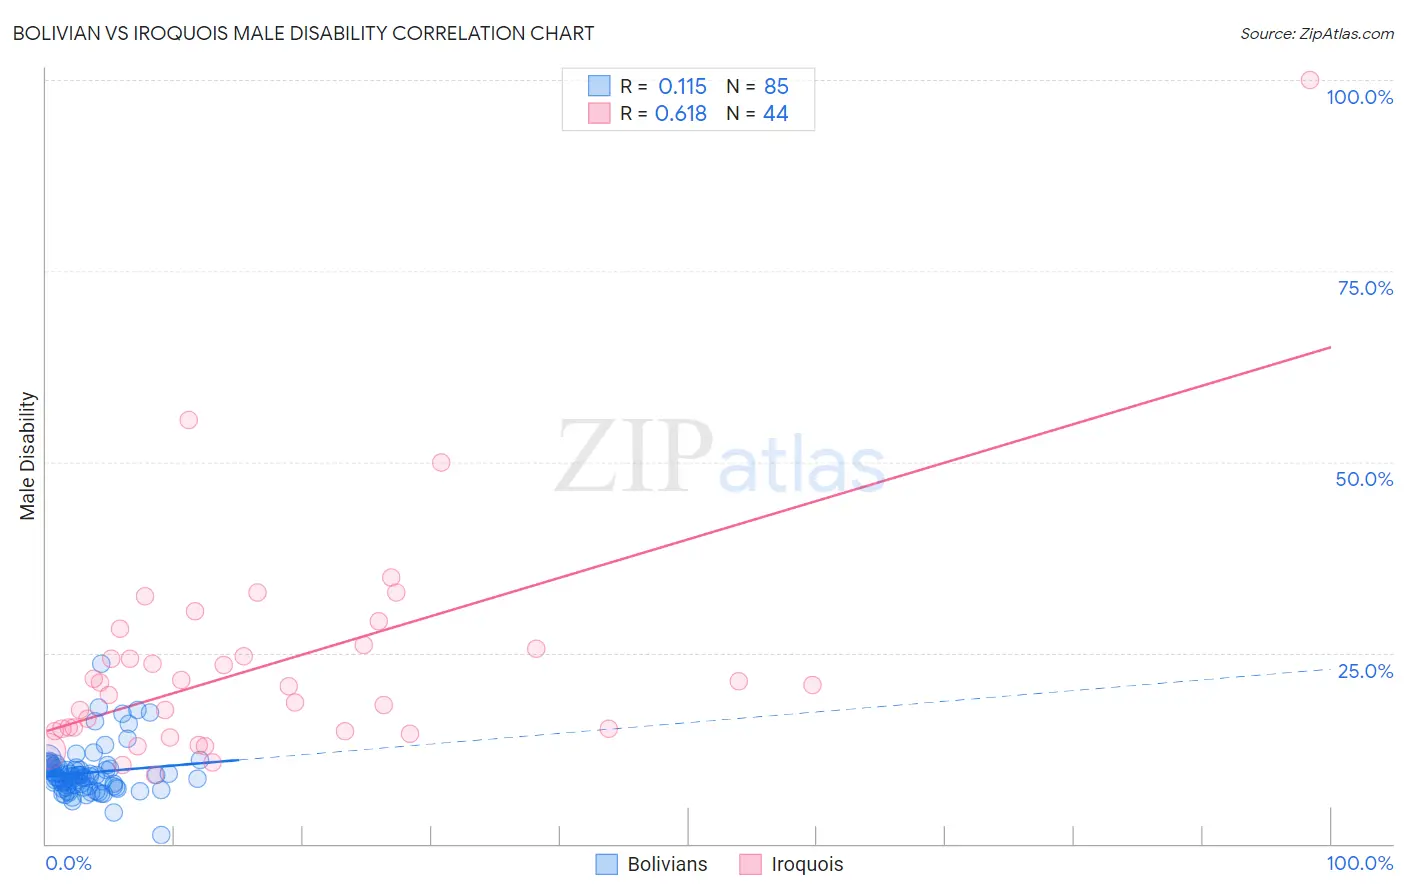
Bolivian vs Iroquois Male Disability Correlation Chart
The statistical analysis conducted on geographies consisting of 184,652,899 people shows a poor positive correlation between the proportion of Bolivians and percentage of males with a disability in the United States with a correlation coefficient (R) of 0.115 and weighted average of 9.6%. Similarly, the statistical analysis conducted on geographies consisting of 207,273,711 people shows a significant positive correlation between the proportion of Iroquois and percentage of males with a disability in the United States with a correlation coefficient (R) of 0.618 and weighted average of 13.6%, a difference of 40.7%.
Male Disability Correlation Summary
| Measurement | Bolivian | Iroquois |
| Minimum | 1.2% | 9.0% |
| Maximum | 23.5% | 100.0% |
| Range | 22.3% | 91.0% |
| Mean | 9.3% | 23.4% |
| Median | 8.9% | 20.7% |
| Interquartile 25% (IQ1) | 7.4% | 14.9% |
| Interquartile 75% (IQ3) | 10.1% | 25.8% |
| Interquartile Range (IQR) | 2.7% | 11.0% |
| Standard Deviation (Sample) | 3.2% | 15.2% |
| Standard Deviation (Population) | 3.2% | 15.0% |
Similar Demographics by Male Disability
Demographics Similar to Bolivians by Male Disability
In terms of male disability, the demographic groups most similar to Bolivians are Iranian (9.7%, a difference of 0.23%), Immigrants from Eastern Asia (9.6%, a difference of 0.24%), Immigrants from Iran (9.7%, a difference of 0.33%), Indian (Asian) (9.7%, a difference of 0.78%), and Immigrants from Israel (9.6%, a difference of 0.79%).
| Demographics | Rating | Rank | Male Disability |
| Immigrants | Hong Kong | 100.0 /100 | #5 | Exceptional 9.4% |
| Immigrants | South Central Asia | 100.0 /100 | #6 | Exceptional 9.4% |
| Immigrants | Bolivia | 100.0 /100 | #7 | Exceptional 9.5% |
| Immigrants | China | 100.0 /100 | #8 | Exceptional 9.5% |
| Immigrants | Singapore | 100.0 /100 | #9 | Exceptional 9.5% |
| Immigrants | Israel | 100.0 /100 | #10 | Exceptional 9.6% |
| Immigrants | Eastern Asia | 100.0 /100 | #11 | Exceptional 9.6% |
| Bolivians | 100.0 /100 | #12 | Exceptional 9.6% |
| Iranians | 100.0 /100 | #13 | Exceptional 9.7% |
| Immigrants | Iran | 100.0 /100 | #14 | Exceptional 9.7% |
| Indians (Asian) | 100.0 /100 | #15 | Exceptional 9.7% |
| Okinawans | 100.0 /100 | #16 | Exceptional 9.8% |
| Immigrants | Korea | 100.0 /100 | #17 | Exceptional 9.8% |
| Immigrants | Pakistan | 100.0 /100 | #18 | Exceptional 9.8% |
| Immigrants | Sri Lanka | 100.0 /100 | #19 | Exceptional 10.0% |
Demographics Similar to Iroquois by Male Disability
In terms of male disability, the demographic groups most similar to Iroquois are Alaska Native (13.6%, a difference of 0.050%), Aleut (13.5%, a difference of 0.16%), Puget Sound Salish (13.5%, a difference of 0.22%), Yakama (13.5%, a difference of 0.24%), and Delaware (13.5%, a difference of 0.79%).
| Demographics | Rating | Rank | Male Disability |
| French American Indians | 0.0 /100 | #308 | Tragic 13.4% |
| Blackfeet | 0.0 /100 | #309 | Tragic 13.4% |
| Immigrants | Azores | 0.0 /100 | #310 | Tragic 13.4% |
| Delaware | 0.0 /100 | #311 | Tragic 13.5% |
| Yakama | 0.0 /100 | #312 | Tragic 13.5% |
| Puget Sound Salish | 0.0 /100 | #313 | Tragic 13.5% |
| Aleuts | 0.0 /100 | #314 | Tragic 13.5% |
| Iroquois | 0.0 /100 | #315 | Tragic 13.6% |
| Alaska Natives | 0.0 /100 | #316 | Tragic 13.6% |
| Paiute | 0.0 /100 | #317 | Tragic 13.7% |
| Cree | 0.0 /100 | #318 | Tragic 13.7% |
| Americans | 0.0 /100 | #319 | Tragic 13.8% |
| Tlingit-Haida | 0.0 /100 | #320 | Tragic 13.8% |
| Shoshone | 0.0 /100 | #321 | Tragic 13.8% |
| Apache | 0.0 /100 | #322 | Tragic 14.0% |