Belgian vs Immigrants from Cuba Self-Care Disability
COMPARE
Belgian
Immigrants from Cuba
Self-Care Disability
Self-Care Disability Comparison
Belgians
Immigrants from Cuba
2.4%
SELF-CARE DISABILITY
90.9/ 100
METRIC RATING
122nd/ 347
METRIC RANK
2.8%
SELF-CARE DISABILITY
0.0/ 100
METRIC RATING
315th/ 347
METRIC RANK
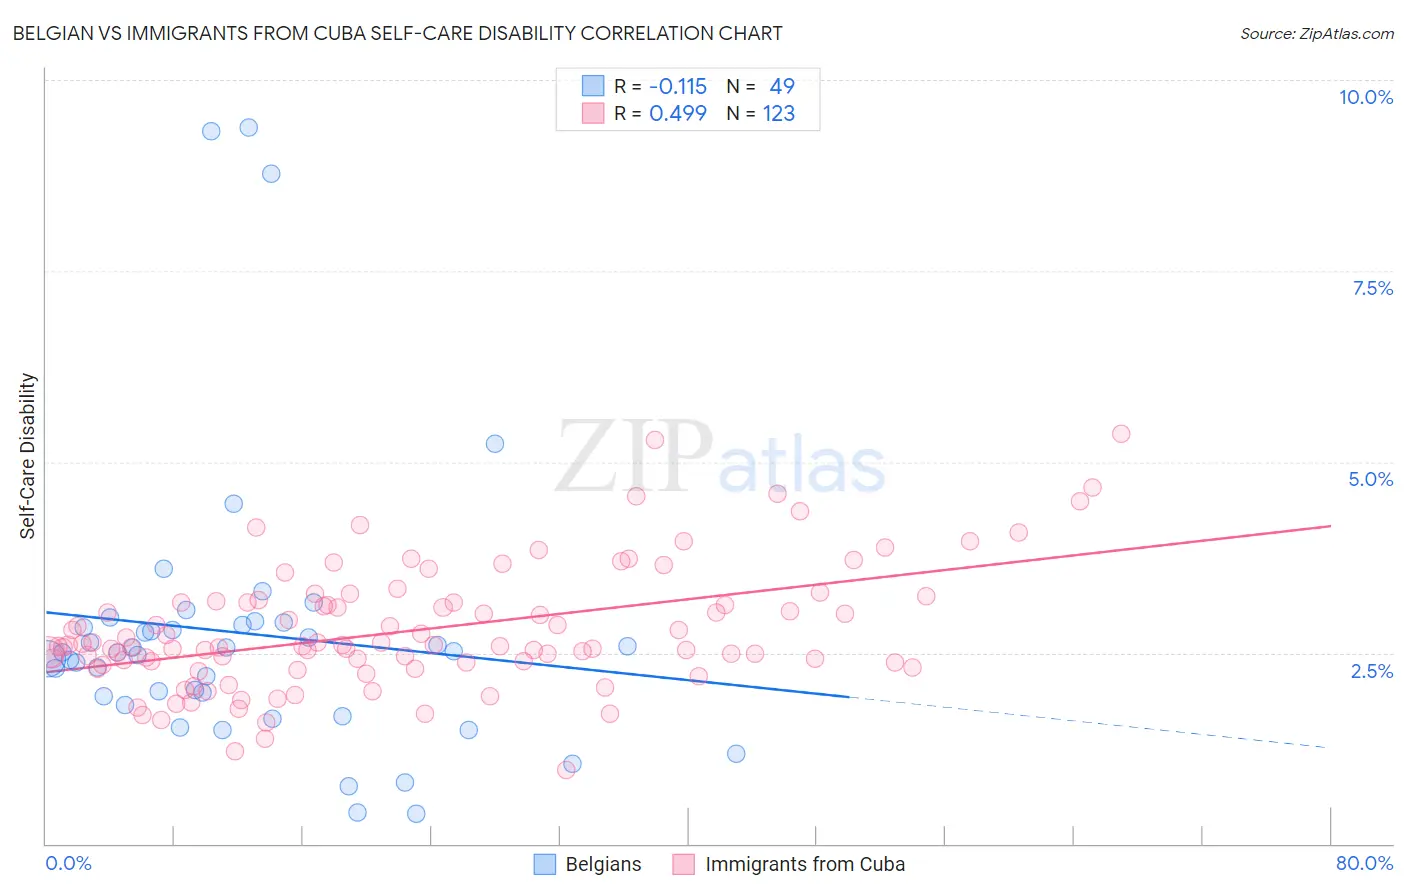
Belgian vs Immigrants from Cuba Self-Care Disability Correlation Chart
The statistical analysis conducted on geographies consisting of 355,581,666 people shows a poor negative correlation between the proportion of Belgians and percentage of population with self-care disability in the United States with a correlation coefficient (R) of -0.115 and weighted average of 2.4%. Similarly, the statistical analysis conducted on geographies consisting of 325,827,675 people shows a moderate positive correlation between the proportion of Immigrants from Cuba and percentage of population with self-care disability in the United States with a correlation coefficient (R) of 0.499 and weighted average of 2.8%, a difference of 18.4%.
Self-Care Disability Correlation Summary
| Measurement | Belgian | Immigrants from Cuba |
| Minimum | 0.39% | 0.96% |
| Maximum | 9.4% | 5.4% |
| Range | 9.0% | 4.4% |
| Mean | 2.8% | 2.8% |
| Median | 2.5% | 2.6% |
| Interquartile 25% (IQ1) | 1.9% | 2.4% |
| Interquartile 75% (IQ3) | 2.9% | 3.2% |
| Interquartile Range (IQR) | 1.0% | 0.79% |
| Standard Deviation (Sample) | 1.9% | 0.80% |
| Standard Deviation (Population) | 1.9% | 0.80% |
Similar Demographics by Self-Care Disability
Demographics Similar to Belgians by Self-Care Disability
In terms of self-care disability, the demographic groups most similar to Belgians are Peruvian (2.4%, a difference of 0.070%), Immigrants from Nigeria (2.4%, a difference of 0.080%), Immigrants from North America (2.4%, a difference of 0.090%), Immigrants from Morocco (2.4%, a difference of 0.090%), and Uruguayan (2.4%, a difference of 0.10%).
| Demographics | Rating | Rank | Self-Care Disability |
| Immigrants | Hong Kong | 93.1 /100 | #115 | Exceptional 2.4% |
| Northern Europeans | 92.9 /100 | #116 | Exceptional 2.4% |
| Taiwanese | 92.5 /100 | #117 | Exceptional 2.4% |
| Immigrants | Canada | 92.0 /100 | #118 | Exceptional 2.4% |
| Immigrants | Sierra Leone | 91.8 /100 | #119 | Exceptional 2.4% |
| Uruguayans | 91.5 /100 | #120 | Exceptional 2.4% |
| Peruvians | 91.3 /100 | #121 | Exceptional 2.4% |
| Belgians | 90.9 /100 | #122 | Exceptional 2.4% |
| Immigrants | Nigeria | 90.3 /100 | #123 | Exceptional 2.4% |
| Immigrants | North America | 90.2 /100 | #124 | Exceptional 2.4% |
| Immigrants | Morocco | 90.2 /100 | #124 | Exceptional 2.4% |
| Hmong | 89.9 /100 | #126 | Excellent 2.4% |
| Colombians | 89.7 /100 | #127 | Excellent 2.4% |
| Immigrants | Hungary | 89.6 /100 | #128 | Excellent 2.4% |
| Immigrants | Romania | 89.3 /100 | #129 | Excellent 2.4% |
Demographics Similar to Immigrants from Cuba by Self-Care Disability
In terms of self-care disability, the demographic groups most similar to Immigrants from Cuba are Menominee (2.8%, a difference of 0.10%), Creek (2.8%, a difference of 0.21%), Immigrants from Dominica (2.8%, a difference of 0.23%), Assyrian/Chaldean/Syriac (2.8%, a difference of 0.24%), and Spanish American Indian (2.9%, a difference of 0.40%).
| Demographics | Rating | Rank | Self-Care Disability |
| Immigrants | Grenada | 0.0 /100 | #308 | Tragic 2.8% |
| Bangladeshis | 0.0 /100 | #309 | Tragic 2.8% |
| British West Indians | 0.0 /100 | #310 | Tragic 2.8% |
| Puget Sound Salish | 0.0 /100 | #311 | Tragic 2.8% |
| Immigrants | Caribbean | 0.0 /100 | #312 | Tragic 2.8% |
| Spanish Americans | 0.0 /100 | #313 | Tragic 2.8% |
| Creek | 0.0 /100 | #314 | Tragic 2.8% |
| Immigrants | Cuba | 0.0 /100 | #315 | Tragic 2.8% |
| Menominee | 0.0 /100 | #316 | Tragic 2.8% |
| Immigrants | Dominica | 0.0 /100 | #317 | Tragic 2.8% |
| Assyrians/Chaldeans/Syriacs | 0.0 /100 | #318 | Tragic 2.8% |
| Spanish American Indians | 0.0 /100 | #319 | Tragic 2.9% |
| Chickasaw | 0.0 /100 | #320 | Tragic 2.9% |
| Navajo | 0.0 /100 | #321 | Tragic 2.9% |
| Comanche | 0.0 /100 | #322 | Tragic 2.9% |