Immigrants from Oceania vs Immigrants from Cuba Self-Care Disability
COMPARE
Immigrants from Oceania
Immigrants from Cuba
Self-Care Disability
Self-Care Disability Comparison
Immigrants from Oceania
Immigrants from Cuba
2.5%
SELF-CARE DISABILITY
28.3/ 100
METRIC RATING
188th/ 347
METRIC RANK
2.8%
SELF-CARE DISABILITY
0.0/ 100
METRIC RATING
315th/ 347
METRIC RANK
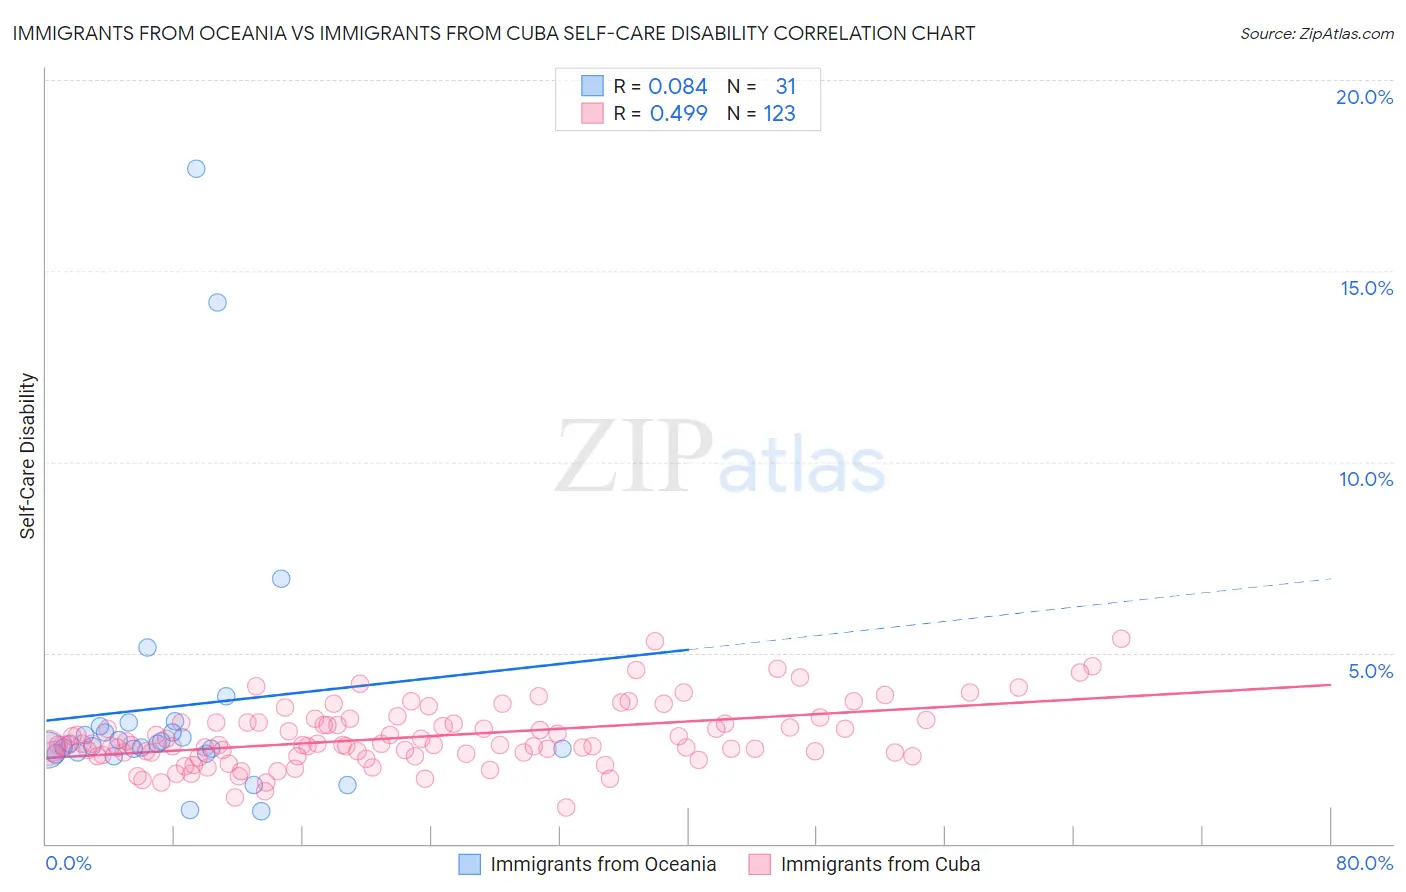
Immigrants from Oceania vs Immigrants from Cuba Self-Care Disability Correlation Chart
The statistical analysis conducted on geographies consisting of 305,144,146 people shows a slight positive correlation between the proportion of Immigrants from Oceania and percentage of population with self-care disability in the United States with a correlation coefficient (R) of 0.084 and weighted average of 2.5%. Similarly, the statistical analysis conducted on geographies consisting of 325,827,675 people shows a moderate positive correlation between the proportion of Immigrants from Cuba and percentage of population with self-care disability in the United States with a correlation coefficient (R) of 0.499 and weighted average of 2.8%, a difference of 13.9%.
Self-Care Disability Correlation Summary
| Measurement | Immigrants from Oceania | Immigrants from Cuba |
| Minimum | 0.86% | 0.96% |
| Maximum | 17.7% | 5.4% |
| Range | 16.8% | 4.4% |
| Mean | 3.6% | 2.8% |
| Median | 2.6% | 2.6% |
| Interquartile 25% (IQ1) | 2.4% | 2.4% |
| Interquartile 75% (IQ3) | 3.1% | 3.2% |
| Interquartile Range (IQR) | 0.68% | 0.79% |
| Standard Deviation (Sample) | 3.5% | 0.80% |
| Standard Deviation (Population) | 3.4% | 0.80% |
Similar Demographics by Self-Care Disability
Demographics Similar to Immigrants from Oceania by Self-Care Disability
In terms of self-care disability, the demographic groups most similar to Immigrants from Oceania are Immigrants from Eastern Europe (2.5%, a difference of 0.010%), Irish (2.5%, a difference of 0.030%), Sioux (2.5%, a difference of 0.22%), Immigrants from El Salvador (2.5%, a difference of 0.26%), and Slavic (2.5%, a difference of 0.33%).
| Demographics | Rating | Rank | Self-Care Disability |
| Ghanaians | 40.4 /100 | #181 | Average 2.5% |
| Maltese | 37.5 /100 | #182 | Fair 2.5% |
| Salvadorans | 36.4 /100 | #183 | Fair 2.5% |
| Yugoslavians | 36.1 /100 | #184 | Fair 2.5% |
| Slavs | 34.3 /100 | #185 | Fair 2.5% |
| Immigrants | El Salvador | 33.0 /100 | #186 | Fair 2.5% |
| Irish | 28.7 /100 | #187 | Fair 2.5% |
| Immigrants | Oceania | 28.3 /100 | #188 | Fair 2.5% |
| Immigrants | Eastern Europe | 28.0 /100 | #189 | Fair 2.5% |
| Sioux | 24.6 /100 | #190 | Fair 2.5% |
| Moroccans | 22.9 /100 | #191 | Fair 2.5% |
| Soviet Union | 22.2 /100 | #192 | Fair 2.5% |
| Ukrainians | 21.4 /100 | #193 | Fair 2.5% |
| Immigrants | Germany | 17.9 /100 | #194 | Poor 2.5% |
| Immigrants | Southern Europe | 15.6 /100 | #195 | Poor 2.5% |
Demographics Similar to Immigrants from Cuba by Self-Care Disability
In terms of self-care disability, the demographic groups most similar to Immigrants from Cuba are Menominee (2.8%, a difference of 0.10%), Creek (2.8%, a difference of 0.21%), Immigrants from Dominica (2.8%, a difference of 0.23%), Assyrian/Chaldean/Syriac (2.8%, a difference of 0.24%), and Spanish American Indian (2.9%, a difference of 0.40%).
| Demographics | Rating | Rank | Self-Care Disability |
| Immigrants | Grenada | 0.0 /100 | #308 | Tragic 2.8% |
| Bangladeshis | 0.0 /100 | #309 | Tragic 2.8% |
| British West Indians | 0.0 /100 | #310 | Tragic 2.8% |
| Puget Sound Salish | 0.0 /100 | #311 | Tragic 2.8% |
| Immigrants | Caribbean | 0.0 /100 | #312 | Tragic 2.8% |
| Spanish Americans | 0.0 /100 | #313 | Tragic 2.8% |
| Creek | 0.0 /100 | #314 | Tragic 2.8% |
| Immigrants | Cuba | 0.0 /100 | #315 | Tragic 2.8% |
| Menominee | 0.0 /100 | #316 | Tragic 2.8% |
| Immigrants | Dominica | 0.0 /100 | #317 | Tragic 2.8% |
| Assyrians/Chaldeans/Syriacs | 0.0 /100 | #318 | Tragic 2.8% |
| Spanish American Indians | 0.0 /100 | #319 | Tragic 2.9% |
| Chickasaw | 0.0 /100 | #320 | Tragic 2.9% |
| Navajo | 0.0 /100 | #321 | Tragic 2.9% |
| Comanche | 0.0 /100 | #322 | Tragic 2.9% |