Immigrants from Eastern Africa vs Portuguese Disability Age 65 to 74
COMPARE
Immigrants from Eastern Africa
Portuguese
Disability Age 65 to 74
Disability Age 65 to 74 Comparison
Immigrants from Eastern Africa
Portuguese
23.4%
DISABILITY AGE 65 TO 74
42.8/ 100
METRIC RATING
183rd/ 347
METRIC RANK
23.5%
DISABILITY AGE 65 TO 74
37.8/ 100
METRIC RATING
187th/ 347
METRIC RANK
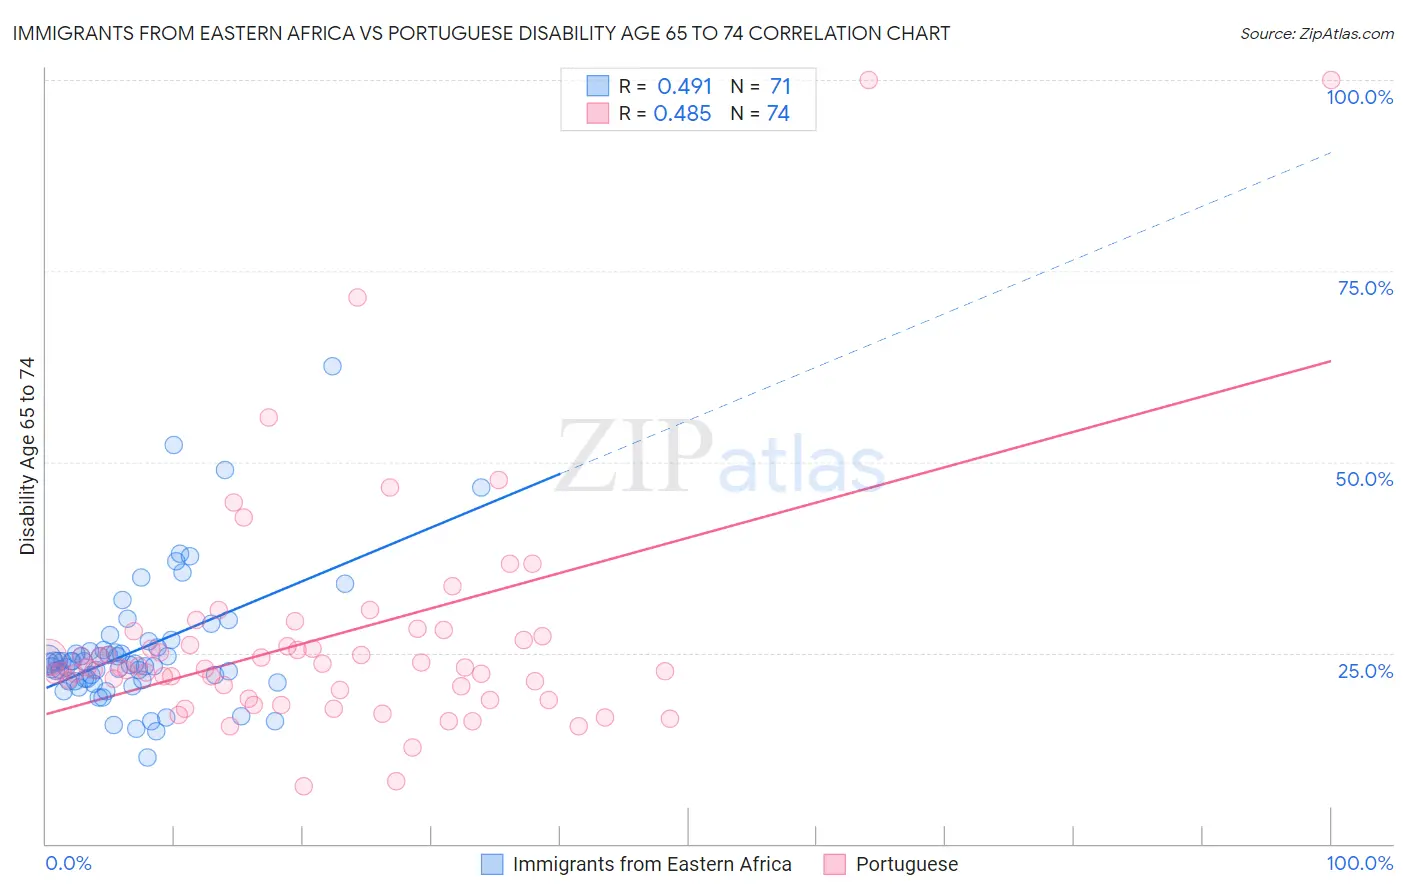
Immigrants from Eastern Africa vs Portuguese Disability Age 65 to 74 Correlation Chart
The statistical analysis conducted on geographies consisting of 354,483,487 people shows a moderate positive correlation between the proportion of Immigrants from Eastern Africa and percentage of population with a disability between the ages 65 and 75 in the United States with a correlation coefficient (R) of 0.491 and weighted average of 23.4%. Similarly, the statistical analysis conducted on geographies consisting of 449,216,913 people shows a moderate positive correlation between the proportion of Portuguese and percentage of population with a disability between the ages 65 and 75 in the United States with a correlation coefficient (R) of 0.485 and weighted average of 23.5%, a difference of 0.30%.
Disability Age 65 to 74 Correlation Summary
| Measurement | Immigrants from Eastern Africa | Portuguese |
| Minimum | 11.3% | 7.5% |
| Maximum | 62.5% | 100.0% |
| Range | 51.2% | 92.5% |
| Mean | 25.4% | 27.0% |
| Median | 23.5% | 23.0% |
| Interquartile 25% (IQ1) | 21.3% | 20.1% |
| Interquartile 75% (IQ3) | 25.8% | 27.1% |
| Interquartile Range (IQR) | 4.5% | 7.0% |
| Standard Deviation (Sample) | 8.6% | 15.8% |
| Standard Deviation (Population) | 8.5% | 15.7% |
Demographics Similar to Immigrants from Eastern Africa and Portuguese by Disability Age 65 to 74
In terms of disability age 65 to 74, the demographic groups most similar to Immigrants from Eastern Africa are Immigrants from Germany (23.4%, a difference of 0.020%), Haitian (23.4%, a difference of 0.030%), Irish (23.4%, a difference of 0.090%), Assyrian/Chaldean/Syriac (23.4%, a difference of 0.15%), and Scandinavian (23.4%, a difference of 0.16%). Similarly, the demographic groups most similar to Portuguese are Basque (23.5%, a difference of 0.040%), Immigrants from Cuba (23.6%, a difference of 0.24%), Haitian (23.4%, a difference of 0.28%), Immigrants from Germany (23.4%, a difference of 0.29%), and Scottish (23.6%, a difference of 0.30%).
| Demographics | Rating | Rank | Disability Age 65 to 74 |
| Dutch | 49.4 /100 | #175 | Average 23.3% |
| Immigrants | Eritrea | 47.5 /100 | #176 | Average 23.4% |
| Immigrants | Haiti | 47.5 /100 | #177 | Average 23.4% |
| Guyanese | 45.8 /100 | #178 | Average 23.4% |
| Immigrants | Sierra Leone | 45.8 /100 | #179 | Average 23.4% |
| Scandinavians | 45.6 /100 | #180 | Average 23.4% |
| Assyrians/Chaldeans/Syriacs | 45.3 /100 | #181 | Average 23.4% |
| Irish | 44.4 /100 | #182 | Average 23.4% |
| Immigrants | Eastern Africa | 42.8 /100 | #183 | Average 23.4% |
| Immigrants | Germany | 42.5 /100 | #184 | Average 23.4% |
| Haitians | 42.4 /100 | #185 | Average 23.4% |
| Basques | 38.4 /100 | #186 | Fair 23.5% |
| Portuguese | 37.8 /100 | #187 | Fair 23.5% |
| Immigrants | Cuba | 34.0 /100 | #188 | Fair 23.6% |
| Scottish | 33.1 /100 | #189 | Fair 23.6% |
| Immigrants | Guyana | 31.2 /100 | #190 | Fair 23.6% |
| Immigrants | Bangladesh | 30.2 /100 | #191 | Fair 23.6% |
| Ecuadorians | 29.7 /100 | #192 | Fair 23.6% |
| English | 28.5 /100 | #193 | Fair 23.6% |
| Sudanese | 27.8 /100 | #194 | Fair 23.7% |
| Immigrants | St. Vincent and the Grenadines | 26.1 /100 | #195 | Fair 23.7% |