Bulgarian vs Portuguese Disability Age 65 to 74
COMPARE
Bulgarian
Portuguese
Disability Age 65 to 74
Disability Age 65 to 74 Comparison
Bulgarians
Portuguese
21.1%
DISABILITY AGE 65 TO 74
99.9/ 100
METRIC RATING
35th/ 347
METRIC RANK
23.5%
DISABILITY AGE 65 TO 74
37.8/ 100
METRIC RATING
187th/ 347
METRIC RANK
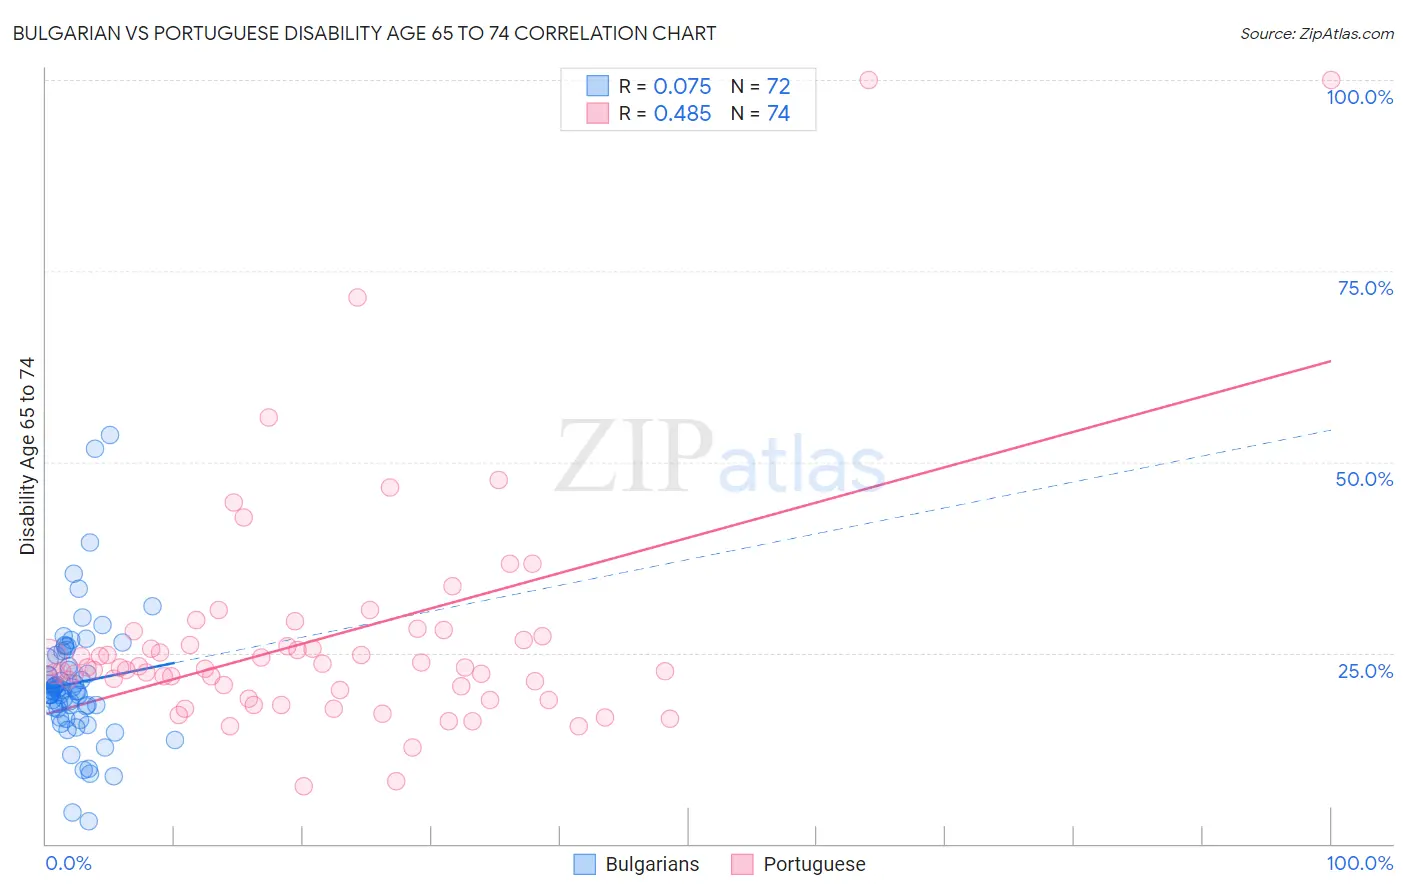
Bulgarian vs Portuguese Disability Age 65 to 74 Correlation Chart
The statistical analysis conducted on geographies consisting of 205,498,287 people shows a slight positive correlation between the proportion of Bulgarians and percentage of population with a disability between the ages 65 and 75 in the United States with a correlation coefficient (R) of 0.075 and weighted average of 21.1%. Similarly, the statistical analysis conducted on geographies consisting of 449,216,913 people shows a moderate positive correlation between the proportion of Portuguese and percentage of population with a disability between the ages 65 and 75 in the United States with a correlation coefficient (R) of 0.485 and weighted average of 23.5%, a difference of 11.5%.
Disability Age 65 to 74 Correlation Summary
| Measurement | Bulgarian | Portuguese |
| Minimum | 2.9% | 7.5% |
| Maximum | 53.5% | 100.0% |
| Range | 50.5% | 92.5% |
| Mean | 21.0% | 27.0% |
| Median | 20.1% | 23.0% |
| Interquartile 25% (IQ1) | 17.8% | 20.1% |
| Interquartile 75% (IQ3) | 24.4% | 27.1% |
| Interquartile Range (IQR) | 6.6% | 7.0% |
| Standard Deviation (Sample) | 8.3% | 15.8% |
| Standard Deviation (Population) | 8.2% | 15.7% |
Similar Demographics by Disability Age 65 to 74
Demographics Similar to Bulgarians by Disability Age 65 to 74
In terms of disability age 65 to 74, the demographic groups most similar to Bulgarians are Immigrants from Sri Lanka (21.1%, a difference of 0.050%), Immigrants from Argentina (21.1%, a difference of 0.090%), Immigrants from Switzerland (21.1%, a difference of 0.19%), Turkish (21.0%, a difference of 0.29%), and Israeli (21.2%, a difference of 0.30%).
| Demographics | Rating | Rank | Disability Age 65 to 74 |
| Immigrants | Czechoslovakia | 99.9 /100 | #28 | Exceptional 21.0% |
| Immigrants | Japan | 99.9 /100 | #29 | Exceptional 21.0% |
| Immigrants | Greece | 99.9 /100 | #30 | Exceptional 21.0% |
| Immigrants | Northern Europe | 99.9 /100 | #31 | Exceptional 21.0% |
| Turks | 99.9 /100 | #32 | Exceptional 21.0% |
| Immigrants | Argentina | 99.9 /100 | #33 | Exceptional 21.1% |
| Immigrants | Sri Lanka | 99.9 /100 | #34 | Exceptional 21.1% |
| Bulgarians | 99.9 /100 | #35 | Exceptional 21.1% |
| Immigrants | Switzerland | 99.8 /100 | #36 | Exceptional 21.1% |
| Israelis | 99.8 /100 | #37 | Exceptional 21.2% |
| Russians | 99.8 /100 | #38 | Exceptional 21.2% |
| Argentineans | 99.8 /100 | #39 | Exceptional 21.2% |
| Latvians | 99.8 /100 | #40 | Exceptional 21.2% |
| Immigrants | Austria | 99.8 /100 | #41 | Exceptional 21.2% |
| Macedonians | 99.7 /100 | #42 | Exceptional 21.3% |
Demographics Similar to Portuguese by Disability Age 65 to 74
In terms of disability age 65 to 74, the demographic groups most similar to Portuguese are Basque (23.5%, a difference of 0.040%), Immigrants from Cuba (23.6%, a difference of 0.24%), Haitian (23.4%, a difference of 0.28%), Immigrants from Germany (23.4%, a difference of 0.29%), and Immigrants from Eastern Africa (23.4%, a difference of 0.30%).
| Demographics | Rating | Rank | Disability Age 65 to 74 |
| Scandinavians | 45.6 /100 | #180 | Average 23.4% |
| Assyrians/Chaldeans/Syriacs | 45.3 /100 | #181 | Average 23.4% |
| Irish | 44.4 /100 | #182 | Average 23.4% |
| Immigrants | Eastern Africa | 42.8 /100 | #183 | Average 23.4% |
| Immigrants | Germany | 42.5 /100 | #184 | Average 23.4% |
| Haitians | 42.4 /100 | #185 | Average 23.4% |
| Basques | 38.4 /100 | #186 | Fair 23.5% |
| Portuguese | 37.8 /100 | #187 | Fair 23.5% |
| Immigrants | Cuba | 34.0 /100 | #188 | Fair 23.6% |
| Scottish | 33.1 /100 | #189 | Fair 23.6% |
| Immigrants | Guyana | 31.2 /100 | #190 | Fair 23.6% |
| Immigrants | Bangladesh | 30.2 /100 | #191 | Fair 23.6% |
| Ecuadorians | 29.7 /100 | #192 | Fair 23.6% |
| English | 28.5 /100 | #193 | Fair 23.6% |
| Sudanese | 27.8 /100 | #194 | Fair 23.7% |