Bermudan vs Pueblo Disability Age Over 75
COMPARE
Bermudan
Pueblo
Disability Age Over 75
Disability Age Over 75 Comparison
Bermudans
Pueblo
46.9%
DISABILITY AGE OVER 75
85.6/ 100
METRIC RATING
143rd/ 347
METRIC RANK
55.9%
DISABILITY AGE OVER 75
0.0/ 100
METRIC RATING
340th/ 347
METRIC RANK
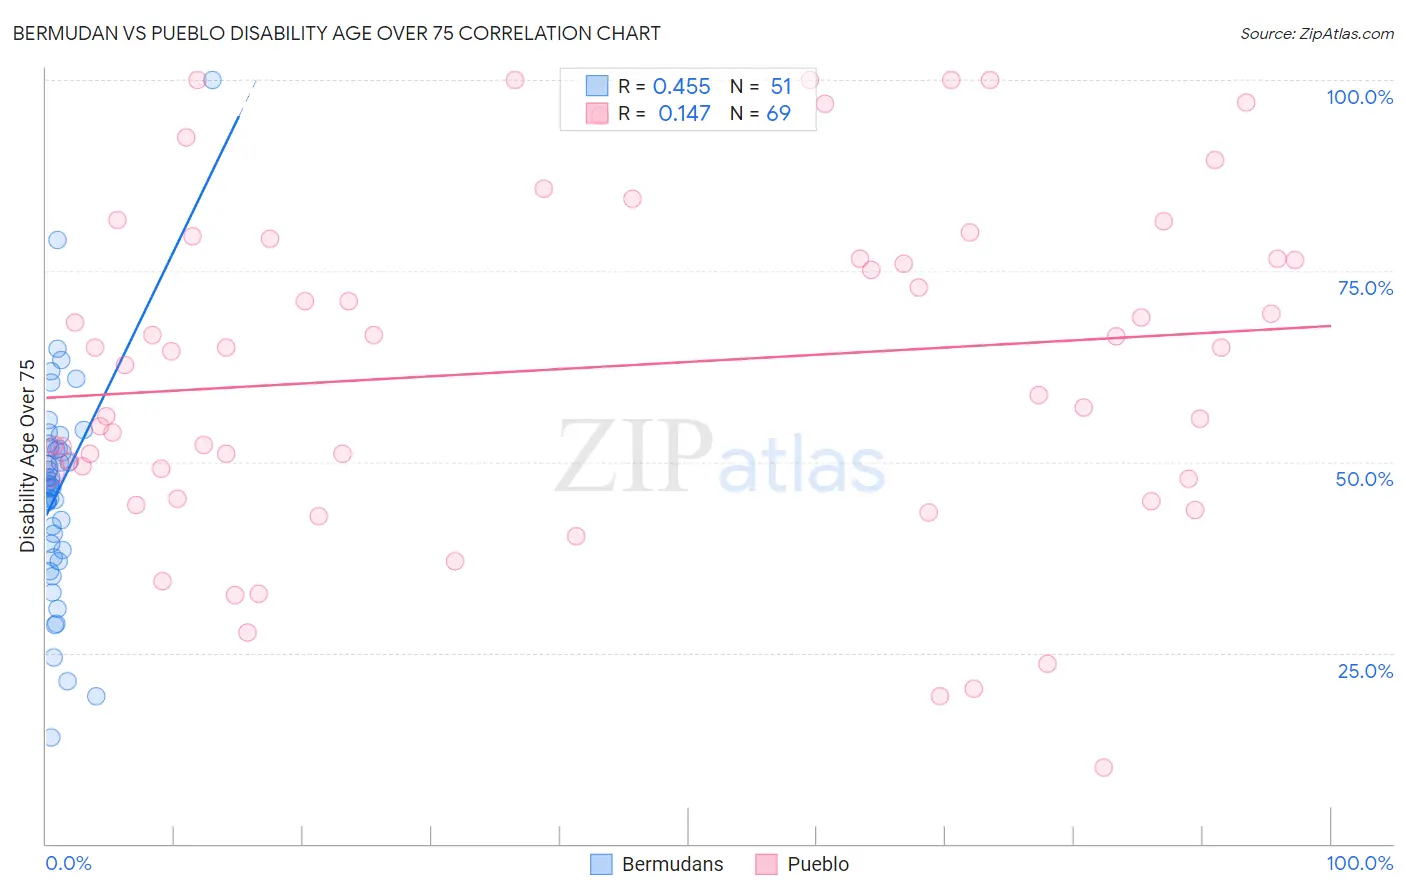
Bermudan vs Pueblo Disability Age Over 75 Correlation Chart
The statistical analysis conducted on geographies consisting of 55,716,155 people shows a moderate positive correlation between the proportion of Bermudans and percentage of population with a disability over the age of 75 in the United States with a correlation coefficient (R) of 0.455 and weighted average of 46.9%. Similarly, the statistical analysis conducted on geographies consisting of 119,996,484 people shows a poor positive correlation between the proportion of Pueblo and percentage of population with a disability over the age of 75 in the United States with a correlation coefficient (R) of 0.147 and weighted average of 55.9%, a difference of 19.2%.
Disability Age Over 75 Correlation Summary
| Measurement | Bermudan | Pueblo |
| Minimum | 13.9% | 10.0% |
| Maximum | 100.0% | 100.0% |
| Range | 86.1% | 90.0% |
| Mean | 46.3% | 62.3% |
| Median | 47.0% | 64.5% |
| Interquartile 25% (IQ1) | 38.5% | 48.4% |
| Interquartile 75% (IQ3) | 52.0% | 77.9% |
| Interquartile Range (IQR) | 13.5% | 29.5% |
| Standard Deviation (Sample) | 14.3% | 22.0% |
| Standard Deviation (Population) | 14.2% | 21.8% |
Similar Demographics by Disability Age Over 75
Demographics Similar to Bermudans by Disability Age Over 75
In terms of disability age over 75, the demographic groups most similar to Bermudans are Venezuelan (46.9%, a difference of 0.020%), Peruvian (46.8%, a difference of 0.040%), Costa Rican (46.9%, a difference of 0.050%), Guyanese (46.9%, a difference of 0.060%), and Lebanese (46.8%, a difference of 0.070%).
| Demographics | Rating | Rank | Disability Age Over 75 |
| Immigrants | Venezuela | 88.6 /100 | #136 | Excellent 46.8% |
| Immigrants | Uganda | 88.5 /100 | #137 | Excellent 46.8% |
| Immigrants | Bosnia and Herzegovina | 88.5 /100 | #138 | Excellent 46.8% |
| Yugoslavians | 88.5 /100 | #139 | Excellent 46.8% |
| Immigrants | Costa Rica | 87.4 /100 | #140 | Excellent 46.8% |
| Lebanese | 87.0 /100 | #141 | Excellent 46.8% |
| Peruvians | 86.5 /100 | #142 | Excellent 46.8% |
| Bermudans | 85.6 /100 | #143 | Excellent 46.9% |
| Venezuelans | 85.0 /100 | #144 | Excellent 46.9% |
| Costa Ricans | 84.5 /100 | #145 | Excellent 46.9% |
| Guyanese | 84.3 /100 | #146 | Excellent 46.9% |
| Immigrants | Peru | 84.1 /100 | #147 | Excellent 46.9% |
| Asians | 81.6 /100 | #148 | Excellent 46.9% |
| Welsh | 81.3 /100 | #149 | Excellent 47.0% |
| Immigrants | Russia | 79.3 /100 | #150 | Good 47.0% |
Demographics Similar to Pueblo by Disability Age Over 75
In terms of disability age over 75, the demographic groups most similar to Pueblo are Pima (55.8%, a difference of 0.080%), Houma (56.2%, a difference of 0.51%), Lumbee (56.2%, a difference of 0.67%), Colville (55.4%, a difference of 0.90%), and Tohono O'odham (56.7%, a difference of 1.5%).
| Demographics | Rating | Rank | Disability Age Over 75 |
| Apache | 0.0 /100 | #333 | Tragic 53.6% |
| Alaskan Athabascans | 0.0 /100 | #334 | Tragic 54.0% |
| Kiowa | 0.0 /100 | #335 | Tragic 54.2% |
| Immigrants | Armenia | 0.0 /100 | #336 | Tragic 54.3% |
| Yuman | 0.0 /100 | #337 | Tragic 54.4% |
| Colville | 0.0 /100 | #338 | Tragic 55.4% |
| Pima | 0.0 /100 | #339 | Tragic 55.8% |
| Pueblo | 0.0 /100 | #340 | Tragic 55.9% |
| Houma | 0.0 /100 | #341 | Tragic 56.2% |
| Lumbee | 0.0 /100 | #342 | Tragic 56.2% |
| Tohono O'odham | 0.0 /100 | #343 | Tragic 56.7% |
| Navajo | 0.0 /100 | #344 | Tragic 58.3% |
| Inupiat | 0.0 /100 | #345 | Tragic 58.4% |
| Tsimshian | 0.0 /100 | #346 | Tragic 59.2% |
| Yup'ik | 0.0 /100 | #347 | Tragic 61.1% |