Bahamian vs Welsh Unemployment
COMPARE
Bahamian
Welsh
Unemployment
Unemployment Comparison
Bahamians
Welsh
5.9%
UNEMPLOYMENT
0.0/ 100
METRIC RATING
274th/ 347
METRIC RANK
4.7%
UNEMPLOYMENT
99.9/ 100
METRIC RATING
21st/ 347
METRIC RANK
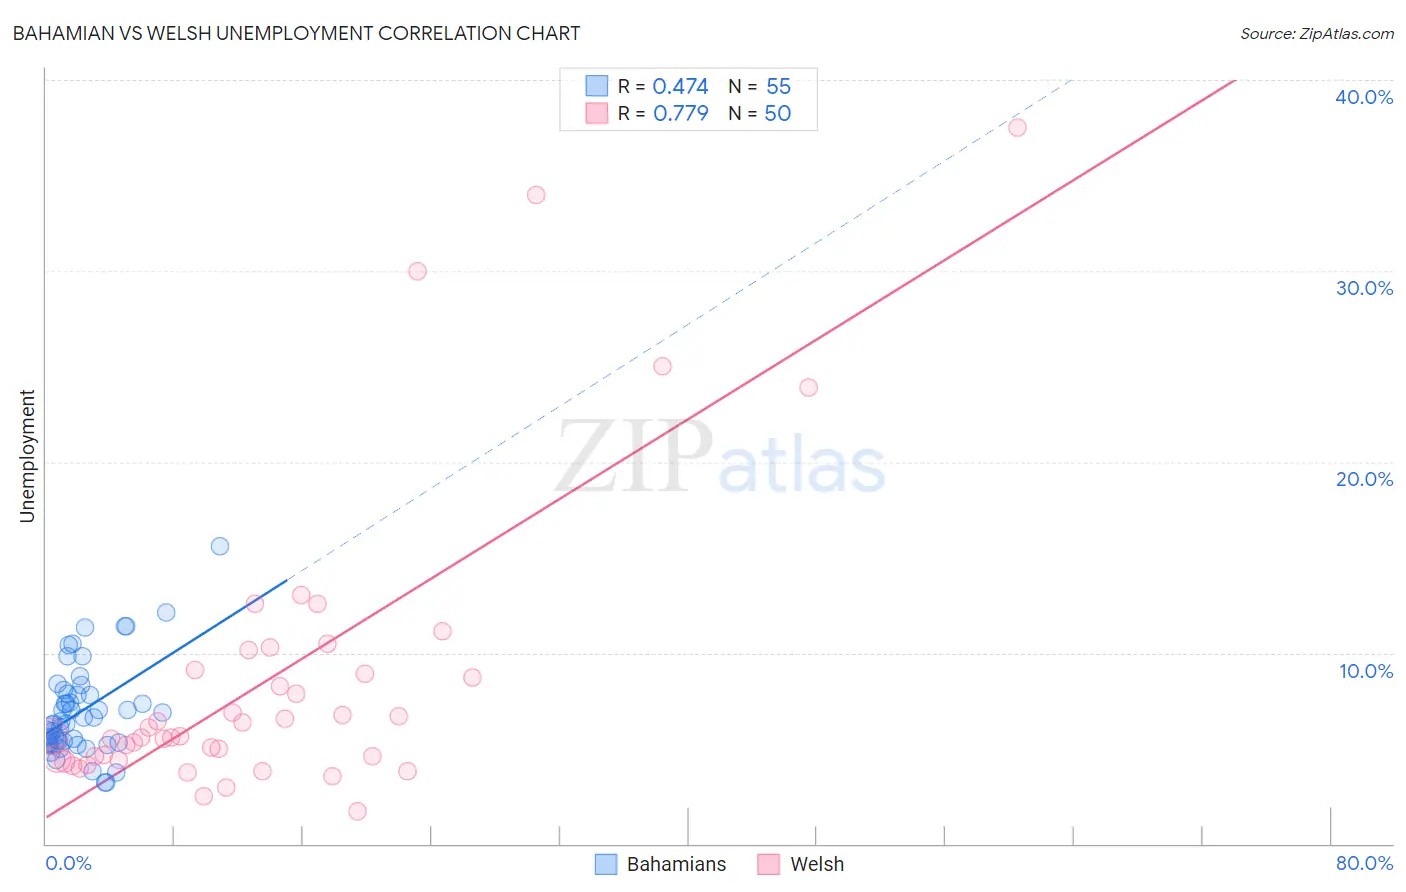
Bahamian vs Welsh Unemployment Correlation Chart
The statistical analysis conducted on geographies consisting of 112,657,665 people shows a moderate positive correlation between the proportion of Bahamians and unemployment in the United States with a correlation coefficient (R) of 0.474 and weighted average of 5.9%. Similarly, the statistical analysis conducted on geographies consisting of 526,178,789 people shows a strong positive correlation between the proportion of Welsh and unemployment in the United States with a correlation coefficient (R) of 0.779 and weighted average of 4.7%, a difference of 26.4%.
Unemployment Correlation Summary
| Measurement | Bahamian | Welsh |
| Minimum | 3.2% | 1.7% |
| Maximum | 15.6% | 37.5% |
| Range | 12.4% | 35.8% |
| Mean | 7.0% | 8.7% |
| Median | 6.4% | 5.6% |
| Interquartile 25% (IQ1) | 5.3% | 4.5% |
| Interquartile 75% (IQ3) | 7.9% | 9.1% |
| Interquartile Range (IQR) | 2.6% | 4.7% |
| Standard Deviation (Sample) | 2.4% | 7.8% |
| Standard Deviation (Population) | 2.4% | 7.8% |
Similar Demographics by Unemployment
Demographics Similar to Bahamians by Unemployment
In terms of unemployment, the demographic groups most similar to Bahamians are Immigrants from Latin America (5.9%, a difference of 0.21%), Immigrants from Fiji (5.9%, a difference of 0.29%), Hispanic or Latino (5.9%, a difference of 0.46%), Immigrants from Central America (6.0%, a difference of 0.49%), and Armenian (6.0%, a difference of 0.84%).
| Demographics | Rating | Rank | Unemployment |
| Immigrants | Nigeria | 0.1 /100 | #267 | Tragic 5.8% |
| Immigrants | Sierra Leone | 0.1 /100 | #268 | Tragic 5.8% |
| Immigrants | El Salvador | 0.1 /100 | #269 | Tragic 5.8% |
| Blackfeet | 0.1 /100 | #270 | Tragic 5.8% |
| Mexicans | 0.1 /100 | #271 | Tragic 5.9% |
| Hispanics or Latinos | 0.0 /100 | #272 | Tragic 5.9% |
| Immigrants | Fiji | 0.0 /100 | #273 | Tragic 5.9% |
| Bahamians | 0.0 /100 | #274 | Tragic 5.9% |
| Immigrants | Latin America | 0.0 /100 | #275 | Tragic 5.9% |
| Immigrants | Central America | 0.0 /100 | #276 | Tragic 6.0% |
| Armenians | 0.0 /100 | #277 | Tragic 6.0% |
| Ghanaians | 0.0 /100 | #278 | Tragic 6.0% |
| Immigrants | Mexico | 0.0 /100 | #279 | Tragic 6.0% |
| Immigrants | Western Africa | 0.0 /100 | #280 | Tragic 6.0% |
| Africans | 0.0 /100 | #281 | Tragic 6.1% |
Demographics Similar to Welsh by Unemployment
In terms of unemployment, the demographic groups most similar to Welsh are Thai (4.7%, a difference of 0.0%), Carpatho Rusyn (4.7%, a difference of 0.020%), British (4.7%, a difference of 0.30%), Venezuelan (4.7%, a difference of 0.38%), and Latvian (4.7%, a difference of 0.45%).
| Demographics | Rating | Rank | Unemployment |
| Immigrants | Cuba | 100.0 /100 | #14 | Exceptional 4.6% |
| Europeans | 99.9 /100 | #15 | Exceptional 4.6% |
| Chinese | 99.9 /100 | #16 | Exceptional 4.7% |
| Slovenes | 99.9 /100 | #17 | Exceptional 4.7% |
| Immigrants | Venezuela | 99.9 /100 | #18 | Exceptional 4.7% |
| Scottish | 99.9 /100 | #19 | Exceptional 4.7% |
| Carpatho Rusyns | 99.9 /100 | #20 | Exceptional 4.7% |
| Welsh | 99.9 /100 | #21 | Exceptional 4.7% |
| Thais | 99.9 /100 | #22 | Exceptional 4.7% |
| British | 99.9 /100 | #23 | Exceptional 4.7% |
| Venezuelans | 99.9 /100 | #24 | Exceptional 4.7% |
| Latvians | 99.9 /100 | #25 | Exceptional 4.7% |
| Bulgarians | 99.9 /100 | #26 | Exceptional 4.7% |
| Finns | 99.9 /100 | #27 | Exceptional 4.7% |
| Cubans | 99.8 /100 | #28 | Exceptional 4.7% |