Bahamian vs Immigrants from Thailand Cognitive Disability
COMPARE
Bahamian
Immigrants from Thailand
Cognitive Disability
Cognitive Disability Comparison
Bahamians
Immigrants from Thailand
17.9%
COGNITIVE DISABILITY
0.6/ 100
METRIC RATING
256th/ 347
METRIC RANK
17.9%
COGNITIVE DISABILITY
0.8/ 100
METRIC RATING
246th/ 347
METRIC RANK
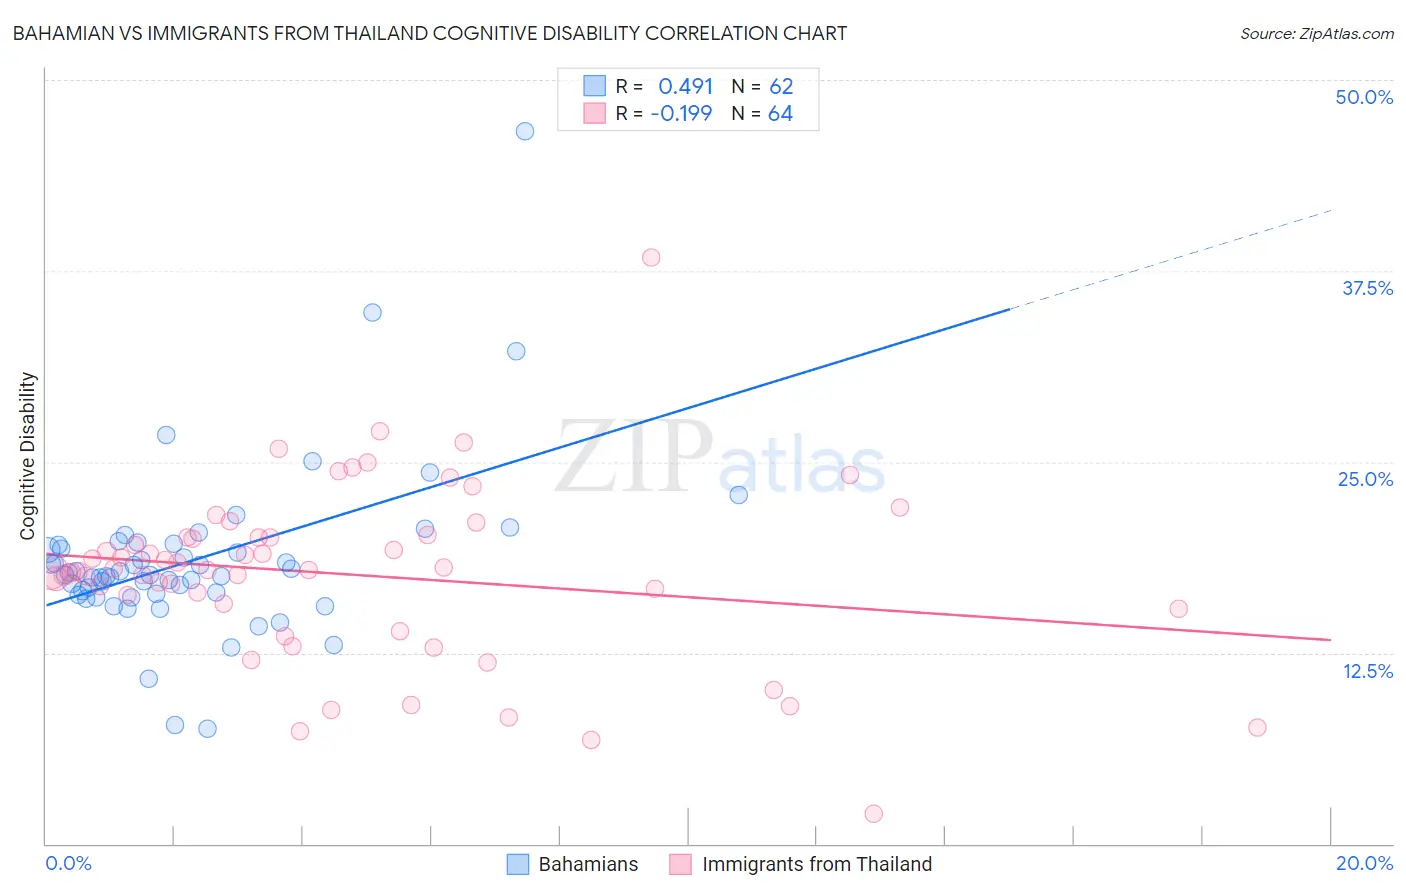
Bahamian vs Immigrants from Thailand Cognitive Disability Correlation Chart
The statistical analysis conducted on geographies consisting of 112,674,908 people shows a moderate positive correlation between the proportion of Bahamians and percentage of population with cognitive disability in the United States with a correlation coefficient (R) of 0.491 and weighted average of 17.9%. Similarly, the statistical analysis conducted on geographies consisting of 316,987,546 people shows a poor negative correlation between the proportion of Immigrants from Thailand and percentage of population with cognitive disability in the United States with a correlation coefficient (R) of -0.199 and weighted average of 17.9%, a difference of 0.17%.
Cognitive Disability Correlation Summary
| Measurement | Bahamian | Immigrants from Thailand |
| Minimum | 7.5% | 2.0% |
| Maximum | 46.6% | 38.4% |
| Range | 39.1% | 36.4% |
| Mean | 18.6% | 17.6% |
| Median | 17.6% | 17.9% |
| Interquartile 25% (IQ1) | 16.4% | 15.5% |
| Interquartile 75% (IQ3) | 19.6% | 20.1% |
| Interquartile Range (IQR) | 3.2% | 4.5% |
| Standard Deviation (Sample) | 5.6% | 5.8% |
| Standard Deviation (Population) | 5.6% | 5.8% |
Demographics Similar to Bahamians and Immigrants from Thailand by Cognitive Disability
In terms of cognitive disability, the demographic groups most similar to Bahamians are Immigrants from the Azores (17.9%, a difference of 0.0%), Hopi (17.9%, a difference of 0.010%), Hispanic or Latino (17.9%, a difference of 0.010%), Immigrants from Grenada (17.9%, a difference of 0.020%), and Malaysian (17.9%, a difference of 0.030%). Similarly, the demographic groups most similar to Immigrants from Thailand are Trinidadian and Tobagonian (17.9%, a difference of 0.020%), Samoan (17.9%, a difference of 0.070%), French American Indian (17.9%, a difference of 0.080%), Jamaican (17.9%, a difference of 0.12%), and Cree (17.9%, a difference of 0.13%).
| Demographics | Rating | Rank | Cognitive Disability |
| Mexicans | 1.1 /100 | #241 | Tragic 17.8% |
| Paiute | 1.1 /100 | #242 | Tragic 17.8% |
| Immigrants | Bangladesh | 1.0 /100 | #243 | Tragic 17.8% |
| Jamaicans | 0.9 /100 | #244 | Tragic 17.9% |
| Trinidadians and Tobagonians | 0.8 /100 | #245 | Tragic 17.9% |
| Immigrants | Thailand | 0.8 /100 | #246 | Tragic 17.9% |
| Samoans | 0.7 /100 | #247 | Tragic 17.9% |
| French American Indians | 0.7 /100 | #248 | Tragic 17.9% |
| Cree | 0.7 /100 | #249 | Tragic 17.9% |
| Immigrants | Ethiopia | 0.7 /100 | #250 | Tragic 17.9% |
| Malaysians | 0.6 /100 | #251 | Tragic 17.9% |
| Immigrants | Grenada | 0.6 /100 | #252 | Tragic 17.9% |
| Hopi | 0.6 /100 | #253 | Tragic 17.9% |
| Hispanics or Latinos | 0.6 /100 | #254 | Tragic 17.9% |
| Immigrants | Azores | 0.6 /100 | #255 | Tragic 17.9% |
| Bahamians | 0.6 /100 | #256 | Tragic 17.9% |
| Mexican American Indians | 0.6 /100 | #257 | Tragic 17.9% |
| Immigrants | Armenia | 0.6 /100 | #258 | Tragic 17.9% |
| Ethiopians | 0.5 /100 | #259 | Tragic 17.9% |
| Immigrants | Belize | 0.5 /100 | #260 | Tragic 17.9% |
| Guamanians/Chamorros | 0.5 /100 | #261 | Tragic 17.9% |