Yup'ik vs Immigrants from Vietnam Female Disability

COMPARE

Yup'ik
Race
Ancestry
AfghanAfricanAlaska NativeAlaskan AthabascanAlbanianAleutAlsatianAmericanApacheArabArapahoArgentineanArmenianAssyrian/Chaldean/SyriacAustralianAustrianBahamianBangladeshiBarbadianBasqueBelgianBelizeanBermudanBhutaneseBlackfeetBolivianBrazilianBritishBritish West IndianBulgarianBurmeseCajunCambodianCanadianCape VerdeanCarpatho RusynCelticCentral AmericanCentral American IndianCherokeeCheyenneChickasawChileanChineseChippewaChoctawColombianColvilleComancheCosta RicanCreeCreekCroatianCrowCubanCypriotCzechCzechoslovakianDanishDelawareDominicanDutchDutch West IndianEastern EuropeanEcuadorianEgyptianEnglishEstonianEthiopianEuropeanFijianFilipinoFinnishFrenchFrench American IndianFrench CanadianGermanGerman RussianGhanaianGreekGuamanian/ChamorroGuatemalanGuyaneseHaitianHmongHonduranHopiHoumaHungarianIcelanderIndian (Asian)IndonesianInupiatIranianIraqiIrishIroquoisIsraeliItalianJamaicanJapaneseJordanianKenyanKiowaKoreanLaotianLatvianLebaneseLiberianLithuanianLumbeeLuxembourgerMacedonianMalaysianMalteseMarshalleseMenomineeMexicanMexican American IndianMongolianMoroccanNative HawaiianNavajoNepaleseNew ZealanderNicaraguanNigerianNorthern EuropeanNorwegianOkinawanOsageOttawaPaiutePakistaniPalestinianPanamanianParaguayanPennsylvania GermanPeruvianPimaPolishPortuguesePotawatomiPuebloPuerto RicanPuget Sound SalishRomanianRussianSalvadoranSamoanScandinavianScotch-IrishScottishSeminoleSenegaleseSerbianShoshoneSierra LeoneanSiouxSlavicSlovakSloveneSomaliSouth AfricanSouth AmericanSouth American IndianSoviet UnionSpaniardSpanishSpanish AmericanSpanish American IndianSri LankanSubsaharan AfricanSudaneseSwedishSwissSyrianTaiwaneseThaiTlingit-HaidaTohono O'OdhamTonganTrinidadian and TobagonianTsimshianTurkishU.S. Virgin IslanderUgandanUkrainianUruguayanUteVenezuelanVietnameseWelshWest IndianYakamaYaquiYugoslavianYumanYup'ikZimbabwean
Immigration
NonimmigrantsImmigrantsAfghanistanAfricaAlbaniaArgentinaArmeniaAsiaAustraliaAustriaBahamasBangladeshBarbadosBelarusBelgiumBelizeBoliviaBosnia and HerzegovinaBrazilBulgariaBurma/MyanmarCabo VerdeCambodiaCameroonCanadaCaribbeanCentral AmericaChileChinaColombiaCongoCosta RicaCroatiaCubaCzechoslovakiaDenmarkDominicaDominican RepublicEastern AfricaEastern AsiaEastern EuropeEcuadorEgyptEl SalvadorEnglandEritreaEthiopiaEuropeFijiFranceGermanyGhanaGreeceGrenadaGuatemalaGuyanaHaitiHondurasHong KongHungaryIndiaIndonesiaIranIraqIrelandIsraelItalyJamaicaJapanJordanKazakhstanKenyaKoreaKuwaitLaosLatin AmericaLatviaLebanonLiberiaLithuaniaMalaysiaMexicoMicronesiaMiddle AfricaMoldovaMoroccoNepalNetherlandsNicaraguaNigeriaNorth AmericaNorth MacedoniaNorthern AfricaNorthern EuropeNorwayOceaniaPakistanPanamaPeruPhilippinesPolandPortugalRomaniaRussiaSaudi ArabiaScotlandSenegalSerbiaSierra LeoneSingaporeSomaliaSouth AfricaSouth AmericaSouth Central AsiaSouth Eastern AsiaSouthern EuropeSpainSri LankaSt. Vincent and the GrenadinesSudanSwedenSwitzerlandSyriaTaiwanThailandTrinidad and TobagoTurkeyUgandaUkraineUruguayUzbekistanVenezuelaWest IndiesWestern AfricaWestern AsiaWestern EuropeYemenZaireZimbabweAzores
Immigrants from Vietnam
Race
Ancestry
AfghanAfricanAlaska NativeAlaskan AthabascanAlbanianAleutAlsatianAmericanApacheArabArapahoArgentineanArmenianAssyrian/Chaldean/SyriacAustralianAustrianBahamianBangladeshiBarbadianBasqueBelgianBelizeanBermudanBhutaneseBlackfeetBolivianBrazilianBritishBritish West IndianBulgarianBurmeseCajunCambodianCanadianCape VerdeanCarpatho RusynCelticCentral AmericanCentral American IndianCherokeeCheyenneChickasawChileanChineseChippewaChoctawColombianColvilleComancheCosta RicanCreeCreekCroatianCrowCubanCypriotCzechCzechoslovakianDanishDelawareDominicanDutchDutch West IndianEastern EuropeanEcuadorianEgyptianEnglishEstonianEthiopianEuropeanFijianFilipinoFinnishFrenchFrench American IndianFrench CanadianGermanGerman RussianGhanaianGreekGuamanian/ChamorroGuatemalanGuyaneseHaitianHmongHonduranHopiHoumaHungarianIcelanderIndian (Asian)IndonesianInupiatIranianIraqiIrishIroquoisIsraeliItalianJamaicanJapaneseJordanianKenyanKiowaKoreanLaotianLatvianLebaneseLiberianLithuanianLumbeeLuxembourgerMacedonianMalaysianMalteseMarshalleseMenomineeMexicanMexican American IndianMongolianMoroccanNative HawaiianNavajoNepaleseNew ZealanderNicaraguanNigerianNorthern EuropeanNorwegianOkinawanOsageOttawaPaiutePakistaniPalestinianPanamanianParaguayanPennsylvania GermanPeruvianPimaPolishPortuguesePotawatomiPuebloPuerto RicanPuget Sound SalishRomanianRussianSalvadoranSamoanScandinavianScotch-IrishScottishSeminoleSenegaleseSerbianShoshoneSierra LeoneanSiouxSlavicSlovakSloveneSomaliSouth AfricanSouth AmericanSouth American IndianSoviet UnionSpaniardSpanishSpanish AmericanSpanish American IndianSri LankanSubsaharan AfricanSudaneseSwedishSwissSyrianTaiwaneseThaiTlingit-HaidaTohono O'OdhamTonganTrinidadian and TobagonianTsimshianTurkishU.S. Virgin IslanderUgandanUkrainianUruguayanUteVenezuelanVietnameseWelshWest IndianYakamaYaquiYugoslavianYumanZimbabwean
Immigration
NonimmigrantsImmigrantsAfghanistanAfricaAlbaniaArgentinaArmeniaAsiaAustraliaAustriaBahamasBangladeshBarbadosBelarusBelgiumBelizeBoliviaBosnia and HerzegovinaBrazilBulgariaBurma/MyanmarCabo VerdeCambodiaCameroonCanadaCaribbeanCentral AmericaChileChinaColombiaCongoCosta RicaCroatiaCubaCzechoslovakiaDenmarkDominicaDominican RepublicEastern AfricaEastern AsiaEastern EuropeEcuadorEgyptEl SalvadorEnglandEritreaEthiopiaEuropeFijiFranceGermanyGhanaGreeceGrenadaGuatemalaGuyanaHaitiHondurasHong KongHungaryIndiaIndonesiaIranIraqIrelandIsraelItalyJamaicaJapanJordanKazakhstanKenyaKoreaKuwaitLaosLatin AmericaLatviaLebanonLiberiaLithuaniaMalaysiaMexicoMicronesiaMiddle AfricaMoldovaMoroccoNepalNetherlandsNicaraguaNigeriaNorth AmericaNorth MacedoniaNorthern AfricaNorthern EuropeNorwayOceaniaPakistanPanamaPeruPhilippinesPolandPortugalRomaniaRussiaSaudi ArabiaScotlandSenegalSerbiaSierra LeoneSingaporeSomaliaSouth AfricaSouth AmericaSouth Central AsiaSouth Eastern AsiaSouthern EuropeSpainSri LankaSt. Vincent and the GrenadinesSudanSwedenSwitzerlandSyriaTaiwanThailandTrinidad and TobagoTurkeyUgandaUkraineUruguayUzbekistanVenezuelaVietnamWest IndiesWestern AfricaWestern AsiaWestern EuropeYemenZaireZimbabweAzores
Female Disability
Income
Poverty
Unemployment
Labor Participation
Family Structure
Vehicle Availability
Education Level
Disability

Female Disability Comparison

Yup'ik

Immigrants from Vietnam

Exceptional
Exceptional
11.6%
FEMALE DISABILITY
99.5/ 100
METRIC RATING
88th/ 347
METRIC RANK
11.5%
FEMALE DISABILITY
99.8/ 100
METRIC RATING
67th/ 347
METRIC RANK

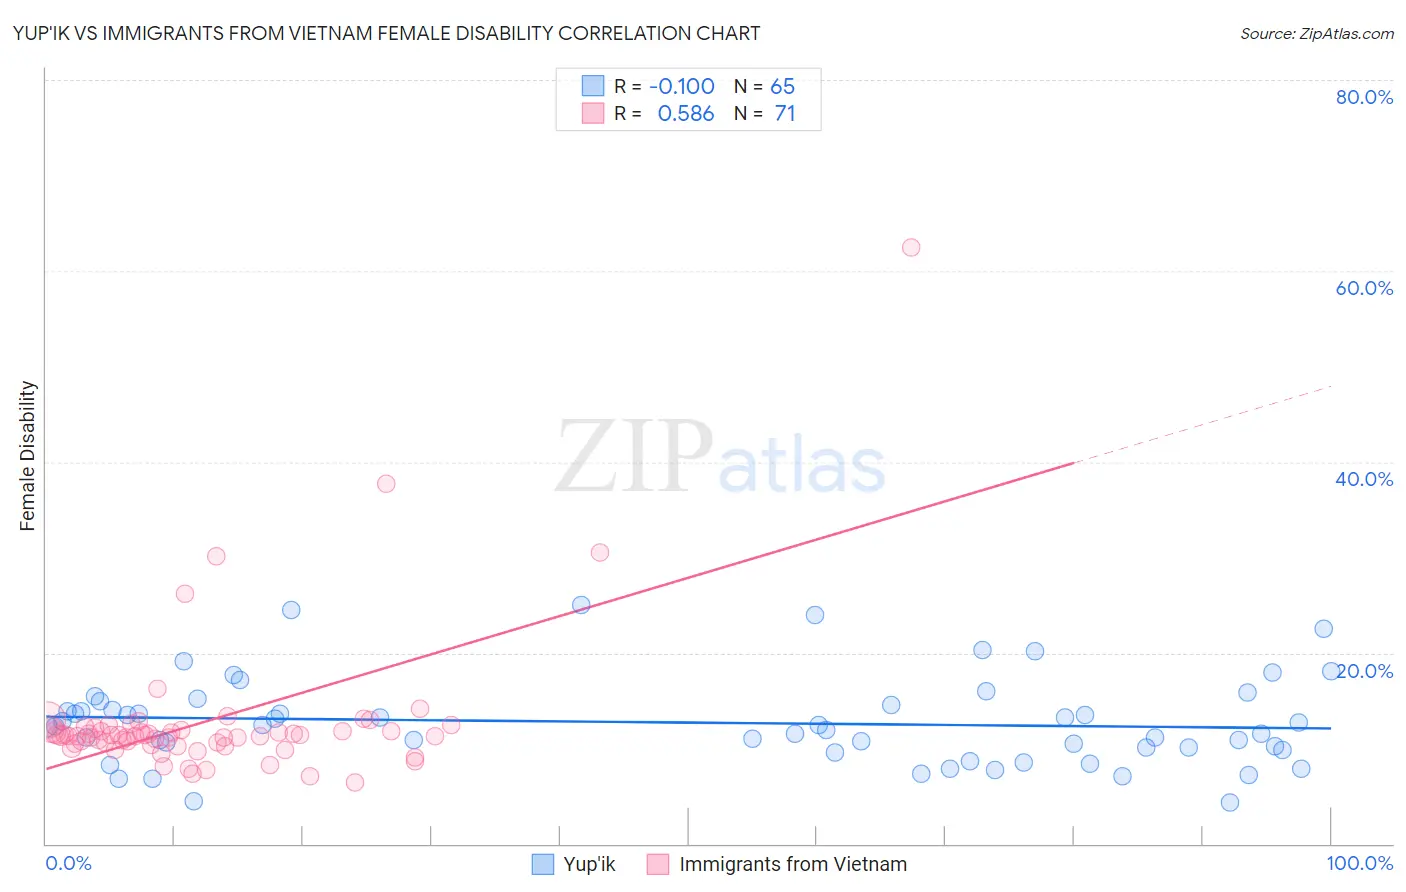
Yup'ik vs Immigrants from Vietnam Female Disability Correlation Chart

The statistical analysis conducted on geographies consisting of 39,957,133 people shows a slight negative correlation between the proportion of Yup'ik and percentage of females with a disability in the United States with a correlation coefficient (R) of -0.100 and weighted average of 11.6%. Similarly, the statistical analysis conducted on geographies consisting of 404,760,443 people shows a substantial positive correlation between the proportion of Immigrants from Vietnam and percentage of females with a disability in the United States with a correlation coefficient (R) of 0.586 and weighted average of 11.5%, a difference of 0.99%.
Yup'ik vs Immigrants from Vietnam Female Disability

Female Disability Correlation Summary

MeasurementYup'ikImmigrants from Vietnam
Minimum4.3%6.4%
Maximum25.0%62.5%
Range20.7%56.1%
Mean12.7%12.9%
Median12.3%11.3%
Interquartile 25% (IQ1)9.9%10.5%
Interquartile 75% (IQ3)14.7%12.0%
Interquartile Range (IQR)4.8%1.4%
Standard Deviation (Sample)4.6%7.8%
Standard Deviation (Population)4.5%7.8%

Similar Demographics by Female Disability

Demographics Similar to Yup'ik by Female Disability

In terms of female disability, the demographic groups most similar to Yup'ik are Immigrants from Denmark (11.6%, a difference of 0.0%), Palestinian (11.6%, a difference of 0.070%), Immigrants from Cameroon (11.6%, a difference of 0.070%), Immigrants from Poland (11.6%, a difference of 0.10%), and Vietnamese (11.6%, a difference of 0.10%).
DemographicsRating | RankFemale Disability
Eastern Europeans
99.7
/100
|
#81
Exceptional
11.5%
Luxembourgers
99.6
/100
|
#82
Exceptional
11.6%
Immigrants | Serbia
99.6
/100
|
#83
Exceptional
11.6%
Immigrants | Poland
99.6
/100
|
#84
Exceptional
11.6%
Palestinians
99.6
/100
|
#85
Exceptional
11.6%
Immigrants | Cameroon
99.6
/100
|
#86
Exceptional
11.6%
Immigrants | Denmark
99.5
/100
|
#87
Exceptional
11.6%
Yup'ik
99.5
/100
|
#88
Exceptional
11.6%
Vietnamese
99.5
/100
|
#89
Exceptional
11.6%
Immigrants | Romania
99.5
/100
|
#90
Exceptional
11.6%
Immigrants | Zimbabwe
99.5
/100
|
#91
Exceptional
11.6%
Immigrants | Czechoslovakia
99.5
/100
|
#92
Exceptional
11.6%
Immigrants | Sierra Leone
99.4
/100
|
#93
Exceptional
11.6%
Immigrants | Brazil
99.4
/100
|
#94
Exceptional
11.6%
Immigrants | Northern Europe
99.4
/100
|
#95
Exceptional
11.6%

Demographics Similar to Immigrants from Vietnam by Female Disability

In terms of female disability, the demographic groups most similar to Immigrants from Vietnam are Immigrants from Northern Africa (11.5%, a difference of 0.020%), Salvadoran (11.5%, a difference of 0.050%), Colombian (11.5%, a difference of 0.090%), Immigrants from Chile (11.5%, a difference of 0.10%), and Immigrants from Ireland (11.5%, a difference of 0.14%).
DemographicsRating | RankFemale Disability
Immigrants | Bulgaria
99.9
/100
|
#60
Exceptional
11.4%
Immigrants | France
99.9
/100
|
#61
Exceptional
11.4%
Sri Lankans
99.9
/100
|
#62
Exceptional
11.4%
Immigrants | Colombia
99.9
/100
|
#63
Exceptional
11.4%
Immigrants | El Salvador
99.9
/100
|
#64
Exceptional
11.4%
Immigrants | South America
99.9
/100
|
#65
Exceptional
11.4%
Salvadorans
99.8
/100
|
#66
Exceptional
11.5%
Immigrants | Vietnam
99.8
/100
|
#67
Exceptional
11.5%
Immigrants | Northern Africa
99.8
/100
|
#68
Exceptional
11.5%
Colombians
99.8
/100
|
#69
Exceptional
11.5%
Immigrants | Chile
99.8
/100
|
#70
Exceptional
11.5%
Immigrants | Ireland
99.8
/100
|
#71
Exceptional
11.5%
Chileans
99.8
/100
|
#72
Exceptional
11.5%
Immigrants | Switzerland
99.8
/100
|
#73
Exceptional
11.5%
Bhutanese
99.8
/100
|
#74
Exceptional
11.5%