Australian vs Immigrants from Kuwait 3rd Grade
COMPARE
Australian
Immigrants from Kuwait
3rd Grade
3rd Grade Comparison
Australians
Immigrants from Kuwait
98.3%
3RD GRADE
99.8/ 100
METRIC RATING
51st/ 347
METRIC RANK
97.9%
3RD GRADE
88.7/ 100
METRIC RATING
133rd/ 347
METRIC RANK
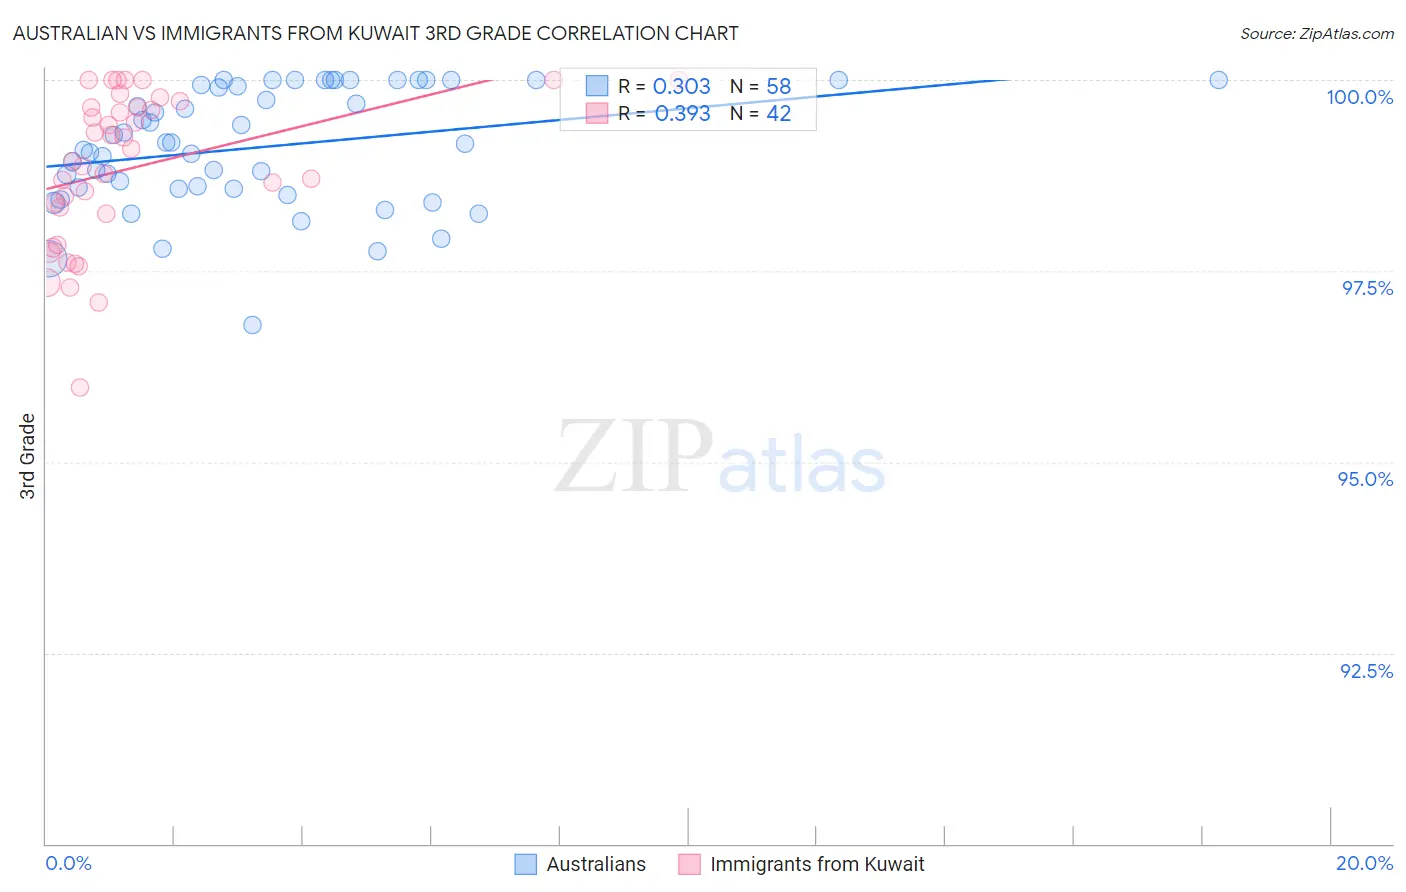
Australian vs Immigrants from Kuwait 3rd Grade Correlation Chart
The statistical analysis conducted on geographies consisting of 224,153,392 people shows a mild positive correlation between the proportion of Australians and percentage of population with at least 3rd grade education in the United States with a correlation coefficient (R) of 0.303 and weighted average of 98.3%. Similarly, the statistical analysis conducted on geographies consisting of 136,913,666 people shows a mild positive correlation between the proportion of Immigrants from Kuwait and percentage of population with at least 3rd grade education in the United States with a correlation coefficient (R) of 0.393 and weighted average of 97.9%, a difference of 0.35%.
3rd Grade Correlation Summary
| Measurement | Australian | Immigrants from Kuwait |
| Minimum | 96.8% | 96.0% |
| Maximum | 100.0% | 100.0% |
| Range | 3.2% | 4.0% |
| Mean | 99.1% | 98.8% |
| Median | 99.2% | 99.0% |
| Interquartile 25% (IQ1) | 98.6% | 98.2% |
| Interquartile 75% (IQ3) | 99.9% | 99.6% |
| Interquartile Range (IQR) | 1.4% | 1.4% |
| Standard Deviation (Sample) | 0.77% | 1.0% |
| Standard Deviation (Population) | 0.77% | 0.99% |
Similar Demographics by 3rd Grade
Demographics Similar to Australians by 3rd Grade
In terms of 3rd grade, the demographic groups most similar to Australians are Estonian (98.3%, a difference of 0.0%), Celtic (98.3%, a difference of 0.0%), White/Caucasian (98.3%, a difference of 0.0%), Immigrants from Scotland (98.3%, a difference of 0.010%), and Ottawa (98.3%, a difference of 0.020%).
| Demographics | Rating | Rank | 3rd Grade |
| Hungarians | 99.9 /100 | #44 | Exceptional 98.3% |
| Native Hawaiians | 99.9 /100 | #45 | Exceptional 98.3% |
| Ottawa | 99.8 /100 | #46 | Exceptional 98.3% |
| Czechoslovakians | 99.8 /100 | #47 | Exceptional 98.3% |
| Lumbee | 99.8 /100 | #48 | Exceptional 98.3% |
| Estonians | 99.8 /100 | #49 | Exceptional 98.3% |
| Celtics | 99.8 /100 | #50 | Exceptional 98.3% |
| Australians | 99.8 /100 | #51 | Exceptional 98.3% |
| Whites/Caucasians | 99.8 /100 | #52 | Exceptional 98.3% |
| Immigrants | Scotland | 99.8 /100 | #53 | Exceptional 98.3% |
| Bulgarians | 99.8 /100 | #54 | Exceptional 98.3% |
| Americans | 99.8 /100 | #55 | Exceptional 98.3% |
| Austrians | 99.8 /100 | #56 | Exceptional 98.3% |
| Slavs | 99.7 /100 | #57 | Exceptional 98.3% |
| Greeks | 99.7 /100 | #58 | Exceptional 98.3% |
Demographics Similar to Immigrants from Kuwait by 3rd Grade
In terms of 3rd grade, the demographic groups most similar to Immigrants from Kuwait are Immigrants from Bulgaria (97.9%, a difference of 0.0%), Immigrants from Hungary (97.9%, a difference of 0.0%), Seminole (97.9%, a difference of 0.0%), Cambodian (97.9%, a difference of 0.0%), and Spaniard (97.9%, a difference of 0.010%).
| Demographics | Rating | Rank | 3rd Grade |
| Immigrants | Zimbabwe | 93.4 /100 | #126 | Exceptional 98.0% |
| Ute | 93.2 /100 | #127 | Exceptional 98.0% |
| Colville | 92.1 /100 | #128 | Exceptional 98.0% |
| Immigrants | Serbia | 91.9 /100 | #129 | Exceptional 98.0% |
| Immigrants | Europe | 91.2 /100 | #130 | Exceptional 98.0% |
| Immigrants | Bulgaria | 89.1 /100 | #131 | Excellent 97.9% |
| Immigrants | Hungary | 88.8 /100 | #132 | Excellent 97.9% |
| Immigrants | Kuwait | 88.7 /100 | #133 | Excellent 97.9% |
| Seminole | 88.7 /100 | #134 | Excellent 97.9% |
| Cambodians | 88.1 /100 | #135 | Excellent 97.9% |
| Spaniards | 87.9 /100 | #136 | Excellent 97.9% |
| Immigrants | Romania | 87.9 /100 | #137 | Excellent 97.9% |
| Israelis | 86.6 /100 | #138 | Excellent 97.9% |
| Blackfeet | 86.3 /100 | #139 | Excellent 97.9% |
| Palestinians | 84.6 /100 | #140 | Excellent 97.9% |