Syrian vs Russian Disability Age 18 to 34
COMPARE
Syrian
Russian
Disability Age 18 to 34
Disability Age 18 to 34 Comparison
Syrians
Russians
6.6%
DISABILITY AGE 18 TO 34
44.3/ 100
METRIC RATING
177th/ 347
METRIC RANK
6.5%
DISABILITY AGE 18 TO 34
60.2/ 100
METRIC RATING
169th/ 347
METRIC RANK
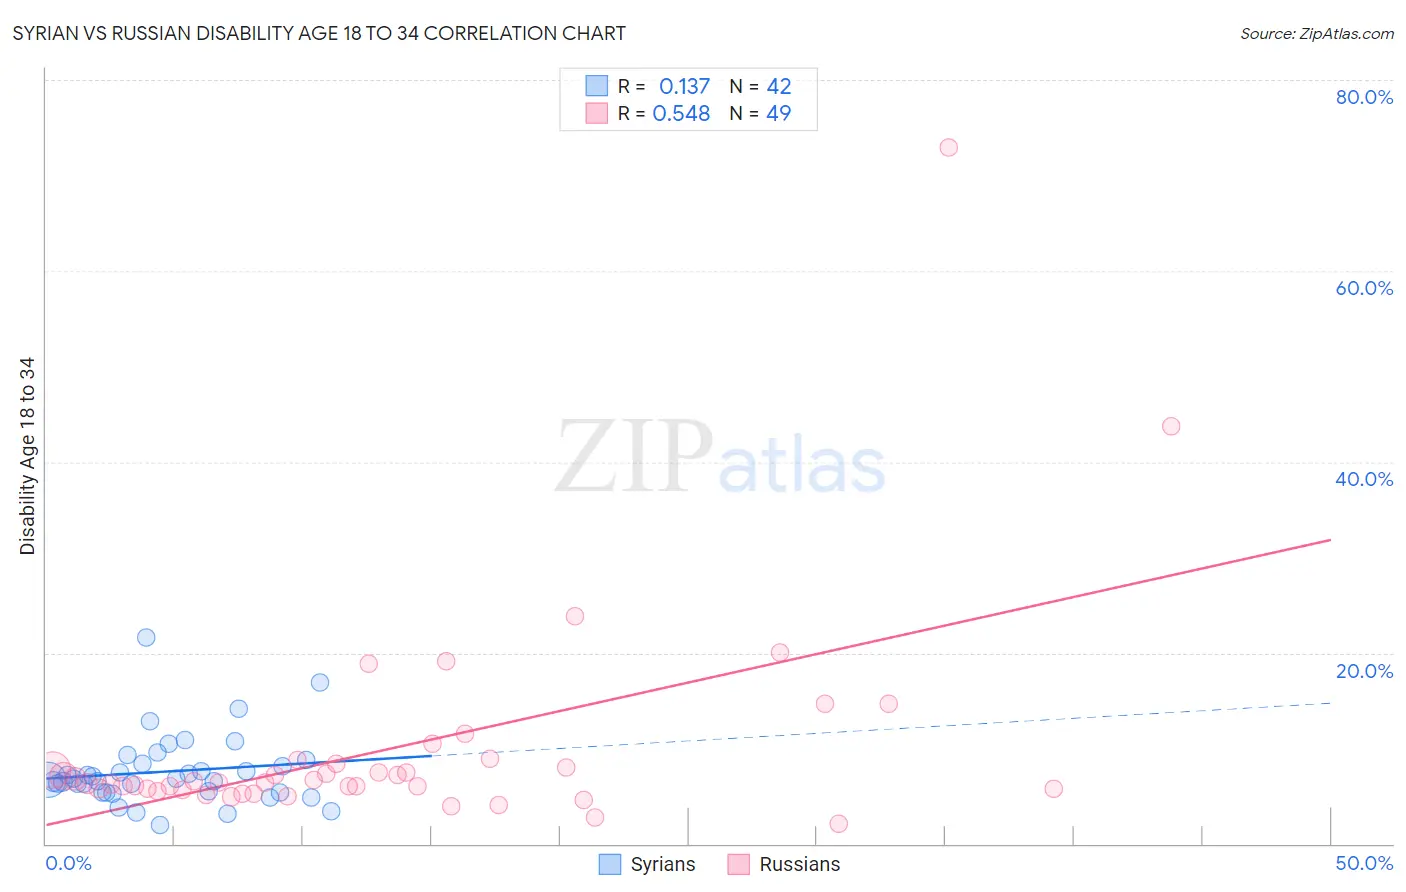
Syrian vs Russian Disability Age 18 to 34 Correlation Chart
The statistical analysis conducted on geographies consisting of 266,046,817 people shows a poor positive correlation between the proportion of Syrians and percentage of population with a disability between the ages 18 and 35 in the United States with a correlation coefficient (R) of 0.137 and weighted average of 6.6%. Similarly, the statistical analysis conducted on geographies consisting of 509,184,365 people shows a substantial positive correlation between the proportion of Russians and percentage of population with a disability between the ages 18 and 35 in the United States with a correlation coefficient (R) of 0.548 and weighted average of 6.5%, a difference of 1.1%.
Disability Age 18 to 34 Correlation Summary
| Measurement | Syrian | Russian |
| Minimum | 1.9% | 2.1% |
| Maximum | 21.7% | 72.9% |
| Range | 19.7% | 70.8% |
| Mean | 7.6% | 10.0% |
| Median | 6.7% | 6.4% |
| Interquartile 25% (IQ1) | 5.4% | 5.7% |
| Interquartile 75% (IQ3) | 8.4% | 8.6% |
| Interquartile Range (IQR) | 3.0% | 2.9% |
| Standard Deviation (Sample) | 3.7% | 11.4% |
| Standard Deviation (Population) | 3.6% | 11.3% |
Demographics Similar to Syrians and Russians by Disability Age 18 to 34
In terms of disability age 18 to 34, the demographic groups most similar to Syrians are Nigerian (6.6%, a difference of 0.040%), Immigrants from Africa (6.6%, a difference of 0.11%), Immigrants from Cambodia (6.6%, a difference of 0.15%), Immigrants from Ghana (6.6%, a difference of 0.15%), and Immigrants from Austria (6.6%, a difference of 0.34%). Similarly, the demographic groups most similar to Russians are Immigrants from Bahamas (6.6%, a difference of 0.17%), Immigrants from Moldova (6.5%, a difference of 0.21%), Immigrants from Northern Europe (6.5%, a difference of 0.29%), Bahamian (6.6%, a difference of 0.34%), and Eastern European (6.5%, a difference of 0.37%).
| Demographics | Rating | Rank | Disability Age 18 to 34 |
| Immigrants | Denmark | 71.7 /100 | #163 | Good 6.5% |
| Immigrants | Nigeria | 70.4 /100 | #164 | Good 6.5% |
| Immigrants | Hungary | 69.6 /100 | #165 | Good 6.5% |
| Eastern Europeans | 65.1 /100 | #166 | Good 6.5% |
| Immigrants | Northern Europe | 64.1 /100 | #167 | Good 6.5% |
| Immigrants | Moldova | 63.1 /100 | #168 | Good 6.5% |
| Russians | 60.2 /100 | #169 | Good 6.5% |
| Immigrants | Bahamas | 57.9 /100 | #170 | Average 6.6% |
| Bahamians | 55.5 /100 | #171 | Average 6.6% |
| Ghanaians | 54.7 /100 | #172 | Average 6.6% |
| Immigrants | Mexico | 54.1 /100 | #173 | Average 6.6% |
| Native Hawaiians | 50.0 /100 | #174 | Average 6.6% |
| Immigrants | Cambodia | 46.5 /100 | #175 | Average 6.6% |
| Immigrants | Africa | 45.9 /100 | #176 | Average 6.6% |
| Syrians | 44.3 /100 | #177 | Average 6.6% |
| Nigerians | 43.7 /100 | #178 | Average 6.6% |
| Immigrants | Ghana | 42.1 /100 | #179 | Average 6.6% |
| Immigrants | Austria | 39.6 /100 | #180 | Fair 6.6% |
| Romanians | 39.5 /100 | #181 | Fair 6.6% |
| U.S. Virgin Islanders | 38.6 /100 | #182 | Fair 6.7% |
| Immigrants | Iraq | 37.4 /100 | #183 | Fair 6.7% |