Assyrian/Chaldean/Syriac vs Panamanian Unemployment Among Women with Children Ages 6 to 17 years

COMPARE

Assyrian/Chaldean/Syriac
Race
Ancestry
AfghanAfricanAlaska NativeAlaskan AthabascanAlbanianAleutAlsatianAmericanApacheArabArapahoArgentineanArmenianAssyrian/Chaldean/SyriacAustralianAustrianBahamianBangladeshiBarbadianBasqueBelgianBelizeanBermudanBhutaneseBlackfeetBolivianBrazilianBritishBritish West IndianBulgarianBurmeseCajunCambodianCanadianCape VerdeanCarpatho RusynCelticCentral AmericanCentral American IndianCherokeeCheyenneChickasawChileanChineseChippewaChoctawColombianColvilleComancheCosta RicanCreeCreekCroatianCrowCubanCypriotCzechCzechoslovakianDanishDelawareDominicanDutchDutch West IndianEastern EuropeanEcuadorianEgyptianEnglishEstonianEthiopianEuropeanFijianFilipinoFinnishFrenchFrench American IndianFrench CanadianGermanGerman RussianGhanaianGreekGuamanian/ChamorroGuatemalanGuyaneseHaitianHmongHonduranHopiHoumaHungarianIcelanderIndian (Asian)IndonesianInupiatIranianIraqiIrishIroquoisIsraeliItalianJamaicanJapaneseJordanianKenyanKiowaKoreanLaotianLatvianLebaneseLiberianLithuanianLumbeeLuxembourgerMacedonianMalaysianMalteseMarshalleseMenomineeMexicanMexican American IndianMongolianMoroccanNative HawaiianNavajoNepaleseNew ZealanderNicaraguanNigerianNorthern EuropeanNorwegianOkinawanOsageOttawaPaiutePakistaniPalestinianParaguayanPennsylvania GermanPeruvianPimaPolishPortuguesePotawatomiPuebloPuerto RicanPuget Sound SalishRomanianRussianSalvadoranSamoanScandinavianScotch-IrishScottishSeminoleSenegaleseSerbianShoshoneSierra LeoneanSiouxSlavicSlovakSloveneSomaliSouth AfricanSouth AmericanSouth American IndianSoviet UnionSpaniardSpanishSpanish AmericanSpanish American IndianSri LankanSubsaharan AfricanSudaneseSwedishSwissSyrianTaiwaneseThaiTlingit-HaidaTohono O'OdhamTonganTrinidadian and TobagonianTsimshianTurkishU.S. Virgin IslanderUgandanUkrainianUruguayanUteVenezuelanVietnameseWelshWest IndianYakamaYaquiYugoslavianYumanYup'ikZimbabwean
Immigration
NonimmigrantsImmigrantsAfghanistanAfricaAlbaniaArgentinaArmeniaAsiaAustraliaAustriaBahamasBangladeshBarbadosBelarusBelgiumBelizeBoliviaBosnia and HerzegovinaBrazilBulgariaBurma/MyanmarCabo VerdeCambodiaCameroonCanadaCaribbeanCentral AmericaChileChinaColombiaCongoCosta RicaCroatiaCubaCzechoslovakiaDenmarkDominicaDominican RepublicEastern AfricaEastern AsiaEastern EuropeEcuadorEgyptEl SalvadorEnglandEritreaEthiopiaEuropeFijiFranceGermanyGhanaGreeceGrenadaGuatemalaGuyanaHaitiHondurasHong KongHungaryIndiaIndonesiaIranIraqIrelandIsraelItalyJamaicaJapanJordanKazakhstanKenyaKoreaKuwaitLaosLatin AmericaLatviaLebanonLiberiaLithuaniaMalaysiaMexicoMicronesiaMiddle AfricaMoldovaMoroccoNepalNetherlandsNicaraguaNigeriaNorth AmericaNorth MacedoniaNorthern AfricaNorthern EuropeNorwayOceaniaPakistanPanamaPeruPhilippinesPolandPortugalRomaniaRussiaSaudi ArabiaScotlandSenegalSerbiaSierra LeoneSingaporeSomaliaSouth AfricaSouth AmericaSouth Central AsiaSouth Eastern AsiaSouthern EuropeSpainSri LankaSt. Vincent and the GrenadinesSudanSwedenSwitzerlandSyriaTaiwanThailandTrinidad and TobagoTurkeyUgandaUkraineUruguayUzbekistanVenezuelaVietnamWest IndiesWestern AfricaWestern AsiaWestern EuropeYemenZaireZimbabweAzores
Panamanian
Race
Ancestry
AfghanAfricanAlaska NativeAlaskan AthabascanAlbanianAleutAlsatianAmericanApacheArabArapahoArgentineanArmenianAustralianAustrianBahamianBangladeshiBarbadianBasqueBelgianBelizeanBermudanBhutaneseBlackfeetBolivianBrazilianBritishBritish West IndianBulgarianBurmeseCajunCambodianCanadianCape VerdeanCarpatho RusynCelticCentral AmericanCentral American IndianCherokeeCheyenneChickasawChileanChineseChippewaChoctawColombianColvilleComancheCosta RicanCreeCreekCroatianCrowCubanCypriotCzechCzechoslovakianDanishDelawareDominicanDutchDutch West IndianEastern EuropeanEcuadorianEgyptianEnglishEstonianEthiopianEuropeanFijianFilipinoFinnishFrenchFrench American IndianFrench CanadianGermanGerman RussianGhanaianGreekGuamanian/ChamorroGuatemalanGuyaneseHaitianHmongHonduranHopiHoumaHungarianIcelanderIndian (Asian)IndonesianInupiatIranianIraqiIrishIroquoisIsraeliItalianJamaicanJapaneseJordanianKenyanKiowaKoreanLaotianLatvianLebaneseLiberianLithuanianLumbeeLuxembourgerMacedonianMalaysianMalteseMarshalleseMenomineeMexicanMexican American IndianMongolianMoroccanNative HawaiianNavajoNepaleseNew ZealanderNicaraguanNigerianNorthern EuropeanNorwegianOkinawanOsageOttawaPaiutePakistaniPalestinianPanamanianParaguayanPennsylvania GermanPeruvianPimaPolishPortuguesePotawatomiPuebloPuerto RicanPuget Sound SalishRomanianRussianSalvadoranSamoanScandinavianScotch-IrishScottishSeminoleSenegaleseSerbianShoshoneSierra LeoneanSiouxSlavicSlovakSloveneSomaliSouth AfricanSouth AmericanSouth American IndianSoviet UnionSpaniardSpanishSpanish AmericanSpanish American IndianSri LankanSubsaharan AfricanSudaneseSwedishSwissSyrianTaiwaneseThaiTlingit-HaidaTohono O'OdhamTonganTrinidadian and TobagonianTsimshianTurkishU.S. Virgin IslanderUgandanUkrainianUruguayanUteVenezuelanVietnameseWelshWest IndianYakamaYaquiYugoslavianYumanYup'ikZimbabwean
Immigration
NonimmigrantsImmigrantsAfghanistanAfricaAlbaniaArgentinaArmeniaAsiaAustraliaAustriaBahamasBangladeshBarbadosBelarusBelgiumBelizeBoliviaBosnia and HerzegovinaBrazilBulgariaBurma/MyanmarCabo VerdeCambodiaCameroonCanadaCaribbeanCentral AmericaChileChinaColombiaCongoCosta RicaCroatiaCubaCzechoslovakiaDenmarkDominicaDominican RepublicEastern AfricaEastern AsiaEastern EuropeEcuadorEgyptEl SalvadorEnglandEritreaEthiopiaEuropeFijiFranceGermanyGhanaGreeceGrenadaGuatemalaGuyanaHaitiHondurasHong KongHungaryIndiaIndonesiaIranIraqIrelandIsraelItalyJamaicaJapanJordanKazakhstanKenyaKoreaKuwaitLaosLatin AmericaLatviaLebanonLiberiaLithuaniaMalaysiaMexicoMicronesiaMiddle AfricaMoldovaMoroccoNepalNetherlandsNicaraguaNigeriaNorth AmericaNorth MacedoniaNorthern AfricaNorthern EuropeNorwayOceaniaPakistanPanamaPeruPhilippinesPolandPortugalRomaniaRussiaSaudi ArabiaScotlandSenegalSerbiaSierra LeoneSingaporeSomaliaSouth AfricaSouth AmericaSouth Central AsiaSouth Eastern AsiaSouthern EuropeSpainSri LankaSt. Vincent and the GrenadinesSudanSwedenSwitzerlandSyriaTaiwanThailandTrinidad and TobagoTurkeyUgandaUkraineUruguayUzbekistanVenezuelaVietnamWest IndiesWestern AfricaWestern AsiaWestern EuropeYemenZaireZimbabweAzores
Unemployment Among Women with Children Ages 6 to 17 years
Income
Poverty
Unemployment
Labor Participation
Family Structure
Vehicle Availability
Education Level
Disability

Unemployment Among Women with Children Ages 6 to 17 years Comparison

Assyrians/Chaldeans/Syriacs

Panamanians

Exceptional
Tragic
7.2%
UNEMPLOYMENT AMONG WOMEN WITH CHILDREN AGES 6 TO 17 YEARS
100.0/ 100
METRIC RATING
9th/ 347
METRIC RANK
9.3%
UNEMPLOYMENT AMONG WOMEN WITH CHILDREN AGES 6 TO 17 YEARS
4.5/ 100
METRIC RATING
227th/ 347
METRIC RANK

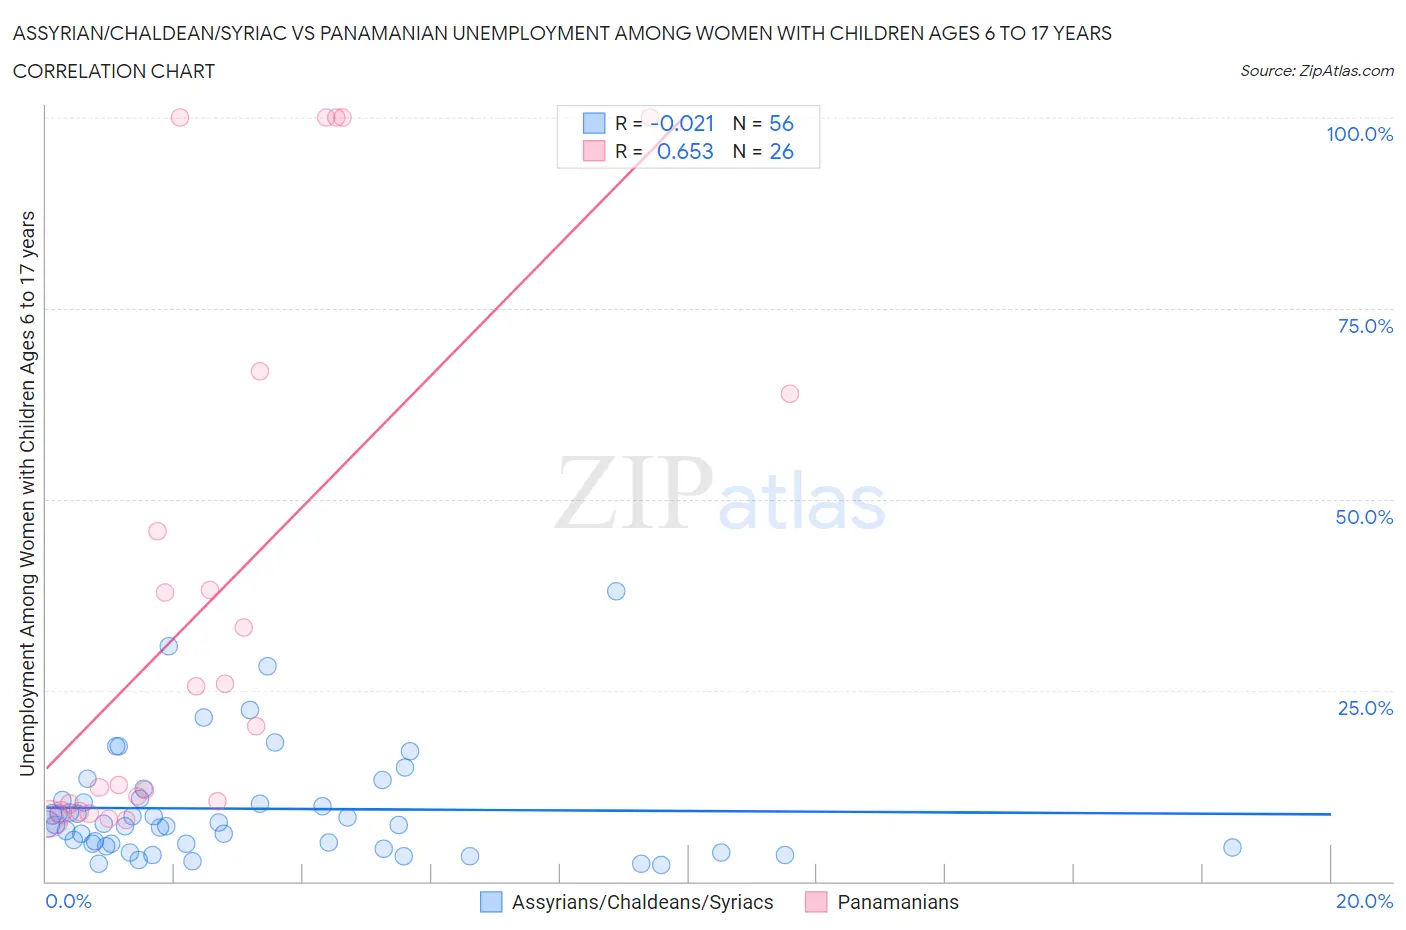
Assyrian/Chaldean/Syriac vs Panamanian Unemployment Among Women with Children Ages 6 to 17 years Correlation Chart

The statistical analysis conducted on geographies consisting of 94,071,494 people shows no correlation between the proportion of Assyrians/Chaldeans/Syriacs and unemployment rate among women with children between the ages 6 and 17 in the United States with a correlation coefficient (R) of -0.021 and weighted average of 7.2%. Similarly, the statistical analysis conducted on geographies consisting of 220,592,819 people shows a significant positive correlation between the proportion of Panamanians and unemployment rate among women with children between the ages 6 and 17 in the United States with a correlation coefficient (R) of 0.653 and weighted average of 9.3%, a difference of 28.6%.
Assyrian/Chaldean/Syriac vs Panamanian Unemployment Among Women with Children Ages 6 to 17 years

Unemployment Among Women with Children Ages 6 to 17 years Correlation Summary

MeasurementAssyrian/Chaldean/SyriacPanamanian
Minimum2.2%8.0%
Maximum37.9%100.0%
Range35.7%92.0%
Mean9.5%37.6%
Median7.4%22.9%
Interquartile 25% (IQ1)4.7%10.1%
Interquartile 75% (IQ3)10.7%63.9%
Interquartile Range (IQR)5.9%53.8%
Standard Deviation (Sample)7.4%35.1%
Standard Deviation (Population)7.3%34.4%

Similar Demographics by Unemployment Among Women with Children Ages 6 to 17 years

Demographics Similar to Assyrians/Chaldeans/Syriacs by Unemployment Among Women with Children Ages 6 to 17 years

In terms of unemployment among women with children ages 6 to 17 years, the demographic groups most similar to Assyrians/Chaldeans/Syriacs are Immigrants from Hong Kong (7.2%, a difference of 0.31%), Immigrants from Fiji (7.3%, a difference of 0.97%), Immigrants from Taiwan (7.3%, a difference of 1.7%), Soviet Union (7.1%, a difference of 1.7%), and Tlingit-Haida (7.1%, a difference of 1.8%).
DemographicsRating | RankUnemployment Among Women with Children Ages 6 to 17 years
Fijians
100.0
/100
|
#2
Exceptional
6.6%
Tongans
100.0
/100
|
#3
Exceptional
6.7%
Ute
100.0
/100
|
#4
Exceptional
7.0%
Okinawans
100.0
/100
|
#5
Exceptional
7.0%
Tlingit-Haida
100.0
/100
|
#6
Exceptional
7.1%
Soviet Union
100.0
/100
|
#7
Exceptional
7.1%
Immigrants | Hong Kong
100.0
/100
|
#8
Exceptional
7.2%
Assyrians/Chaldeans/Syriacs
100.0
/100
|
#9
Exceptional
7.2%
Immigrants | Fiji
100.0
/100
|
#10
Exceptional
7.3%
Immigrants | Taiwan
100.0
/100
|
#11
Exceptional
7.3%
Bangladeshis
100.0
/100
|
#12
Exceptional
7.4%
Indonesians
100.0
/100
|
#13
Exceptional
7.4%
Sudanese
100.0
/100
|
#14
Exceptional
7.4%
Puget Sound Salish
100.0
/100
|
#15
Exceptional
7.5%
Immigrants | Burma/Myanmar
100.0
/100
|
#16
Exceptional
7.5%

Demographics Similar to Panamanians by Unemployment Among Women with Children Ages 6 to 17 years

In terms of unemployment among women with children ages 6 to 17 years, the demographic groups most similar to Panamanians are Immigrants from the Azores (9.3%, a difference of 0.020%), Estonian (9.3%, a difference of 0.020%), Lumbee (9.3%, a difference of 0.060%), Welsh (9.3%, a difference of 0.15%), and Chinese (9.3%, a difference of 0.16%).
DemographicsRating | RankUnemployment Among Women with Children Ages 6 to 17 years
Belgians
6.4
/100
|
#220
Tragic
9.2%
Crow
5.8
/100
|
#221
Tragic
9.2%
Immigrants | Southern Europe
5.8
/100
|
#222
Tragic
9.2%
Immigrants | Eritrea
5.8
/100
|
#223
Tragic
9.2%
Immigrants | El Salvador
5.3
/100
|
#224
Tragic
9.3%
Chinese
5.2
/100
|
#225
Tragic
9.3%
Immigrants | Azores
4.6
/100
|
#226
Tragic
9.3%
Panamanians
4.5
/100
|
#227
Tragic
9.3%
Estonians
4.4
/100
|
#228
Tragic
9.3%
Lumbee
4.3
/100
|
#229
Tragic
9.3%
Welsh
4.0
/100
|
#230
Tragic
9.3%
Macedonians
3.9
/100
|
#231
Tragic
9.3%
French American Indians
3.7
/100
|
#232
Tragic
9.3%
Immigrants | St. Vincent and the Grenadines
3.3
/100
|
#233
Tragic
9.3%
Mexicans
3.2
/100
|
#234
Tragic
9.3%