Immigrants from Iraq vs South American Indian Disability Age Over 75
COMPARE
Immigrants from Iraq
South American Indian
Disability Age Over 75
Disability Age Over 75 Comparison
Immigrants from Iraq
South American Indians
49.1%
DISABILITY AGE OVER 75
0.1/ 100
METRIC RATING
273rd/ 347
METRIC RANK
47.1%
DISABILITY AGE OVER 75
68.1/ 100
METRIC RATING
161st/ 347
METRIC RANK
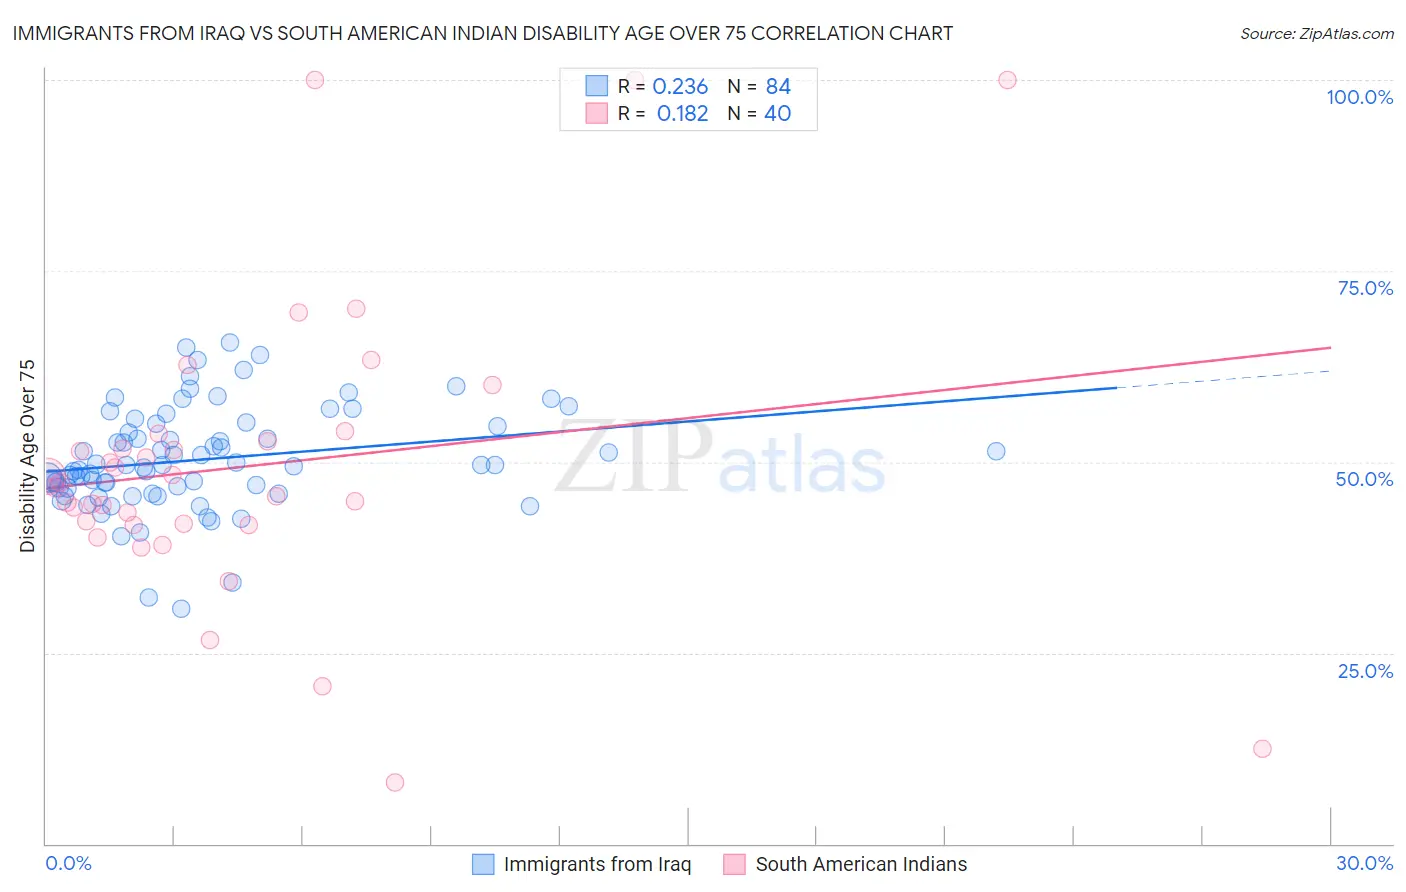
Immigrants from Iraq vs South American Indian Disability Age Over 75 Correlation Chart
The statistical analysis conducted on geographies consisting of 194,692,045 people shows a weak positive correlation between the proportion of Immigrants from Iraq and percentage of population with a disability over the age of 75 in the United States with a correlation coefficient (R) of 0.236 and weighted average of 49.1%. Similarly, the statistical analysis conducted on geographies consisting of 164,514,334 people shows a poor positive correlation between the proportion of South American Indians and percentage of population with a disability over the age of 75 in the United States with a correlation coefficient (R) of 0.182 and weighted average of 47.1%, a difference of 4.1%.
Disability Age Over 75 Correlation Summary
| Measurement | Immigrants from Iraq | South American Indian |
| Minimum | 30.8% | 8.0% |
| Maximum | 65.6% | 100.0% |
| Range | 34.8% | 92.0% |
| Mean | 50.3% | 49.5% |
| Median | 49.5% | 47.0% |
| Interquartile 25% (IQ1) | 46.6% | 41.8% |
| Interquartile 75% (IQ3) | 54.9% | 53.2% |
| Interquartile Range (IQR) | 8.3% | 11.4% |
| Standard Deviation (Sample) | 6.8% | 19.2% |
| Standard Deviation (Population) | 6.7% | 19.0% |
Similar Demographics by Disability Age Over 75
Demographics Similar to Immigrants from Iraq by Disability Age Over 75
In terms of disability age over 75, the demographic groups most similar to Immigrants from Iraq are Assyrian/Chaldean/Syriac (49.1%, a difference of 0.050%), Fijian (49.0%, a difference of 0.060%), Immigrants from Guatemala (49.1%, a difference of 0.070%), Immigrants from Dominica (49.1%, a difference of 0.080%), and Potawatomi (49.0%, a difference of 0.090%).
| Demographics | Rating | Rank | Disability Age Over 75 |
| U.S. Virgin Islanders | 0.2 /100 | #266 | Tragic 48.9% |
| Malaysians | 0.2 /100 | #267 | Tragic 49.0% |
| Guatemalans | 0.2 /100 | #268 | Tragic 49.0% |
| Immigrants | El Salvador | 0.2 /100 | #269 | Tragic 49.0% |
| Potawatomi | 0.2 /100 | #270 | Tragic 49.0% |
| Fijians | 0.2 /100 | #271 | Tragic 49.0% |
| Assyrians/Chaldeans/Syriacs | 0.2 /100 | #272 | Tragic 49.1% |
| Immigrants | Iraq | 0.1 /100 | #273 | Tragic 49.1% |
| Immigrants | Guatemala | 0.1 /100 | #274 | Tragic 49.1% |
| Immigrants | Dominica | 0.1 /100 | #275 | Tragic 49.1% |
| Immigrants | Uzbekistan | 0.1 /100 | #276 | Tragic 49.2% |
| Hawaiians | 0.1 /100 | #277 | Tragic 49.2% |
| Immigrants | Laos | 0.1 /100 | #278 | Tragic 49.2% |
| Guamanians/Chamorros | 0.0 /100 | #279 | Tragic 49.4% |
| Bangladeshis | 0.0 /100 | #280 | Tragic 49.4% |
Demographics Similar to South American Indians by Disability Age Over 75
In terms of disability age over 75, the demographic groups most similar to South American Indians are Immigrants from Middle Africa (47.1%, a difference of 0.010%), Pennsylvania German (47.2%, a difference of 0.050%), Immigrants from Eastern Africa (47.2%, a difference of 0.070%), Immigrants from Morocco (47.1%, a difference of 0.090%), and French (47.2%, a difference of 0.090%).
| Demographics | Rating | Rank | Disability Age Over 75 |
| Immigrants | Belarus | 74.8 /100 | #154 | Good 47.1% |
| Immigrants | Iran | 74.7 /100 | #155 | Good 47.1% |
| Arabs | 73.3 /100 | #156 | Good 47.1% |
| Bhutanese | 72.6 /100 | #157 | Good 47.1% |
| Immigrants | Guyana | 71.9 /100 | #158 | Good 47.1% |
| Immigrants | Morocco | 71.4 /100 | #159 | Good 47.1% |
| Immigrants | Middle Africa | 68.3 /100 | #160 | Good 47.1% |
| South American Indians | 68.1 /100 | #161 | Good 47.1% |
| Pennsylvania Germans | 66.0 /100 | #162 | Good 47.2% |
| Immigrants | Eastern Africa | 65.5 /100 | #163 | Good 47.2% |
| French | 64.6 /100 | #164 | Good 47.2% |
| Immigrants | Zimbabwe | 64.4 /100 | #165 | Good 47.2% |
| Immigrants | Sierra Leone | 64.4 /100 | #166 | Good 47.2% |
| Moroccans | 62.9 /100 | #167 | Good 47.2% |
| Kenyans | 58.8 /100 | #168 | Average 47.2% |