Immigrants from Albania vs South American Indian Disability Age Over 75
COMPARE
Immigrants from Albania
South American Indian
Disability Age Over 75
Disability Age Over 75 Comparison
Immigrants from Albania
South American Indians
46.6%
DISABILITY AGE OVER 75
93.2/ 100
METRIC RATING
122nd/ 347
METRIC RANK
47.1%
DISABILITY AGE OVER 75
68.1/ 100
METRIC RATING
161st/ 347
METRIC RANK
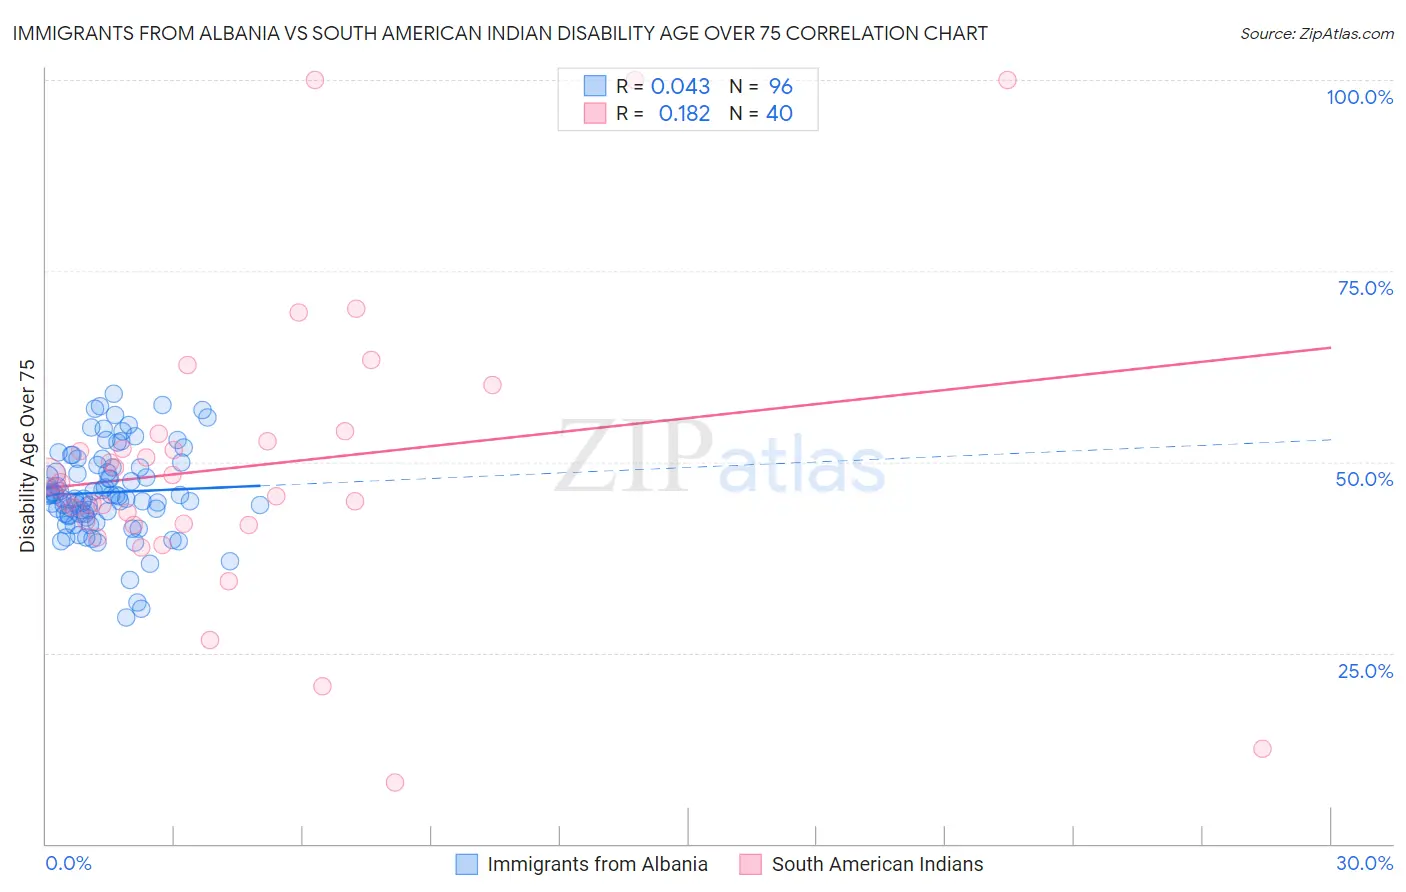
Immigrants from Albania vs South American Indian Disability Age Over 75 Correlation Chart
The statistical analysis conducted on geographies consisting of 119,350,943 people shows no correlation between the proportion of Immigrants from Albania and percentage of population with a disability over the age of 75 in the United States with a correlation coefficient (R) of 0.043 and weighted average of 46.6%. Similarly, the statistical analysis conducted on geographies consisting of 164,514,334 people shows a poor positive correlation between the proportion of South American Indians and percentage of population with a disability over the age of 75 in the United States with a correlation coefficient (R) of 0.182 and weighted average of 47.1%, a difference of 1.1%.
Disability Age Over 75 Correlation Summary
| Measurement | Immigrants from Albania | South American Indian |
| Minimum | 29.7% | 8.0% |
| Maximum | 58.9% | 100.0% |
| Range | 29.2% | 92.0% |
| Mean | 46.0% | 49.5% |
| Median | 45.6% | 47.0% |
| Interquartile 25% (IQ1) | 43.1% | 41.8% |
| Interquartile 75% (IQ3) | 49.5% | 53.2% |
| Interquartile Range (IQR) | 6.3% | 11.4% |
| Standard Deviation (Sample) | 5.8% | 19.2% |
| Standard Deviation (Population) | 5.8% | 19.0% |
Similar Demographics by Disability Age Over 75
Demographics Similar to Immigrants from Albania by Disability Age Over 75
In terms of disability age over 75, the demographic groups most similar to Immigrants from Albania are Scandinavian (46.6%, a difference of 0.050%), Immigrants from Colombia (46.7%, a difference of 0.050%), Immigrants from Nepal (46.6%, a difference of 0.090%), Immigrants from South America (46.7%, a difference of 0.11%), and Canadian (46.6%, a difference of 0.12%).
| Demographics | Rating | Rank | Disability Age Over 75 |
| British | 95.7 /100 | #115 | Exceptional 46.5% |
| Indians (Asian) | 95.7 /100 | #116 | Exceptional 46.5% |
| Hungarians | 95.3 /100 | #117 | Exceptional 46.5% |
| Czechoslovakians | 94.7 /100 | #118 | Exceptional 46.6% |
| Canadians | 94.4 /100 | #119 | Exceptional 46.6% |
| Immigrants | Nepal | 94.1 /100 | #120 | Exceptional 46.6% |
| Scandinavians | 93.6 /100 | #121 | Exceptional 46.6% |
| Immigrants | Albania | 93.2 /100 | #122 | Exceptional 46.6% |
| Immigrants | Colombia | 92.6 /100 | #123 | Exceptional 46.7% |
| Immigrants | South America | 91.8 /100 | #124 | Exceptional 46.7% |
| Colombians | 91.3 /100 | #125 | Exceptional 46.7% |
| Europeans | 91.2 /100 | #126 | Exceptional 46.7% |
| Syrians | 91.1 /100 | #127 | Exceptional 46.7% |
| Icelanders | 90.9 /100 | #128 | Exceptional 46.7% |
| Immigrants | Germany | 90.8 /100 | #129 | Exceptional 46.7% |
Demographics Similar to South American Indians by Disability Age Over 75
In terms of disability age over 75, the demographic groups most similar to South American Indians are Immigrants from Middle Africa (47.1%, a difference of 0.010%), Pennsylvania German (47.2%, a difference of 0.050%), Immigrants from Eastern Africa (47.2%, a difference of 0.070%), Immigrants from Morocco (47.1%, a difference of 0.090%), and French (47.2%, a difference of 0.090%).
| Demographics | Rating | Rank | Disability Age Over 75 |
| Immigrants | Belarus | 74.8 /100 | #154 | Good 47.1% |
| Immigrants | Iran | 74.7 /100 | #155 | Good 47.1% |
| Arabs | 73.3 /100 | #156 | Good 47.1% |
| Bhutanese | 72.6 /100 | #157 | Good 47.1% |
| Immigrants | Guyana | 71.9 /100 | #158 | Good 47.1% |
| Immigrants | Morocco | 71.4 /100 | #159 | Good 47.1% |
| Immigrants | Middle Africa | 68.3 /100 | #160 | Good 47.1% |
| South American Indians | 68.1 /100 | #161 | Good 47.1% |
| Pennsylvania Germans | 66.0 /100 | #162 | Good 47.2% |
| Immigrants | Eastern Africa | 65.5 /100 | #163 | Good 47.2% |
| French | 64.6 /100 | #164 | Good 47.2% |
| Immigrants | Zimbabwe | 64.4 /100 | #165 | Good 47.2% |
| Immigrants | Sierra Leone | 64.4 /100 | #166 | Good 47.2% |
| Moroccans | 62.9 /100 | #167 | Good 47.2% |
| Kenyans | 58.8 /100 | #168 | Average 47.2% |