Asian vs Immigrants from Indonesia Cognitive Disability
COMPARE
Asian
Immigrants from Indonesia
Cognitive Disability
Cognitive Disability Comparison
Asians
Immigrants from Indonesia
16.7%
COGNITIVE DISABILITY
98.7/ 100
METRIC RATING
94th/ 347
METRIC RANK
17.1%
COGNITIVE DISABILITY
82.7/ 100
METRIC RATING
152nd/ 347
METRIC RANK
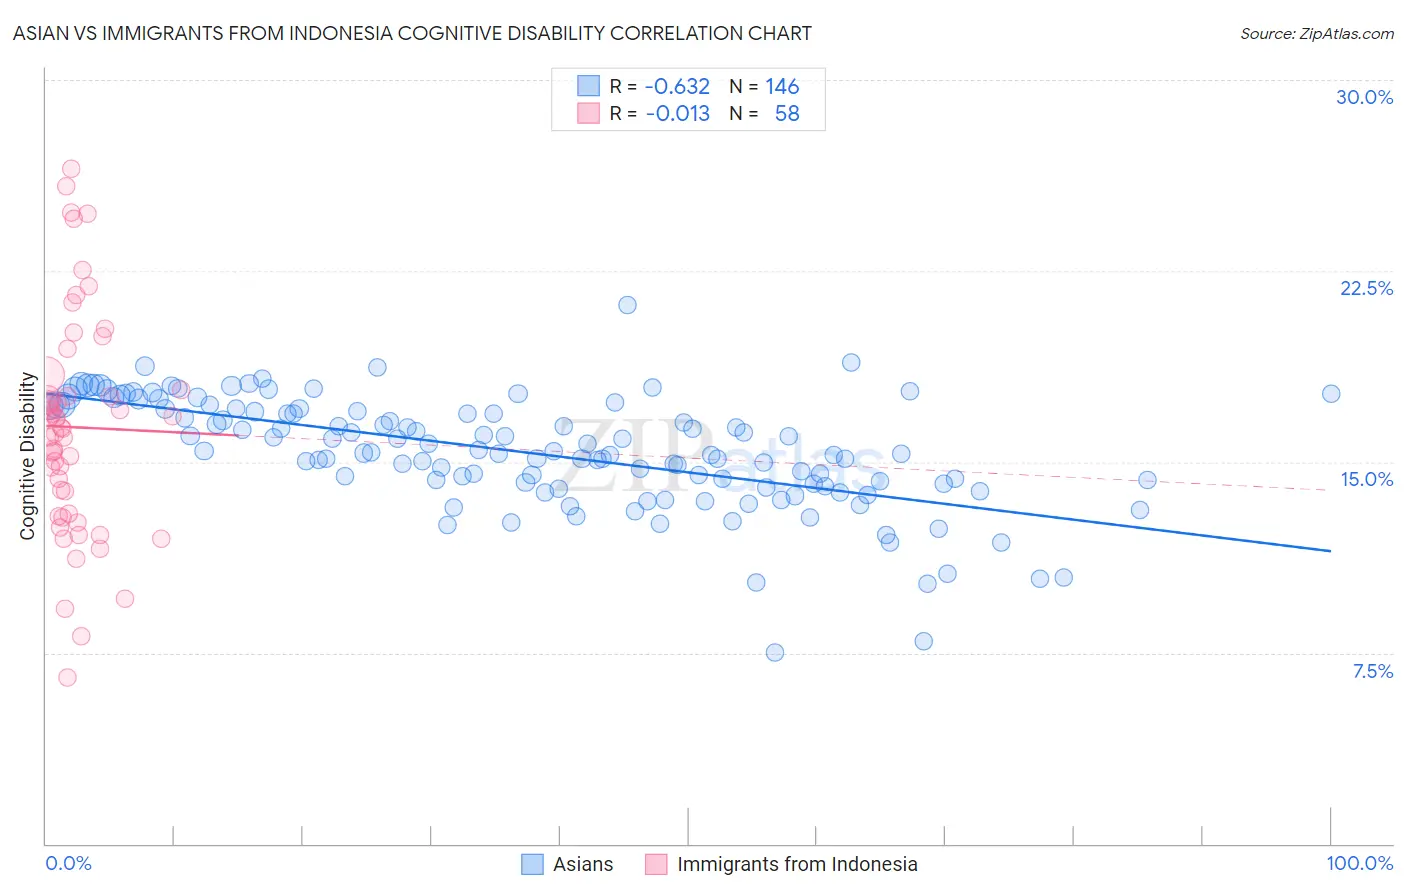
Asian vs Immigrants from Indonesia Cognitive Disability Correlation Chart
The statistical analysis conducted on geographies consisting of 550,791,869 people shows a significant negative correlation between the proportion of Asians and percentage of population with cognitive disability in the United States with a correlation coefficient (R) of -0.632 and weighted average of 16.7%. Similarly, the statistical analysis conducted on geographies consisting of 215,789,545 people shows no correlation between the proportion of Immigrants from Indonesia and percentage of population with cognitive disability in the United States with a correlation coefficient (R) of -0.013 and weighted average of 17.1%, a difference of 2.0%.
Cognitive Disability Correlation Summary
| Measurement | Asian | Immigrants from Indonesia |
| Minimum | 7.5% | 6.5% |
| Maximum | 21.2% | 26.5% |
| Range | 13.7% | 20.0% |
| Mean | 15.4% | 16.4% |
| Median | 15.4% | 16.3% |
| Interquartile 25% (IQ1) | 14.2% | 12.9% |
| Interquartile 75% (IQ3) | 17.1% | 17.8% |
| Interquartile Range (IQR) | 3.0% | 4.9% |
| Standard Deviation (Sample) | 2.2% | 4.3% |
| Standard Deviation (Population) | 2.2% | 4.3% |
Similar Demographics by Cognitive Disability
Demographics Similar to Asians by Cognitive Disability
In terms of cognitive disability, the demographic groups most similar to Asians are Immigrants from Southern Europe (16.7%, a difference of 0.040%), Immigrants from South America (16.7%, a difference of 0.050%), Danish (16.7%, a difference of 0.060%), English (16.8%, a difference of 0.060%), and Immigrants from Egypt (16.7%, a difference of 0.070%).
| Demographics | Rating | Rank | Cognitive Disability |
| Native Hawaiians | 99.0 /100 | #87 | Exceptional 16.7% |
| Immigrants | Philippines | 99.0 /100 | #88 | Exceptional 16.7% |
| Immigrants | Egypt | 98.8 /100 | #89 | Exceptional 16.7% |
| South Americans | 98.8 /100 | #90 | Exceptional 16.7% |
| Danes | 98.8 /100 | #91 | Exceptional 16.7% |
| Immigrants | South America | 98.8 /100 | #92 | Exceptional 16.7% |
| Immigrants | Southern Europe | 98.7 /100 | #93 | Exceptional 16.7% |
| Asians | 98.7 /100 | #94 | Exceptional 16.7% |
| English | 98.6 /100 | #95 | Exceptional 16.8% |
| Finns | 98.5 /100 | #96 | Exceptional 16.8% |
| Dutch | 98.5 /100 | #97 | Exceptional 16.8% |
| Immigrants | Lebanon | 98.4 /100 | #98 | Exceptional 16.8% |
| Jordanians | 98.2 /100 | #99 | Exceptional 16.8% |
| Immigrants | Russia | 98.2 /100 | #100 | Exceptional 16.8% |
| Immigrants | Asia | 98.1 /100 | #101 | Exceptional 16.8% |
Demographics Similar to Immigrants from Indonesia by Cognitive Disability
In terms of cognitive disability, the demographic groups most similar to Immigrants from Indonesia are Syrian (17.1%, a difference of 0.020%), Immigrants from Kazakhstan (17.1%, a difference of 0.10%), Basque (17.1%, a difference of 0.15%), French Canadian (17.1%, a difference of 0.16%), and Cypriot (17.1%, a difference of 0.16%).
| Demographics | Rating | Rank | Cognitive Disability |
| Immigrants | South Eastern Asia | 88.7 /100 | #145 | Excellent 17.0% |
| Costa Ricans | 88.0 /100 | #146 | Excellent 17.0% |
| Scotch-Irish | 85.9 /100 | #147 | Excellent 17.1% |
| French Canadians | 85.7 /100 | #148 | Excellent 17.1% |
| Cypriots | 85.7 /100 | #149 | Excellent 17.1% |
| Basques | 85.5 /100 | #150 | Excellent 17.1% |
| Syrians | 83.0 /100 | #151 | Excellent 17.1% |
| Immigrants | Indonesia | 82.7 /100 | #152 | Excellent 17.1% |
| Immigrants | Kazakhstan | 80.5 /100 | #153 | Excellent 17.1% |
| Immigrants | Malaysia | 79.3 /100 | #154 | Good 17.1% |
| Brazilians | 78.9 /100 | #155 | Good 17.1% |
| Sri Lankans | 78.9 /100 | #156 | Good 17.1% |
| Immigrants | Australia | 76.0 /100 | #157 | Good 17.1% |
| Celtics | 74.1 /100 | #158 | Good 17.1% |
| Immigrants | Latvia | 73.2 /100 | #159 | Good 17.2% |