Argentinean vs Immigrants from Austria Unemployment Among Ages 25 to 29 years
COMPARE
Argentinean
Immigrants from Austria
Unemployment Among Ages 25 to 29 years
Unemployment Among Ages 25 to 29 years Comparison
Argentineans
Immigrants from Austria
6.7%
UNEMPLOYMENT AMONG AGES 25 TO 29 YEARS
32.1/ 100
METRIC RATING
189th/ 347
METRIC RANK
6.8%
UNEMPLOYMENT AMONG AGES 25 TO 29 YEARS
12.3/ 100
METRIC RATING
218th/ 347
METRIC RANK
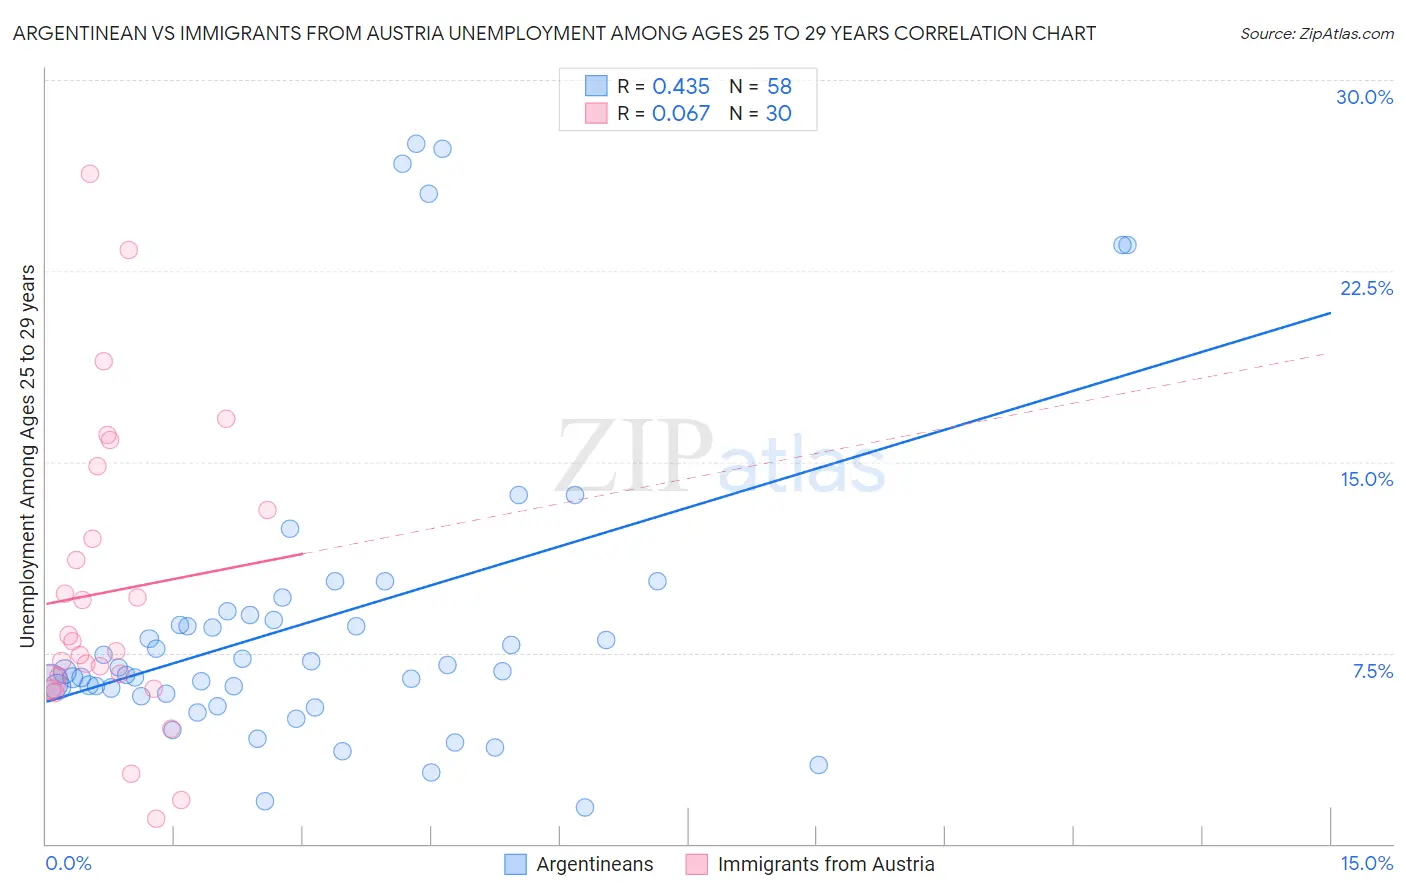
Argentinean vs Immigrants from Austria Unemployment Among Ages 25 to 29 years Correlation Chart
The statistical analysis conducted on geographies consisting of 287,291,410 people shows a moderate positive correlation between the proportion of Argentineans and unemployment rate among population between the ages 25 and 29 in the United States with a correlation coefficient (R) of 0.435 and weighted average of 6.7%. Similarly, the statistical analysis conducted on geographies consisting of 163,062,254 people shows a slight positive correlation between the proportion of Immigrants from Austria and unemployment rate among population between the ages 25 and 29 in the United States with a correlation coefficient (R) of 0.067 and weighted average of 6.8%, a difference of 1.8%.
Unemployment Among Ages 25 to 29 years Correlation Summary
| Measurement | Argentinean | Immigrants from Austria |
| Minimum | 1.4% | 1.0% |
| Maximum | 27.5% | 26.3% |
| Range | 26.1% | 25.3% |
| Mean | 8.9% | 9.9% |
| Median | 6.9% | 7.8% |
| Interquartile 25% (IQ1) | 5.9% | 6.3% |
| Interquartile 75% (IQ3) | 9.0% | 13.1% |
| Interquartile Range (IQR) | 3.1% | 6.8% |
| Standard Deviation (Sample) | 6.3% | 6.0% |
| Standard Deviation (Population) | 6.2% | 5.9% |
Similar Demographics by Unemployment Among Ages 25 to 29 years
Demographics Similar to Argentineans by Unemployment Among Ages 25 to 29 years
In terms of unemployment among ages 25 to 29 years, the demographic groups most similar to Argentineans are Irish (6.7%, a difference of 0.050%), Immigrants from South America (6.7%, a difference of 0.060%), Immigrants from Iran (6.7%, a difference of 0.16%), Korean (6.7%, a difference of 0.20%), and Moroccan (6.7%, a difference of 0.25%).
| Demographics | Rating | Rank | Unemployment Among Ages 25 to 29 years |
| Czechoslovakians | 40.7 /100 | #182 | Average 6.7% |
| Immigrants | Scotland | 39.6 /100 | #183 | Fair 6.7% |
| Immigrants | Costa Rica | 38.3 /100 | #184 | Fair 6.7% |
| Moroccans | 35.9 /100 | #185 | Fair 6.7% |
| Immigrants | Iran | 34.4 /100 | #186 | Fair 6.7% |
| Immigrants | South America | 33.0 /100 | #187 | Fair 6.7% |
| Irish | 32.8 /100 | #188 | Fair 6.7% |
| Argentineans | 32.1 /100 | #189 | Fair 6.7% |
| Koreans | 29.3 /100 | #190 | Fair 6.7% |
| Chickasaw | 28.7 /100 | #191 | Fair 6.7% |
| Immigrants | Ukraine | 28.6 /100 | #192 | Fair 6.7% |
| Alsatians | 28.1 /100 | #193 | Fair 6.7% |
| Immigrants | Greece | 28.0 /100 | #194 | Fair 6.7% |
| Immigrants | Western Asia | 27.3 /100 | #195 | Fair 6.7% |
| Hungarians | 26.8 /100 | #196 | Fair 6.8% |
Demographics Similar to Immigrants from Austria by Unemployment Among Ages 25 to 29 years
In terms of unemployment among ages 25 to 29 years, the demographic groups most similar to Immigrants from Austria are Ute (6.8%, a difference of 0.14%), Slovak (6.8%, a difference of 0.25%), White/Caucasian (6.9%, a difference of 0.26%), French (6.9%, a difference of 0.27%), and Spanish (6.8%, a difference of 0.28%).
| Demographics | Rating | Rank | Unemployment Among Ages 25 to 29 years |
| Immigrants | Philippines | 16.7 /100 | #211 | Poor 6.8% |
| Immigrants | Cabo Verde | 16.2 /100 | #212 | Poor 6.8% |
| Immigrants | Syria | 15.1 /100 | #213 | Poor 6.8% |
| Liberians | 14.7 /100 | #214 | Poor 6.8% |
| Spanish | 14.4 /100 | #215 | Poor 6.8% |
| Slovaks | 14.3 /100 | #216 | Poor 6.8% |
| Ute | 13.4 /100 | #217 | Poor 6.8% |
| Immigrants | Austria | 12.3 /100 | #218 | Poor 6.8% |
| Whites/Caucasians | 10.6 /100 | #219 | Poor 6.9% |
| French | 10.5 /100 | #220 | Poor 6.9% |
| Israelis | 9.8 /100 | #221 | Tragic 6.9% |
| Spaniards | 7.7 /100 | #222 | Tragic 6.9% |
| Celtics | 7.6 /100 | #223 | Tragic 6.9% |
| Immigrants | Immigrants | 6.2 /100 | #224 | Tragic 6.9% |
| Japanese | 5.4 /100 | #225 | Tragic 6.9% |