Arapaho vs Immigrants from Fiji Disability Age Under 5
COMPARE
Arapaho
Immigrants from Fiji
Disability Age Under 5
Disability Age Under 5 Comparison
Arapaho
Immigrants from Fiji
1.3%
DISABILITY AGE UNDER 5
24.1/ 100
METRIC RATING
202nd/ 347
METRIC RANK
0.92%
DISABILITY AGE UNDER 5
100.0/ 100
METRIC RATING
9th/ 347
METRIC RANK
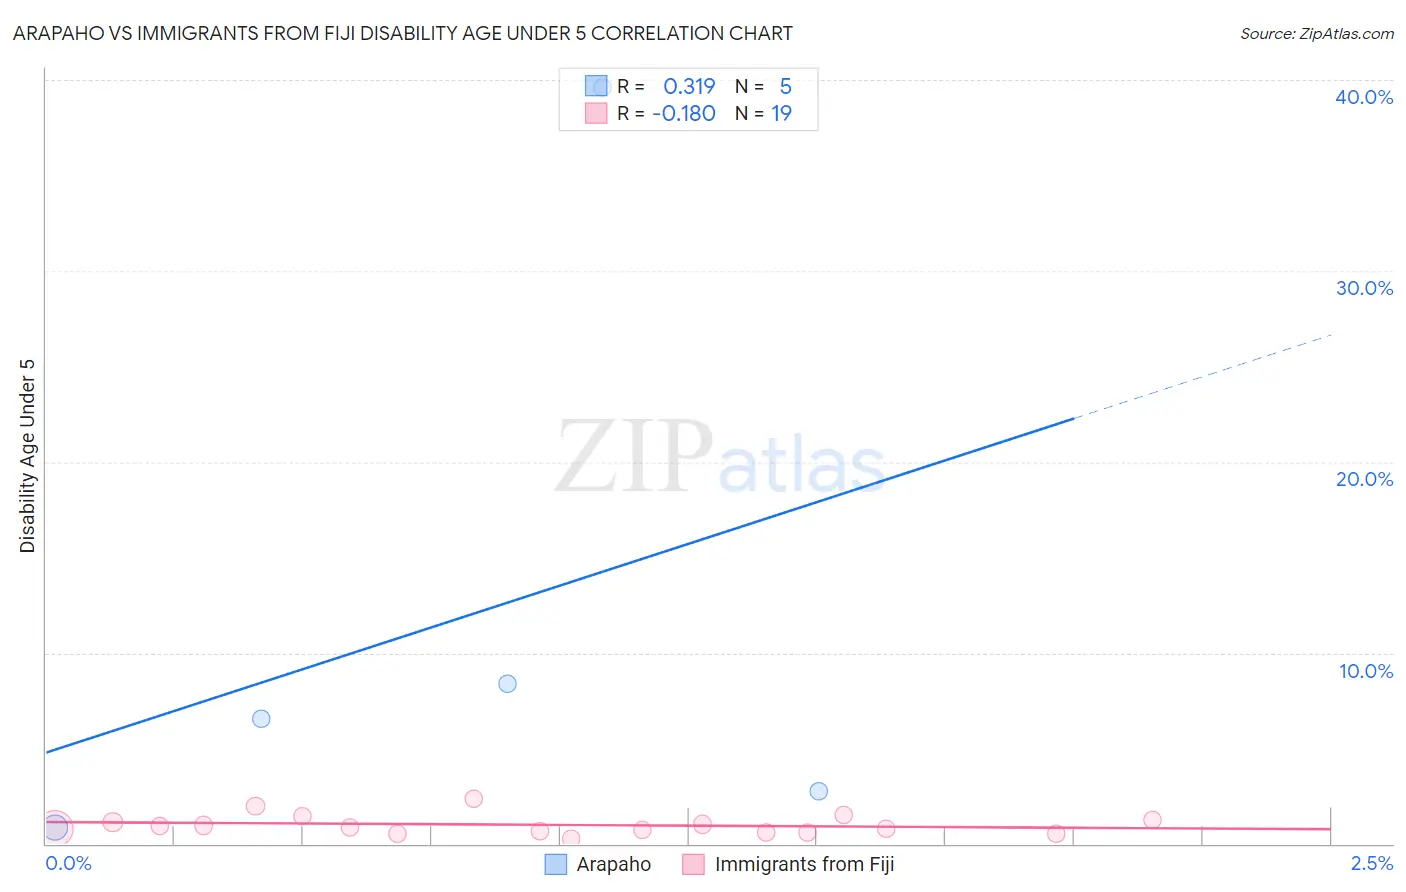
Arapaho vs Immigrants from Fiji Disability Age Under 5 Correlation Chart
The statistical analysis conducted on geographies consisting of 24,959,327 people shows a mild positive correlation between the proportion of Arapaho and percentage of population with a disability under the age of 5 in the United States with a correlation coefficient (R) of 0.319 and weighted average of 1.3%. Similarly, the statistical analysis conducted on geographies consisting of 74,961,112 people shows a poor negative correlation between the proportion of Immigrants from Fiji and percentage of population with a disability under the age of 5 in the United States with a correlation coefficient (R) of -0.180 and weighted average of 0.92%, a difference of 38.7%.
Disability Age Under 5 Correlation Summary
| Measurement | Arapaho | Immigrants from Fiji |
| Minimum | 0.87% | 0.28% |
| Maximum | 39.6% | 2.3% |
| Range | 38.7% | 2.1% |
| Mean | 11.6% | 0.99% |
| Median | 6.5% | 0.85% |
| Interquartile 25% (IQ1) | 1.8% | 0.60% |
| Interquartile 75% (IQ3) | 24.0% | 1.2% |
| Interquartile Range (IQR) | 22.2% | 0.62% |
| Standard Deviation (Sample) | 15.9% | 0.52% |
| Standard Deviation (Population) | 14.2% | 0.50% |
Similar Demographics by Disability Age Under 5
Demographics Similar to Arapaho by Disability Age Under 5
In terms of disability age under 5, the demographic groups most similar to Arapaho are Liberian (1.3%, a difference of 0.020%), Immigrants from Europe (1.3%, a difference of 0.060%), Immigrants from Italy (1.3%, a difference of 0.15%), Romanian (1.3%, a difference of 0.20%), and Immigrants from Poland (1.3%, a difference of 0.22%).
| Demographics | Rating | Rank | Disability Age Under 5 |
| U.S. Virgin Islanders | 34.4 /100 | #195 | Fair 1.3% |
| Immigrants | Belgium | 31.4 /100 | #196 | Fair 1.3% |
| Immigrants | Somalia | 31.3 /100 | #197 | Fair 1.3% |
| Immigrants | Norway | 31.1 /100 | #198 | Fair 1.3% |
| Jamaicans | 30.7 /100 | #199 | Fair 1.3% |
| Immigrants | Lithuania | 27.2 /100 | #200 | Fair 1.3% |
| Immigrants | Italy | 25.4 /100 | #201 | Fair 1.3% |
| Arapaho | 24.1 /100 | #202 | Fair 1.3% |
| Liberians | 24.0 /100 | #203 | Fair 1.3% |
| Immigrants | Europe | 23.6 /100 | #204 | Fair 1.3% |
| Romanians | 22.5 /100 | #205 | Fair 1.3% |
| Immigrants | Poland | 22.4 /100 | #206 | Fair 1.3% |
| Nigerians | 21.2 /100 | #207 | Fair 1.3% |
| Mexicans | 20.8 /100 | #208 | Fair 1.3% |
| Bulgarians | 19.5 /100 | #209 | Poor 1.3% |
Demographics Similar to Immigrants from Fiji by Disability Age Under 5
In terms of disability age under 5, the demographic groups most similar to Immigrants from Fiji are Immigrants from Yemen (0.91%, a difference of 1.1%), Immigrants from Afghanistan (0.91%, a difference of 1.2%), Marshallese (0.94%, a difference of 2.1%), Afghan (0.94%, a difference of 2.9%), and Immigrants from Grenada (0.94%, a difference of 2.9%).
| Demographics | Rating | Rank | Disability Age Under 5 |
| Immigrants | St. Vincent and the Grenadines | 100.0 /100 | #2 | Exceptional 0.79% |
| Vietnamese | 100.0 /100 | #3 | Exceptional 0.81% |
| Immigrants | Uzbekistan | 100.0 /100 | #4 | Exceptional 0.85% |
| Immigrants | Bangladesh | 100.0 /100 | #5 | Exceptional 0.85% |
| Ute | 100.0 /100 | #6 | Exceptional 0.86% |
| Immigrants | Afghanistan | 100.0 /100 | #7 | Exceptional 0.91% |
| Immigrants | Yemen | 100.0 /100 | #8 | Exceptional 0.91% |
| Immigrants | Fiji | 100.0 /100 | #9 | Exceptional 0.92% |
| Marshallese | 100.0 /100 | #10 | Exceptional 0.94% |
| Afghans | 100.0 /100 | #11 | Exceptional 0.94% |
| Immigrants | Grenada | 100.0 /100 | #12 | Exceptional 0.94% |
| Soviet Union | 100.0 /100 | #13 | Exceptional 0.95% |
| Yuman | 100.0 /100 | #14 | Exceptional 0.95% |
| Immigrants | Hong Kong | 100.0 /100 | #15 | Exceptional 0.95% |
| Immigrants | Israel | 100.0 /100 | #16 | Exceptional 0.96% |