Immigrants from Latvia vs Immigrants from Jordan Disability Age Over 75
COMPARE
Immigrants from Latvia
Immigrants from Jordan
Disability Age Over 75
Disability Age Over 75 Comparison
Immigrants from Latvia
Immigrants from Jordan
46.2%
DISABILITY AGE OVER 75
98.7/ 100
METRIC RATING
82nd/ 347
METRIC RANK
46.2%
DISABILITY AGE OVER 75
98.7/ 100
METRIC RATING
84th/ 347
METRIC RANK
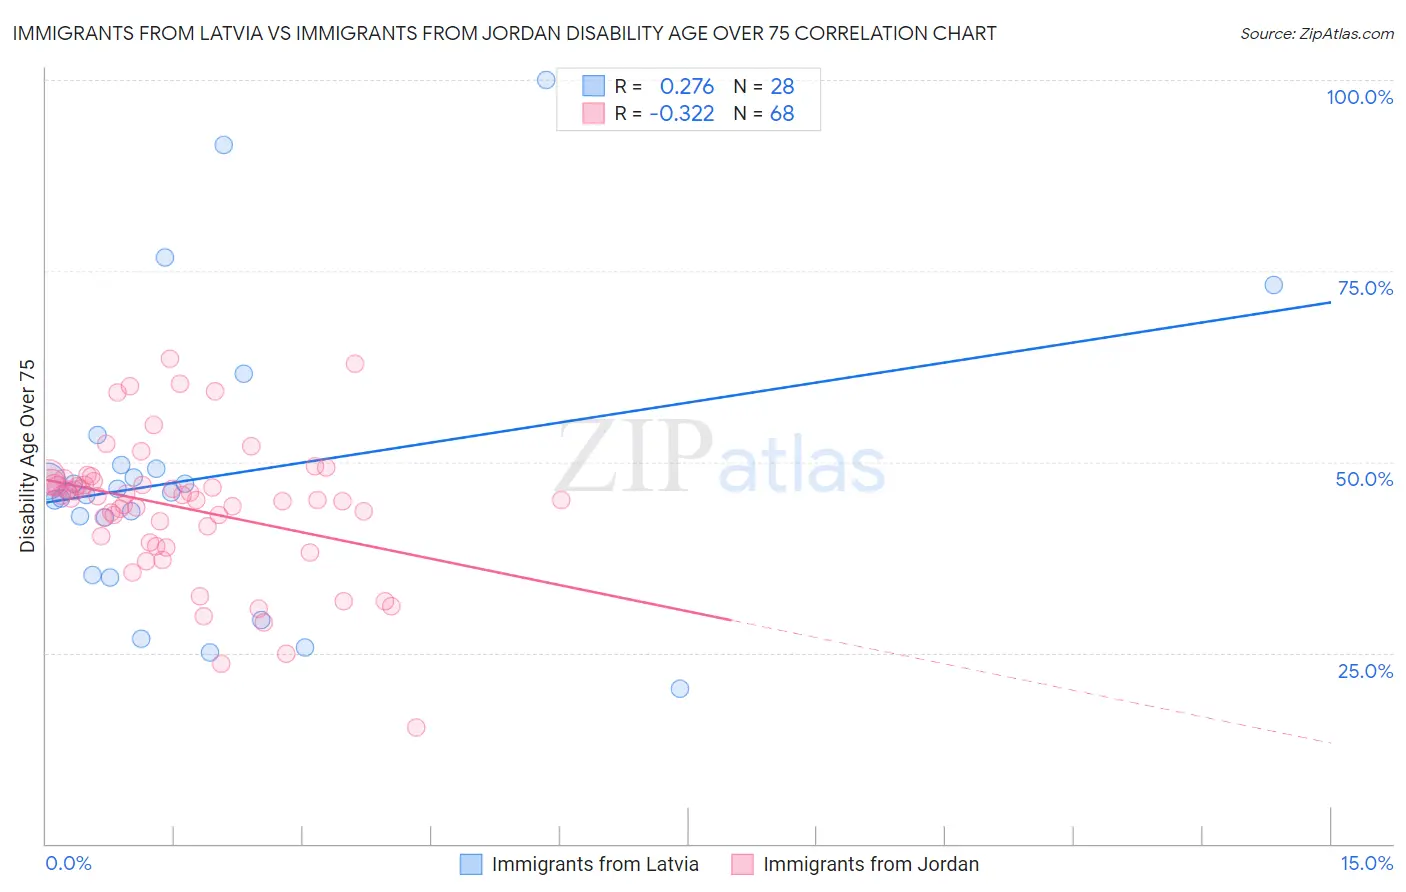
Immigrants from Latvia vs Immigrants from Jordan Disability Age Over 75 Correlation Chart
The statistical analysis conducted on geographies consisting of 113,692,230 people shows a weak positive correlation between the proportion of Immigrants from Latvia and percentage of population with a disability over the age of 75 in the United States with a correlation coefficient (R) of 0.276 and weighted average of 46.2%. Similarly, the statistical analysis conducted on geographies consisting of 181,194,306 people shows a mild negative correlation between the proportion of Immigrants from Jordan and percentage of population with a disability over the age of 75 in the United States with a correlation coefficient (R) of -0.322 and weighted average of 46.2%, a difference of 0.010%.
Disability Age Over 75 Correlation Summary
| Measurement | Immigrants from Latvia | Immigrants from Jordan |
| Minimum | 20.3% | 15.2% |
| Maximum | 100.0% | 63.5% |
| Range | 79.7% | 48.4% |
| Mean | 48.1% | 43.9% |
| Median | 46.1% | 45.1% |
| Interquartile 25% (IQ1) | 39.0% | 39.8% |
| Interquartile 75% (IQ3) | 49.3% | 47.4% |
| Interquartile Range (IQR) | 10.4% | 7.5% |
| Standard Deviation (Sample) | 18.6% | 9.0% |
| Standard Deviation (Population) | 18.2% | 8.9% |
Demographics Similar to Immigrants from Latvia and Immigrants from Jordan by Disability Age Over 75
In terms of disability age over 75, the demographic groups most similar to Immigrants from Latvia are Argentinean (46.2%, a difference of 0.0%), Soviet Union (46.2%, a difference of 0.020%), New Zealander (46.2%, a difference of 0.020%), Swiss (46.2%, a difference of 0.030%), and Immigrants from Southern Europe (46.2%, a difference of 0.030%). Similarly, the demographic groups most similar to Immigrants from Jordan are Argentinean (46.2%, a difference of 0.010%), Immigrants from Southern Europe (46.2%, a difference of 0.020%), Romanian (46.2%, a difference of 0.020%), Danish (46.2%, a difference of 0.020%), and New Zealander (46.2%, a difference of 0.030%).
| Demographics | Rating | Rank | Disability Age Over 75 |
| Cambodians | 99.1 /100 | #73 | Exceptional 46.1% |
| Egyptians | 99.0 /100 | #74 | Exceptional 46.1% |
| Serbians | 99.0 /100 | #75 | Exceptional 46.1% |
| Slavs | 98.9 /100 | #76 | Exceptional 46.1% |
| Immigrants | Eastern Asia | 98.9 /100 | #77 | Exceptional 46.2% |
| Immigrants | Western Europe | 98.8 /100 | #78 | Exceptional 46.2% |
| Swiss | 98.8 /100 | #79 | Exceptional 46.2% |
| Soviet Union | 98.8 /100 | #80 | Exceptional 46.2% |
| New Zealanders | 98.8 /100 | #81 | Exceptional 46.2% |
| Immigrants | Latvia | 98.7 /100 | #82 | Exceptional 46.2% |
| Argentineans | 98.7 /100 | #83 | Exceptional 46.2% |
| Immigrants | Jordan | 98.7 /100 | #84 | Exceptional 46.2% |
| Immigrants | Southern Europe | 98.6 /100 | #85 | Exceptional 46.2% |
| Romanians | 98.6 /100 | #86 | Exceptional 46.2% |
| Danes | 98.6 /100 | #87 | Exceptional 46.2% |
| Uruguayans | 98.4 /100 | #88 | Exceptional 46.2% |
| Immigrants | Saudi Arabia | 98.4 /100 | #89 | Exceptional 46.3% |
| Northern Europeans | 98.3 /100 | #90 | Exceptional 46.3% |
| Immigrants | Egypt | 98.3 /100 | #91 | Exceptional 46.3% |
| Germans | 98.2 /100 | #92 | Exceptional 46.3% |
| Ugandans | 98.2 /100 | #93 | Exceptional 46.3% |