American vs Maltese Hearing Disability
COMPARE
American
Maltese
Hearing Disability
Hearing Disability Comparison
Americans
Maltese
3.9%
HEARING DISABILITY
0.0/ 100
METRIC RATING
311th/ 347
METRIC RANK
3.2%
HEARING DISABILITY
4.1/ 100
METRIC RATING
229th/ 347
METRIC RANK
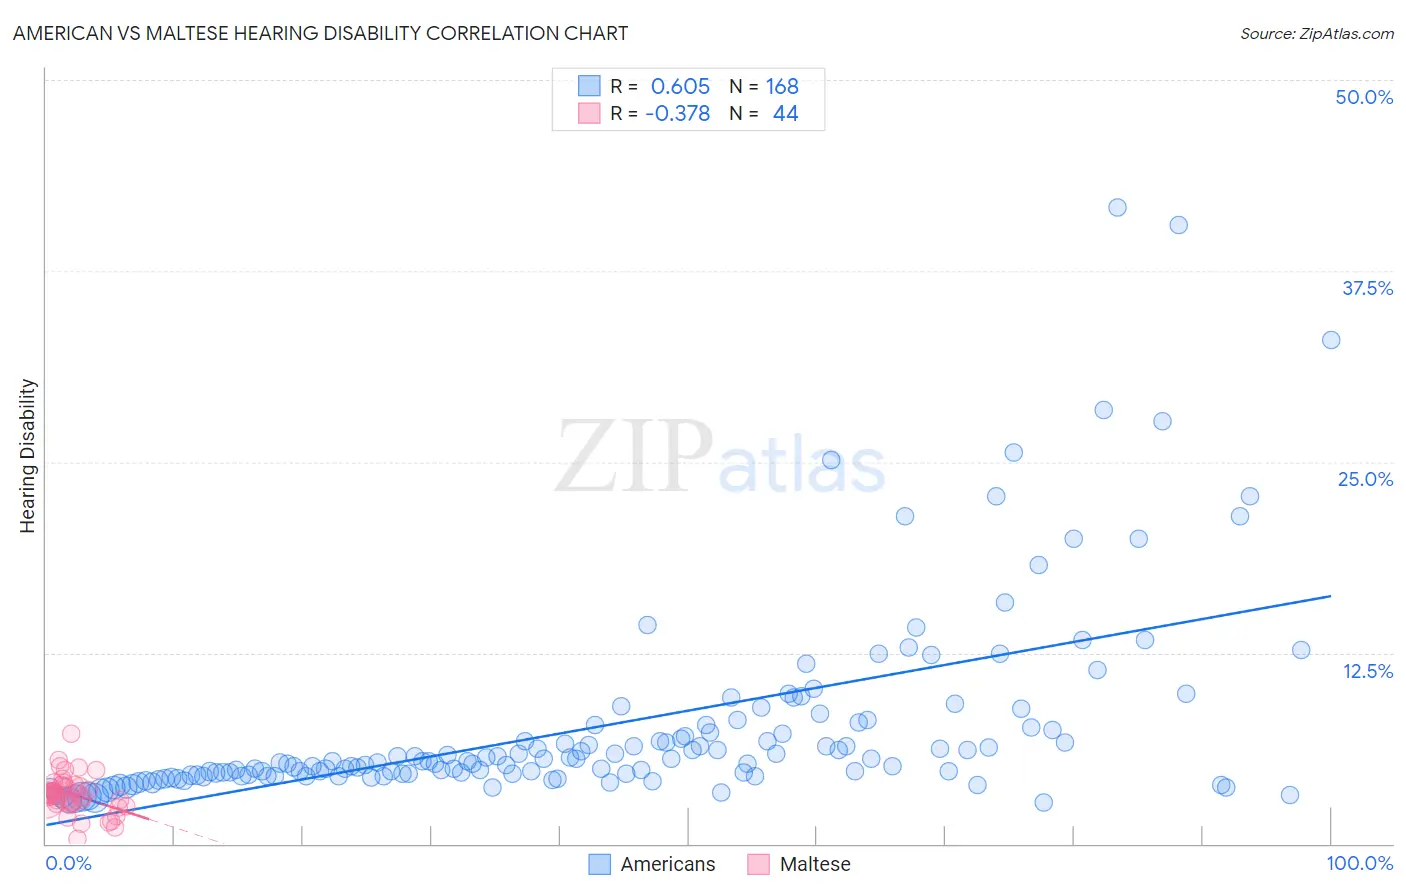
American vs Maltese Hearing Disability Correlation Chart
The statistical analysis conducted on geographies consisting of 581,034,081 people shows a significant positive correlation between the proportion of Americans and percentage of population with hearing disability in the United States with a correlation coefficient (R) of 0.605 and weighted average of 3.9%. Similarly, the statistical analysis conducted on geographies consisting of 126,465,579 people shows a mild negative correlation between the proportion of Maltese and percentage of population with hearing disability in the United States with a correlation coefficient (R) of -0.378 and weighted average of 3.2%, a difference of 21.1%.
Hearing Disability Correlation Summary
| Measurement | American | Maltese |
| Minimum | 2.7% | 0.30% |
| Maximum | 41.7% | 7.2% |
| Range | 38.9% | 6.9% |
| Mean | 7.7% | 3.2% |
| Median | 5.4% | 3.2% |
| Interquartile 25% (IQ1) | 4.5% | 2.7% |
| Interquartile 75% (IQ3) | 7.7% | 3.8% |
| Interquartile Range (IQR) | 3.2% | 1.1% |
| Standard Deviation (Sample) | 6.5% | 1.3% |
| Standard Deviation (Population) | 6.5% | 1.2% |
Similar Demographics by Hearing Disability
Demographics Similar to Americans by Hearing Disability
In terms of hearing disability, the demographic groups most similar to Americans are Cajun (3.9%, a difference of 1.1%), Hopi (3.9%, a difference of 1.2%), Cree (3.8%, a difference of 1.3%), Yakama (3.9%, a difference of 1.4%), and Puget Sound Salish (3.9%, a difference of 1.4%).
| Demographics | Rating | Rank | Hearing Disability |
| French | 0.0 /100 | #304 | Tragic 3.8% |
| English | 0.0 /100 | #305 | Tragic 3.8% |
| Marshallese | 0.0 /100 | #306 | Tragic 3.8% |
| French Canadians | 0.0 /100 | #307 | Tragic 3.8% |
| Ottawa | 0.0 /100 | #308 | Tragic 3.8% |
| Scotch-Irish | 0.0 /100 | #309 | Tragic 3.8% |
| Cree | 0.0 /100 | #310 | Tragic 3.8% |
| Americans | 0.0 /100 | #311 | Tragic 3.9% |
| Cajuns | 0.0 /100 | #312 | Tragic 3.9% |
| Hopi | 0.0 /100 | #313 | Tragic 3.9% |
| Yakama | 0.0 /100 | #314 | Tragic 3.9% |
| Puget Sound Salish | 0.0 /100 | #315 | Tragic 3.9% |
| Spanish Americans | 0.0 /100 | #316 | Tragic 4.0% |
| Comanche | 0.0 /100 | #317 | Tragic 4.0% |
| Cheyenne | 0.0 /100 | #318 | Tragic 4.0% |
Demographics Similar to Maltese by Hearing Disability
In terms of hearing disability, the demographic groups most similar to Maltese are Immigrants from Portugal (3.2%, a difference of 0.11%), Bhutanese (3.2%, a difference of 0.30%), Lebanese (3.2%, a difference of 0.49%), Greek (3.2%, a difference of 0.51%), and Latvian (3.2%, a difference of 0.53%).
| Demographics | Rating | Rank | Hearing Disability |
| Immigrants | Oceania | 6.5 /100 | #222 | Tragic 3.2% |
| Mexicans | 5.6 /100 | #223 | Tragic 3.2% |
| Icelanders | 5.2 /100 | #224 | Tragic 3.2% |
| Latvians | 5.1 /100 | #225 | Tragic 3.2% |
| Lebanese | 5.0 /100 | #226 | Tragic 3.2% |
| Bhutanese | 4.6 /100 | #227 | Tragic 3.2% |
| Immigrants | Portugal | 4.3 /100 | #228 | Tragic 3.2% |
| Maltese | 4.1 /100 | #229 | Tragic 3.2% |
| Greeks | 3.2 /100 | #230 | Tragic 3.2% |
| Luxembourgers | 2.9 /100 | #231 | Tragic 3.2% |
| Ukrainians | 2.9 /100 | #232 | Tragic 3.2% |
| Estonians | 2.4 /100 | #233 | Tragic 3.3% |
| Central American Indians | 2.3 /100 | #234 | Tragic 3.3% |
| Guamanians/Chamorros | 2.2 /100 | #235 | Tragic 3.3% |
| Serbians | 2.2 /100 | #236 | Tragic 3.3% |