American vs Immigrants from Chile No Vehicles in Household
COMPARE
American
Immigrants from Chile
No Vehicles in Household
No Vehicles in Household Comparison
Americans
Immigrants from Chile
7.7%
NO VEHICLES IN HOUSEHOLD
100.0/ 100
METRIC RATING
29th/ 347
METRIC RANK
11.0%
NO VEHICLES IN HOUSEHOLD
15.9/ 100
METRIC RATING
205th/ 347
METRIC RANK
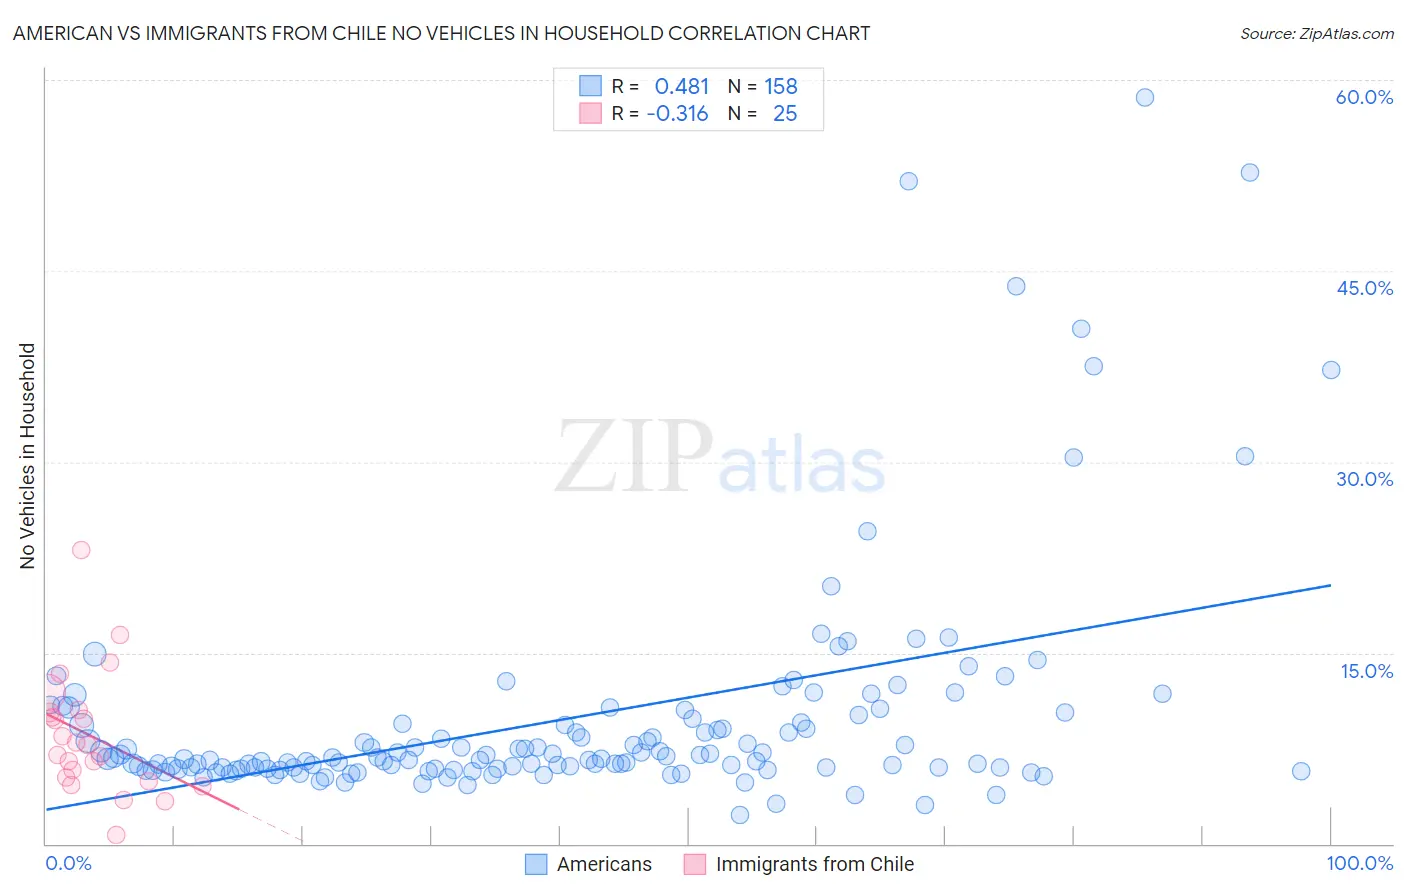
American vs Immigrants from Chile No Vehicles in Household Correlation Chart
The statistical analysis conducted on geographies consisting of 575,304,149 people shows a moderate positive correlation between the proportion of Americans and percentage of households with no vehicle available in the United States with a correlation coefficient (R) of 0.481 and weighted average of 7.7%. Similarly, the statistical analysis conducted on geographies consisting of 218,421,447 people shows a mild negative correlation between the proportion of Immigrants from Chile and percentage of households with no vehicle available in the United States with a correlation coefficient (R) of -0.316 and weighted average of 11.0%, a difference of 43.6%.
No Vehicles in Household Correlation Summary
| Measurement | American | Immigrants from Chile |
| Minimum | 2.2% | 0.72% |
| Maximum | 58.7% | 23.1% |
| Range | 56.4% | 22.4% |
| Mean | 9.8% | 8.5% |
| Median | 6.7% | 7.8% |
| Interquartile 25% (IQ1) | 5.9% | 5.1% |
| Interquartile 75% (IQ3) | 9.5% | 10.4% |
| Interquartile Range (IQR) | 3.6% | 5.3% |
| Standard Deviation (Sample) | 9.0% | 4.8% |
| Standard Deviation (Population) | 9.0% | 4.7% |
Similar Demographics by No Vehicles in Household
Demographics Similar to Americans by No Vehicles in Household
In terms of no vehicles in household, the demographic groups most similar to Americans are Samoan (7.6%, a difference of 0.29%), Finnish (7.7%, a difference of 0.30%), Native Hawaiian (7.7%, a difference of 0.45%), Malaysian (7.7%, a difference of 0.70%), and Immigrants from Taiwan (7.7%, a difference of 0.81%).
| Demographics | Rating | Rank | No Vehicles in Household |
| Irish | 100.0 /100 | #22 | Exceptional 7.4% |
| French | 100.0 /100 | #23 | Exceptional 7.4% |
| Immigrants | Iraq | 100.0 /100 | #24 | Exceptional 7.5% |
| Yaqui | 100.0 /100 | #25 | Exceptional 7.5% |
| Sri Lankans | 100.0 /100 | #26 | Exceptional 7.6% |
| British | 100.0 /100 | #27 | Exceptional 7.6% |
| Samoans | 100.0 /100 | #28 | Exceptional 7.6% |
| Americans | 100.0 /100 | #29 | Exceptional 7.7% |
| Finns | 100.0 /100 | #30 | Exceptional 7.7% |
| Native Hawaiians | 100.0 /100 | #31 | Exceptional 7.7% |
| Malaysians | 100.0 /100 | #32 | Exceptional 7.7% |
| Immigrants | Taiwan | 100.0 /100 | #33 | Exceptional 7.7% |
| Immigrants | Vietnam | 100.0 /100 | #34 | Exceptional 7.7% |
| Cherokee | 99.9 /100 | #35 | Exceptional 7.7% |
| Iraqis | 99.9 /100 | #36 | Exceptional 7.7% |
Demographics Similar to Immigrants from Chile by No Vehicles in Household
In terms of no vehicles in household, the demographic groups most similar to Immigrants from Chile are Somali (11.0%, a difference of 0.0%), Guatemalan (11.0%, a difference of 0.040%), Sierra Leonean (11.0%, a difference of 0.050%), Immigrants from Italy (11.0%, a difference of 0.070%), and Pennsylvania German (11.0%, a difference of 0.10%).
| Demographics | Rating | Rank | No Vehicles in Household |
| Immigrants | Sweden | 22.9 /100 | #198 | Fair 10.8% |
| Immigrants | Asia | 21.3 /100 | #199 | Fair 10.9% |
| Cambodians | 19.6 /100 | #200 | Poor 10.9% |
| Immigrants | Western Europe | 19.1 /100 | #201 | Poor 10.9% |
| Romanians | 17.9 /100 | #202 | Poor 10.9% |
| Iroquois | 17.6 /100 | #203 | Poor 10.9% |
| Guatemalans | 16.1 /100 | #204 | Poor 11.0% |
| Immigrants | Chile | 15.9 /100 | #205 | Poor 11.0% |
| Somalis | 15.9 /100 | #206 | Poor 11.0% |
| Sierra Leoneans | 15.7 /100 | #207 | Poor 11.0% |
| Immigrants | Italy | 15.6 /100 | #208 | Poor 11.0% |
| Pennsylvania Germans | 15.5 /100 | #209 | Poor 11.0% |
| Apache | 14.8 /100 | #210 | Poor 11.0% |
| Crow | 14.2 /100 | #211 | Poor 11.0% |
| Immigrants | Western Asia | 13.9 /100 | #212 | Poor 11.0% |