Alsatian vs Immigrants from St. Vincent and the Grenadines Male Disability
COMPARE
Alsatian
Immigrants from St. Vincent and the Grenadines
Male Disability
Male Disability Comparison
Alsatians
Immigrants from St. Vincent and the Grenadines
11.7%
MALE DISABILITY
3.3/ 100
METRIC RATING
222nd/ 347
METRIC RANK
10.7%
MALE DISABILITY
97.1/ 100
METRIC RATING
93rd/ 347
METRIC RANK
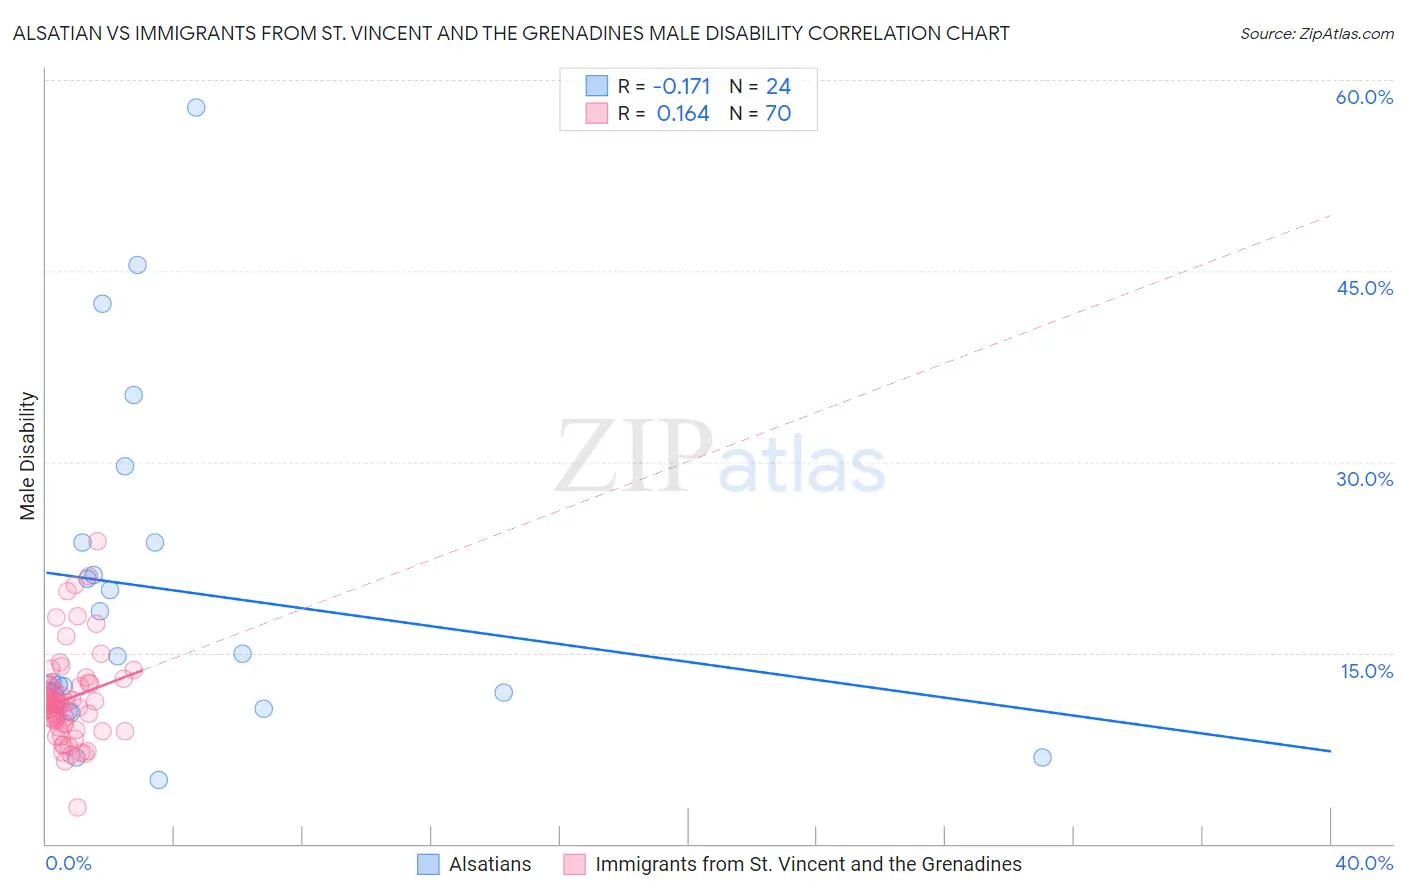
Alsatian vs Immigrants from St. Vincent and the Grenadines Male Disability Correlation Chart
The statistical analysis conducted on geographies consisting of 82,682,247 people shows a poor negative correlation between the proportion of Alsatians and percentage of males with a disability in the United States with a correlation coefficient (R) of -0.171 and weighted average of 11.7%. Similarly, the statistical analysis conducted on geographies consisting of 56,189,334 people shows a poor positive correlation between the proportion of Immigrants from St. Vincent and the Grenadines and percentage of males with a disability in the United States with a correlation coefficient (R) of 0.164 and weighted average of 10.7%, a difference of 10.0%.
Male Disability Correlation Summary
| Measurement | Alsatian | Immigrants from St. Vincent and the Grenadines |
| Minimum | 5.0% | 2.8% |
| Maximum | 57.8% | 23.8% |
| Range | 52.8% | 20.9% |
| Mean | 19.9% | 11.4% |
| Median | 14.9% | 11.0% |
| Interquartile 25% (IQ1) | 10.9% | 9.4% |
| Interquartile 75% (IQ3) | 23.6% | 12.5% |
| Interquartile Range (IQR) | 12.7% | 3.1% |
| Standard Deviation (Sample) | 13.4% | 3.6% |
| Standard Deviation (Population) | 13.1% | 3.6% |
Similar Demographics by Male Disability
Demographics Similar to Alsatians by Male Disability
In terms of male disability, the demographic groups most similar to Alsatians are Immigrants from Bahamas (11.7%, a difference of 0.080%), Japanese (11.7%, a difference of 0.11%), Liberian (11.8%, a difference of 0.12%), Immigrants from Congo (11.7%, a difference of 0.15%), and Panamanian (11.7%, a difference of 0.17%).
| Demographics | Rating | Rank | Male Disability |
| Indonesians | 5.9 /100 | #215 | Tragic 11.6% |
| Immigrants | Dominican Republic | 4.9 /100 | #216 | Tragic 11.7% |
| Immigrants | Dominica | 4.6 /100 | #217 | Tragic 11.7% |
| Immigrants | England | 4.0 /100 | #218 | Tragic 11.7% |
| Panamanians | 3.8 /100 | #219 | Tragic 11.7% |
| Immigrants | Western Europe | 3.8 /100 | #220 | Tragic 11.7% |
| Immigrants | Congo | 3.7 /100 | #221 | Tragic 11.7% |
| Alsatians | 3.3 /100 | #222 | Tragic 11.7% |
| Immigrants | Bahamas | 3.2 /100 | #223 | Tragic 11.7% |
| Japanese | 3.1 /100 | #224 | Tragic 11.7% |
| Liberians | 3.1 /100 | #225 | Tragic 11.8% |
| Sub-Saharan Africans | 2.8 /100 | #226 | Tragic 11.8% |
| Austrians | 2.5 /100 | #227 | Tragic 11.8% |
| Hispanics or Latinos | 2.3 /100 | #228 | Tragic 11.8% |
| Bermudans | 2.3 /100 | #229 | Tragic 11.8% |
Demographics Similar to Immigrants from St. Vincent and the Grenadines by Male Disability
In terms of male disability, the demographic groups most similar to Immigrants from St. Vincent and the Grenadines are Immigrants from Sweden (10.7%, a difference of 0.11%), Palestinian (10.7%, a difference of 0.13%), Chilean (10.7%, a difference of 0.14%), Nicaraguan (10.7%, a difference of 0.24%), and Immigrants from Armenia (10.7%, a difference of 0.26%).
| Demographics | Rating | Rank | Male Disability |
| Immigrants | Ireland | 97.9 /100 | #86 | Exceptional 10.6% |
| Immigrants | Vietnam | 97.9 /100 | #87 | Exceptional 10.6% |
| Immigrants | Western Asia | 97.8 /100 | #88 | Exceptional 10.6% |
| Immigrants | Nicaragua | 97.8 /100 | #89 | Exceptional 10.6% |
| Immigrants | Morocco | 97.7 /100 | #90 | Exceptional 10.6% |
| Immigrants | France | 97.6 /100 | #91 | Exceptional 10.6% |
| Palestinians | 97.4 /100 | #92 | Exceptional 10.7% |
| Immigrants | St. Vincent and the Grenadines | 97.1 /100 | #93 | Exceptional 10.7% |
| Immigrants | Sweden | 96.9 /100 | #94 | Exceptional 10.7% |
| Chileans | 96.9 /100 | #95 | Exceptional 10.7% |
| Nicaraguans | 96.6 /100 | #96 | Exceptional 10.7% |
| Immigrants | Armenia | 96.6 /100 | #97 | Exceptional 10.7% |
| Immigrants | Romania | 96.5 /100 | #98 | Exceptional 10.7% |
| Immigrants | Switzerland | 96.1 /100 | #99 | Exceptional 10.7% |
| Immigrants | Kazakhstan | 95.9 /100 | #100 | Exceptional 10.7% |