Albanian vs Immigrants from Panama Disability Age 18 to 34
COMPARE
Albanian
Immigrants from Panama
Disability Age 18 to 34
Disability Age 18 to 34 Comparison
Albanians
Immigrants from Panama
6.4%
DISABILITY AGE 18 TO 34
85.3/ 100
METRIC RATING
144th/ 347
METRIC RANK
6.5%
DISABILITY AGE 18 TO 34
75.3/ 100
METRIC RATING
156th/ 347
METRIC RANK
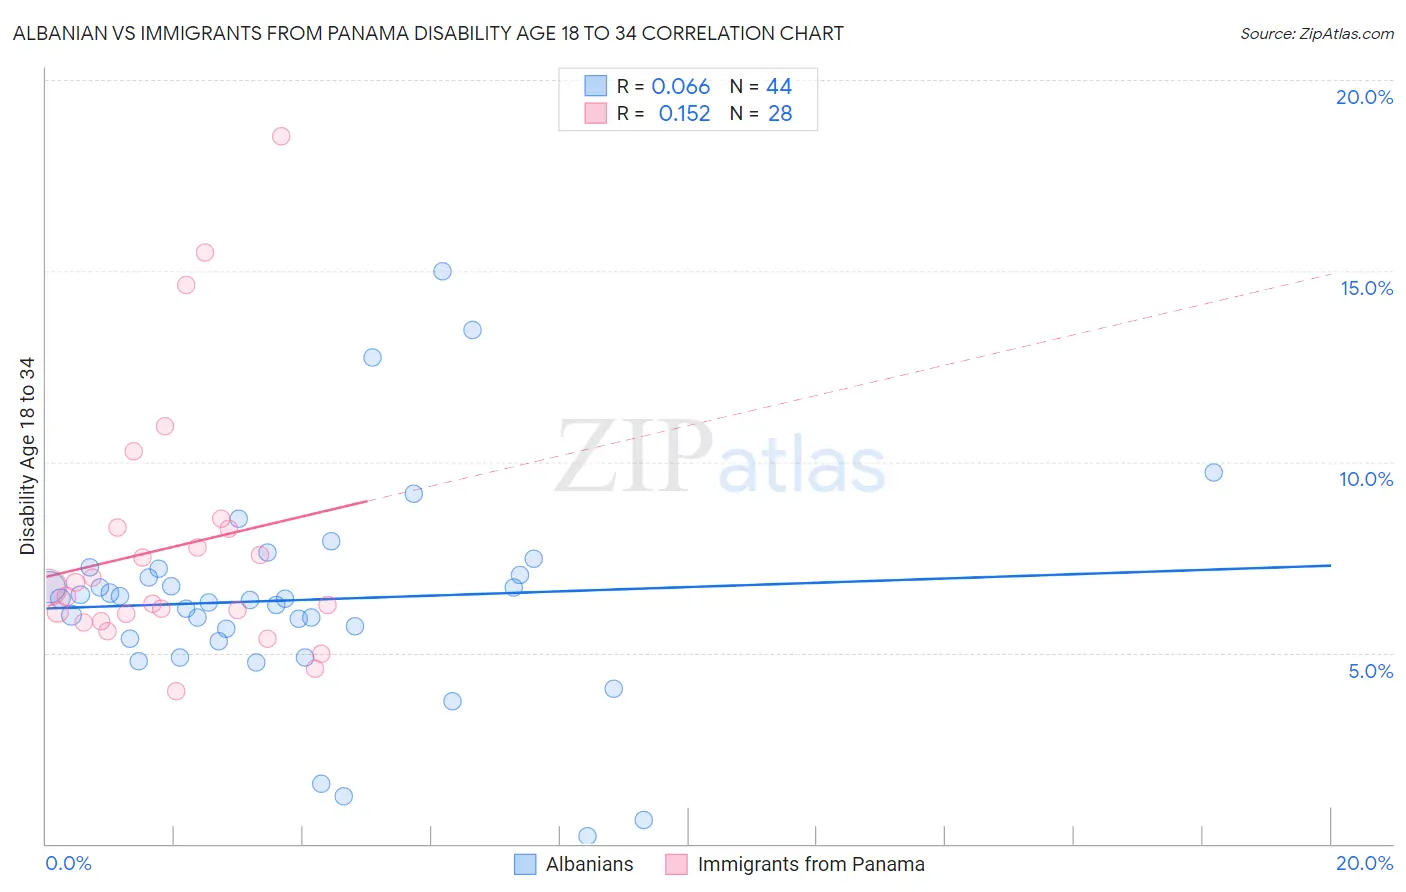
Albanian vs Immigrants from Panama Disability Age 18 to 34 Correlation Chart
The statistical analysis conducted on geographies consisting of 192,986,276 people shows a slight positive correlation between the proportion of Albanians and percentage of population with a disability between the ages 18 and 35 in the United States with a correlation coefficient (R) of 0.066 and weighted average of 6.4%. Similarly, the statistical analysis conducted on geographies consisting of 221,091,692 people shows a poor positive correlation between the proportion of Immigrants from Panama and percentage of population with a disability between the ages 18 and 35 in the United States with a correlation coefficient (R) of 0.152 and weighted average of 6.5%, a difference of 1.1%.
Disability Age 18 to 34 Correlation Summary
| Measurement | Albanian | Immigrants from Panama |
| Minimum | 0.20% | 4.0% |
| Maximum | 15.0% | 18.5% |
| Range | 14.8% | 14.5% |
| Mean | 6.4% | 7.8% |
| Median | 6.4% | 6.6% |
| Interquartile 25% (IQ1) | 5.3% | 5.9% |
| Interquartile 75% (IQ3) | 7.1% | 8.3% |
| Interquartile Range (IQR) | 1.8% | 2.3% |
| Standard Deviation (Sample) | 2.8% | 3.4% |
| Standard Deviation (Population) | 2.8% | 3.3% |
Demographics Similar to Albanians and Immigrants from Panama by Disability Age 18 to 34
In terms of disability age 18 to 34, the demographic groups most similar to Albanians are Moroccan (6.4%, a difference of 0.0%), Belizean (6.4%, a difference of 0.060%), Immigrants from Latvia (6.4%, a difference of 0.17%), South American Indian (6.4%, a difference of 0.19%), and Jamaican (6.4%, a difference of 0.22%). Similarly, the demographic groups most similar to Immigrants from Panama are Immigrants from Sierra Leone (6.5%, a difference of 0.030%), Zimbabwean (6.5%, a difference of 0.060%), Inupiat (6.5%, a difference of 0.13%), Immigrants from Central America (6.5%, a difference of 0.14%), and Dominican (6.5%, a difference of 0.17%).
| Demographics | Rating | Rank | Disability Age 18 to 34 |
| Immigrants | Fiji | 87.3 /100 | #140 | Excellent 6.4% |
| Jamaicans | 86.8 /100 | #141 | Excellent 6.4% |
| South American Indians | 86.5 /100 | #142 | Excellent 6.4% |
| Immigrants | Latvia | 86.4 /100 | #143 | Excellent 6.4% |
| Albanians | 85.3 /100 | #144 | Excellent 6.4% |
| Moroccans | 85.2 /100 | #145 | Excellent 6.4% |
| Belizeans | 84.9 /100 | #146 | Excellent 6.4% |
| Immigrants | South Africa | 83.7 /100 | #147 | Excellent 6.4% |
| Immigrants | Belgium | 83.5 /100 | #148 | Excellent 6.4% |
| Hondurans | 83.1 /100 | #149 | Excellent 6.4% |
| Immigrants | Dominican Republic | 82.7 /100 | #150 | Excellent 6.4% |
| Tongans | 81.9 /100 | #151 | Excellent 6.4% |
| Bulgarians | 78.3 /100 | #152 | Good 6.5% |
| Immigrants | Eritrea | 77.4 /100 | #153 | Good 6.5% |
| Immigrants | Central America | 76.8 /100 | #154 | Good 6.5% |
| Inupiat | 76.7 /100 | #155 | Good 6.5% |
| Immigrants | Panama | 75.3 /100 | #156 | Good 6.5% |
| Immigrants | Sierra Leone | 75.0 /100 | #157 | Good 6.5% |
| Zimbabweans | 74.7 /100 | #158 | Good 6.5% |
| Dominicans | 73.6 /100 | #159 | Good 6.5% |
| Immigrants | Southern Europe | 72.5 /100 | #160 | Good 6.5% |