Mexican American Indian vs Alsatian Disability Age Over 75
COMPARE
Mexican American Indian
Alsatian
Disability Age Over 75
Disability Age Over 75 Comparison
Mexican American Indians
Alsatians
50.0%
DISABILITY AGE OVER 75
0.0/ 100
METRIC RATING
296th/ 347
METRIC RANK
47.3%
DISABILITY AGE OVER 75
51.9/ 100
METRIC RATING
173rd/ 347
METRIC RANK
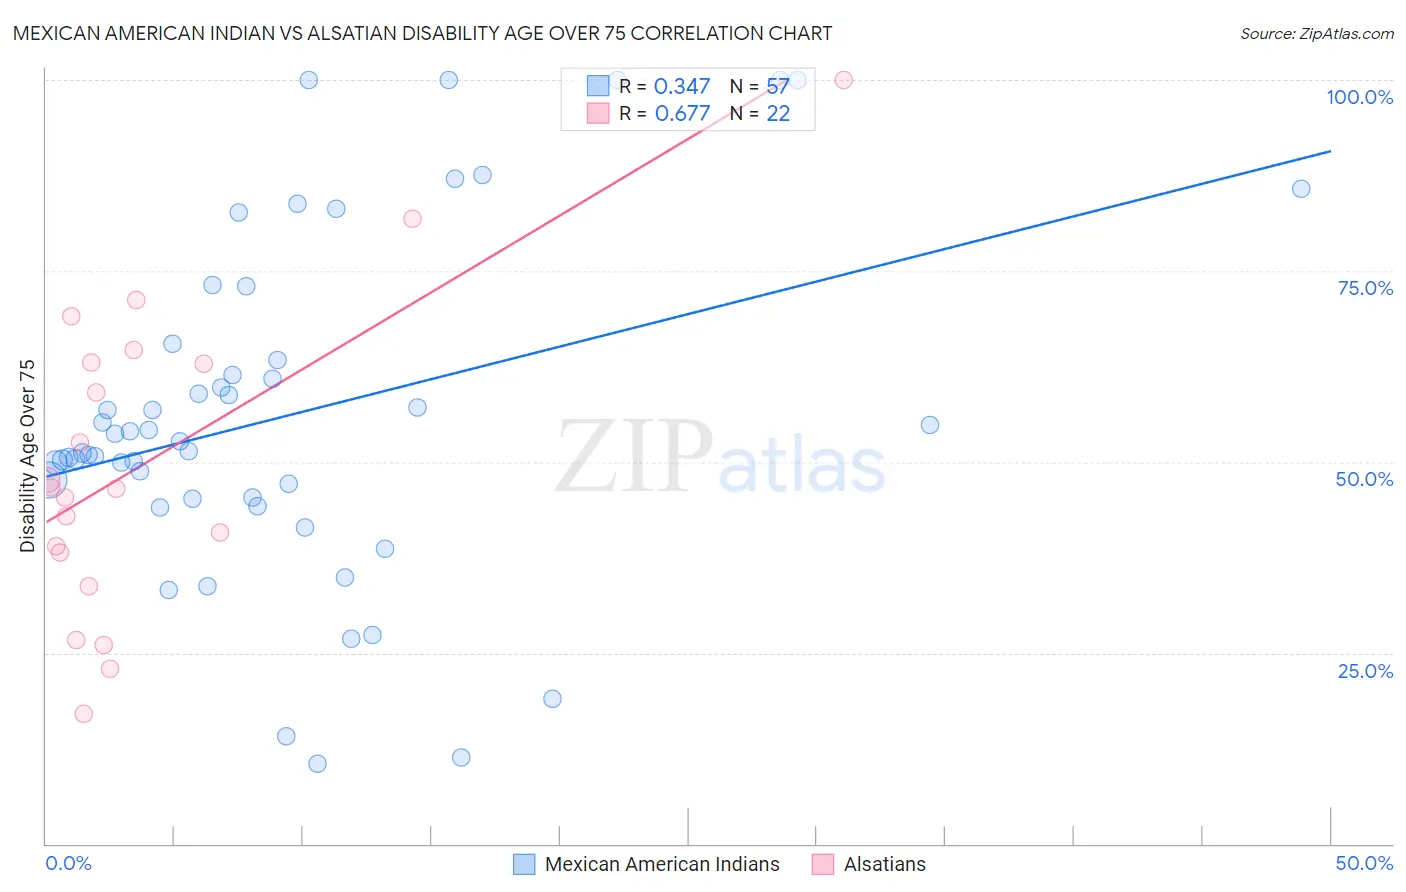
Mexican American Indian vs Alsatian Disability Age Over 75 Correlation Chart
The statistical analysis conducted on geographies consisting of 317,150,368 people shows a mild positive correlation between the proportion of Mexican American Indians and percentage of population with a disability over the age of 75 in the United States with a correlation coefficient (R) of 0.347 and weighted average of 50.0%. Similarly, the statistical analysis conducted on geographies consisting of 82,676,036 people shows a significant positive correlation between the proportion of Alsatians and percentage of population with a disability over the age of 75 in the United States with a correlation coefficient (R) of 0.677 and weighted average of 47.3%, a difference of 5.7%.
Disability Age Over 75 Correlation Summary
| Measurement | Mexican American Indian | Alsatian |
| Minimum | 10.4% | 17.1% |
| Maximum | 100.0% | 100.0% |
| Range | 89.6% | 82.9% |
| Mean | 56.1% | 49.9% |
| Median | 52.7% | 46.6% |
| Interquartile 25% (IQ1) | 45.2% | 38.2% |
| Interquartile 75% (IQ3) | 64.4% | 63.0% |
| Interquartile Range (IQR) | 19.2% | 24.8% |
| Standard Deviation (Sample) | 22.1% | 20.2% |
| Standard Deviation (Population) | 21.9% | 19.8% |
Similar Demographics by Disability Age Over 75
Demographics Similar to Mexican American Indians by Disability Age Over 75
In terms of disability age over 75, the demographic groups most similar to Mexican American Indians are Armenian (50.0%, a difference of 0.030%), Spanish American (50.0%, a difference of 0.040%), Immigrants from Cambodia (50.0%, a difference of 0.080%), Marshallese (50.1%, a difference of 0.080%), and Immigrants from Micronesia (50.1%, a difference of 0.15%).
| Demographics | Rating | Rank | Disability Age Over 75 |
| Osage | 0.0 /100 | #289 | Tragic 49.8% |
| Puget Sound Salish | 0.0 /100 | #290 | Tragic 49.8% |
| Arapaho | 0.0 /100 | #291 | Tragic 49.8% |
| Shoshone | 0.0 /100 | #292 | Tragic 49.9% |
| Spanish American Indians | 0.0 /100 | #293 | Tragic 49.9% |
| Immigrants | Cambodia | 0.0 /100 | #294 | Tragic 50.0% |
| Spanish Americans | 0.0 /100 | #295 | Tragic 50.0% |
| Mexican American Indians | 0.0 /100 | #296 | Tragic 50.0% |
| Armenians | 0.0 /100 | #297 | Tragic 50.0% |
| Marshallese | 0.0 /100 | #298 | Tragic 50.1% |
| Immigrants | Micronesia | 0.0 /100 | #299 | Tragic 50.1% |
| Cape Verdeans | 0.0 /100 | #300 | Tragic 50.1% |
| Dominicans | 0.0 /100 | #301 | Tragic 50.2% |
| Cherokee | 0.0 /100 | #302 | Tragic 50.2% |
| Japanese | 0.0 /100 | #303 | Tragic 50.2% |
Demographics Similar to Alsatians by Disability Age Over 75
In terms of disability age over 75, the demographic groups most similar to Alsatians are Scotch-Irish (47.3%, a difference of 0.010%), Immigrants from Africa (47.3%, a difference of 0.040%), White/Caucasian (47.3%, a difference of 0.040%), Immigrants from Haiti (47.3%, a difference of 0.050%), and German Russian (47.3%, a difference of 0.10%).
| Demographics | Rating | Rank | Disability Age Over 75 |
| Immigrants | Sierra Leone | 64.4 /100 | #166 | Good 47.2% |
| Moroccans | 62.9 /100 | #167 | Good 47.2% |
| Kenyans | 58.8 /100 | #168 | Average 47.2% |
| Celtics | 58.7 /100 | #169 | Average 47.2% |
| German Russians | 56.2 /100 | #170 | Average 47.3% |
| Immigrants | Africa | 53.6 /100 | #171 | Average 47.3% |
| Scotch-Irish | 52.5 /100 | #172 | Average 47.3% |
| Alsatians | 51.9 /100 | #173 | Average 47.3% |
| Whites/Caucasians | 50.0 /100 | #174 | Average 47.3% |
| Immigrants | Haiti | 49.7 /100 | #175 | Average 47.3% |
| Ecuadorians | 46.7 /100 | #176 | Average 47.4% |
| Haitians | 44.6 /100 | #177 | Average 47.4% |
| Cubans | 42.1 /100 | #178 | Average 47.4% |
| Sierra Leoneans | 41.7 /100 | #179 | Average 47.4% |
| Immigrants | Ecuador | 41.7 /100 | #180 | Average 47.4% |