Zip Codes with the Highest Percentage of Households Heated by Bottled Gas / Liquid Propane in Jonesboro, AR
RELATED REPORTS & OPTIONS
Bottled Gas / LP Heating
Jonesboro
Compare Zip Codes
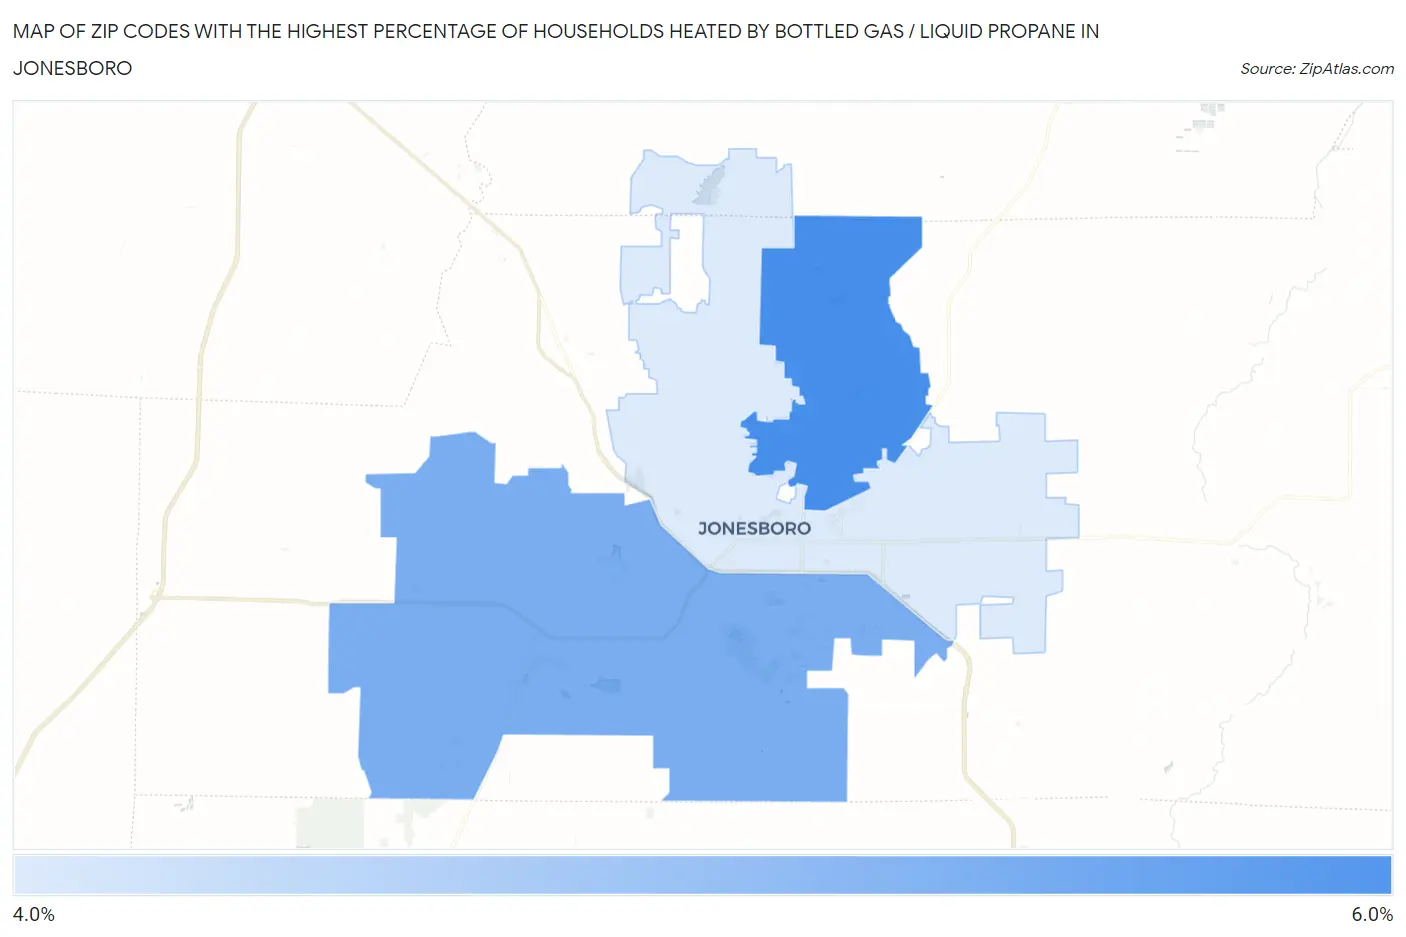
Map of Zip Codes with the Highest Percentage of Households Heated by Bottled Gas / Liquid Propane in Jonesboro
4.5%
5.1%
Zip Codes with the Highest Percentage of Households Heated by Bottled Gas / Liquid Propane in Jonesboro, AR
| Zip Code | Bottled Gas / LP Heating | vs State | vs National | |
| 1. | 72405 | 5.1% | 6.5%(-1.40)#384 | 4.9%(+0.200)#18,417 |
| 2. | 72404 | 4.9% | 6.5%(-1.60)#389 | 4.9%(=0.000)#18,622 |
| 3. | 72401 | 4.5% | 6.5%(-2.00)#396 | 4.9%(-0.400)#19,058 |
1
Common Questions
What are the Top Zip Codes with the Highest Percentage of Households Heated by Bottled Gas / Liquid Propane in Jonesboro, AR?
Top Zip Codes with the Highest Percentage of Households Heated by Bottled Gas / Liquid Propane in Jonesboro, AR are:
What zip code has the Highest Percentage of Households Heated by Bottled Gas / Liquid Propane in Jonesboro, AR?
72405 has the Highest Percentage of Households Heated by Bottled Gas / Liquid Propane in Jonesboro, AR with 5.1%.
What is the Percentage of Households Heated by Bottled Gas / Liquid Propane in Jonesboro, AR?
Percentage of Households Heated by Bottled Gas / Liquid Propane in Jonesboro is 2.2%.
What is the Percentage of Households Heated by Bottled Gas / Liquid Propane in Arkansas?
Percentage of Households Heated by Bottled Gas / Liquid Propane in Arkansas is 6.5%.
What is the Percentage of Households Heated by Bottled Gas / Liquid Propane in the United States?
Percentage of Households Heated by Bottled Gas / Liquid Propane in the United States is 4.9%.