Zip Codes with the Highest Percentage of Households Without a Vehicle in Huntsville, AL
RELATED REPORTS & OPTIONS
Households without a Cars
Huntsville
Compare Zip Codes
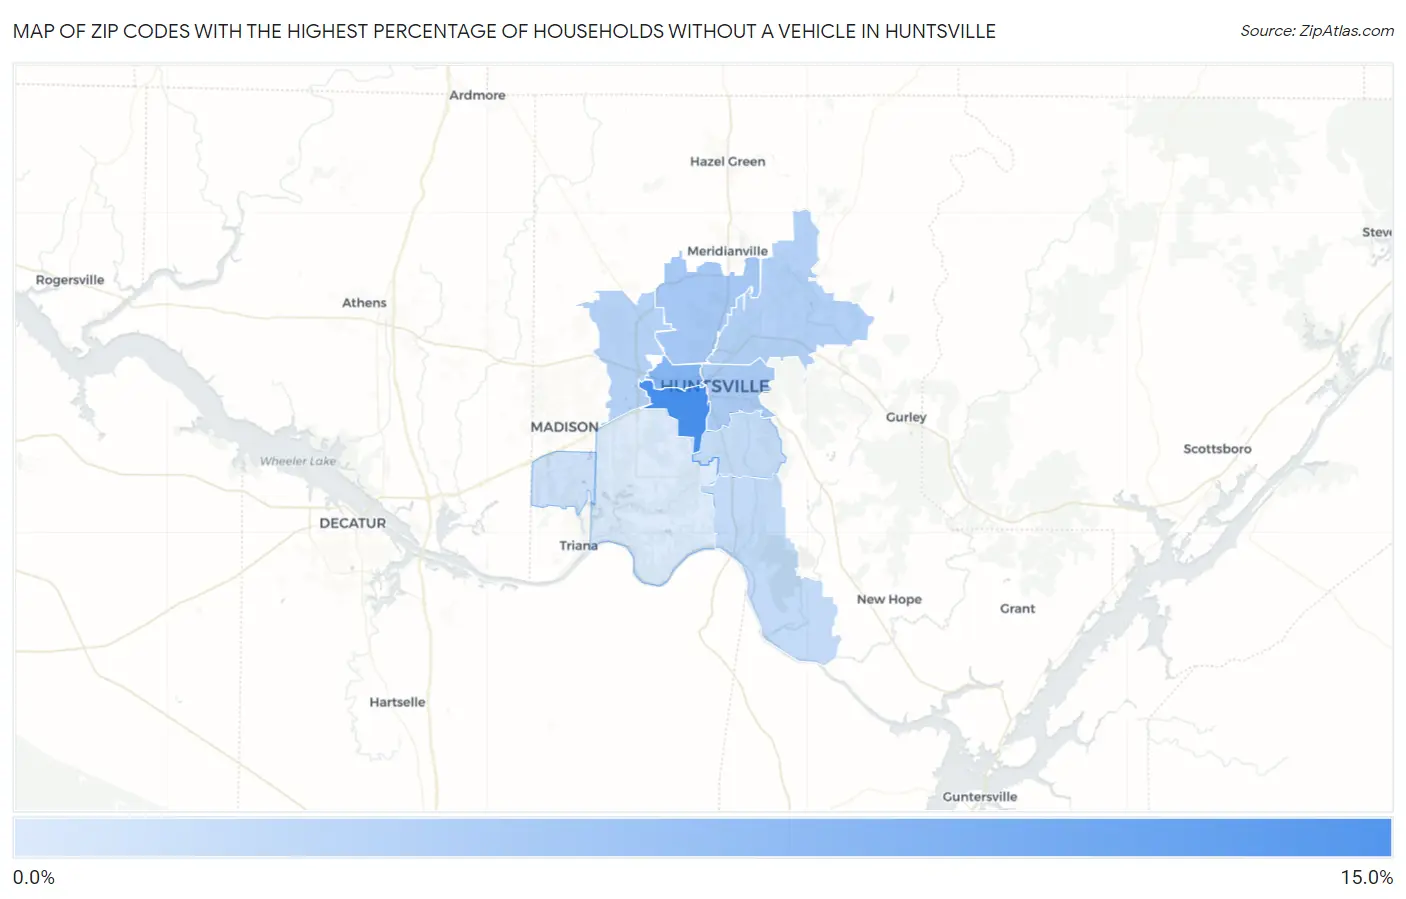
Map of Zip Codes with the Highest Percentage of Households Without a Vehicle in Huntsville
1.0%
14.2%
Zip Codes with the Highest Percentage of Households Without a Vehicle in Huntsville, AL
| Zip Code | Housholds Without a Car | vs State | vs National | |
| 1. | 35805 | 14.2% | 5.6%(+8.60)#59 | 8.3%(+5.90)#2,628 |
| 2. | 35816 | 8.5% | 5.6%(+2.90)#132 | 8.3%(+0.200)#6,337 |
| 3. | 35810 | 5.7% | 5.6%(+0.100)#214 | 8.3%(-2.60)#11,123 |
| 4. | 35801 | 5.1% | 5.6%(-0.500)#247 | 8.3%(-3.20)#12,628 |
| 5. | 35811 | 4.5% | 5.6%(-1.10)#285 | 8.3%(-3.80)#14,197 |
| 6. | 35806 | 4.2% | 5.6%(-1.40)#307 | 8.3%(-4.10)#15,125 |
| 7. | 35803 | 3.2% | 5.6%(-2.40)#364 | 8.3%(-5.10)#18,350 |
| 8. | 35802 | 2.9% | 5.6%(-2.70)#402 | 8.3%(-5.40)#19,426 |
| 9. | 35824 | 2.2% | 5.6%(-3.40)#453 | 8.3%(-6.10)#21,804 |
| 10. | 35808 | 1.0% | 5.6%(-4.60)#524 | 8.3%(-7.30)#25,775 |
1
Common Questions
What are the Top 5 Zip Codes with the Highest Percentage of Households Without a Vehicle in Huntsville, AL?
Top 5 Zip Codes with the Highest Percentage of Households Without a Vehicle in Huntsville, AL are:
What zip code has the Highest Percentage of Households Without a Vehicle in Huntsville, AL?
35805 has the Highest Percentage of Households Without a Vehicle in Huntsville, AL with 14.2%.
What is the Percentage of Households Without a Vehicle in Huntsville, AL?
Percentage of Households Without a Vehicle in Huntsville is 5.1%.
What is the Percentage of Households Without a Vehicle in Alabama?
Percentage of Households Without a Vehicle in Alabama is 5.6%.
What is the Percentage of Households Without a Vehicle in the United States?
Percentage of Households Without a Vehicle in the United States is 8.3%.