Immigrants from Honduras vs Welsh 4 or more Vehicles in Household

COMPARE

Immigrants from Honduras
Race
Ancestry
AfghanAfricanAlaska NativeAlaskan AthabascanAlbanianAleutAlsatianAmericanApacheArabArapahoArgentineanArmenianAssyrian/Chaldean/SyriacAustralianAustrianBahamianBangladeshiBarbadianBasqueBelgianBelizeanBermudanBhutaneseBlackfeetBolivianBrazilianBritishBritish West IndianBulgarianBurmeseCajunCambodianCanadianCape VerdeanCarpatho RusynCelticCentral AmericanCentral American IndianCherokeeCheyenneChickasawChileanChineseChippewaChoctawColombianColvilleComancheCosta RicanCreeCreekCroatianCrowCubanCypriotCzechCzechoslovakianDanishDelawareDominicanDutchDutch West IndianEastern EuropeanEcuadorianEgyptianEnglishEstonianEthiopianEuropeanFijianFilipinoFinnishFrenchFrench American IndianFrench CanadianGermanGerman RussianGhanaianGreekGuamanian/ChamorroGuatemalanGuyaneseHaitianHmongHonduranHopiHoumaHungarianIcelanderIndian (Asian)IndonesianInupiatIranianIraqiIrishIroquoisIsraeliItalianJamaicanJapaneseJordanianKenyanKiowaKoreanLaotianLatvianLebaneseLiberianLithuanianLumbeeLuxembourgerMacedonianMalaysianMalteseMarshalleseMenomineeMexicanMexican American IndianMongolianMoroccanNative HawaiianNavajoNepaleseNew ZealanderNicaraguanNigerianNorthern EuropeanNorwegianOkinawanOsageOttawaPaiutePakistaniPalestinianPanamanianParaguayanPennsylvania GermanPeruvianPimaPolishPortuguesePotawatomiPuebloPuerto RicanPuget Sound SalishRomanianRussianSalvadoranSamoanScandinavianScotch-IrishScottishSeminoleSenegaleseSerbianShoshoneSierra LeoneanSiouxSlavicSlovakSloveneSomaliSouth AfricanSouth AmericanSouth American IndianSoviet UnionSpaniardSpanishSpanish AmericanSpanish American IndianSri LankanSubsaharan AfricanSudaneseSwedishSwissSyrianTaiwaneseThaiTlingit-HaidaTohono O'OdhamTonganTrinidadian and TobagonianTsimshianTurkishU.S. Virgin IslanderUgandanUkrainianUruguayanUteVenezuelanVietnameseWest IndianYakamaYaquiYugoslavianYumanYup'ikZimbabwean
Immigration
NonimmigrantsImmigrantsAfghanistanAfricaAlbaniaArgentinaArmeniaAsiaAustraliaAustriaBahamasBangladeshBarbadosBelarusBelgiumBelizeBoliviaBosnia and HerzegovinaBrazilBulgariaBurma/MyanmarCabo VerdeCambodiaCameroonCanadaCaribbeanCentral AmericaChileChinaColombiaCongoCosta RicaCroatiaCubaCzechoslovakiaDenmarkDominicaDominican RepublicEastern AfricaEastern AsiaEastern EuropeEcuadorEgyptEl SalvadorEnglandEritreaEthiopiaEuropeFijiFranceGermanyGhanaGreeceGrenadaGuatemalaGuyanaHaitiHondurasHong KongHungaryIndiaIndonesiaIranIraqIrelandIsraelItalyJamaicaJapanJordanKazakhstanKenyaKoreaKuwaitLaosLatin AmericaLatviaLebanonLiberiaLithuaniaMalaysiaMexicoMicronesiaMiddle AfricaMoldovaMoroccoNepalNetherlandsNicaraguaNigeriaNorth AmericaNorth MacedoniaNorthern AfricaNorthern EuropeNorwayOceaniaPakistanPanamaPeruPhilippinesPolandPortugalRomaniaRussiaSaudi ArabiaScotlandSenegalSerbiaSierra LeoneSingaporeSomaliaSouth AfricaSouth AmericaSouth Central AsiaSouth Eastern AsiaSouthern EuropeSpainSri LankaSt. Vincent and the GrenadinesSudanSwedenSwitzerlandSyriaTaiwanThailandTrinidad and TobagoTurkeyUgandaUkraineUruguayUzbekistanVenezuelaVietnamWest IndiesWestern AfricaWestern AsiaWestern EuropeYemenZaireZimbabweAzores
Welsh
Race
Ancestry
AfghanAfricanAlaska NativeAlaskan AthabascanAlbanianAleutAlsatianAmericanApacheArabArapahoArgentineanArmenianAssyrian/Chaldean/SyriacAustralianAustrianBahamianBangladeshiBarbadianBasqueBelgianBelizeanBermudanBhutaneseBlackfeetBolivianBrazilianBritishBritish West IndianBulgarianBurmeseCajunCambodianCanadianCape VerdeanCarpatho RusynCelticCentral AmericanCentral American IndianCherokeeCheyenneChickasawChileanChineseChippewaChoctawColombianColvilleComancheCosta RicanCreeCreekCroatianCrowCubanCypriotCzechCzechoslovakianDanishDelawareDominicanDutchDutch West IndianEastern EuropeanEcuadorianEgyptianEnglishEstonianEthiopianEuropeanFijianFilipinoFinnishFrenchFrench American IndianFrench CanadianGermanGerman RussianGhanaianGreekGuamanian/ChamorroGuatemalanGuyaneseHaitianHmongHonduranHopiHoumaHungarianIcelanderIndian (Asian)IndonesianInupiatIranianIraqiIrishIroquoisIsraeliItalianJamaicanJapaneseJordanianKenyanKiowaKoreanLaotianLatvianLebaneseLiberianLithuanianLumbeeLuxembourgerMacedonianMalaysianMalteseMarshalleseMenomineeMexicanMexican American IndianMongolianMoroccanNative HawaiianNavajoNepaleseNew ZealanderNicaraguanNigerianNorthern EuropeanNorwegianOkinawanOsageOttawaPaiutePakistaniPalestinianPanamanianParaguayanPennsylvania GermanPeruvianPimaPolishPortuguesePotawatomiPuebloPuerto RicanPuget Sound SalishRomanianRussianSalvadoranSamoanScandinavianScotch-IrishScottishSeminoleSenegaleseSerbianShoshoneSierra LeoneanSiouxSlavicSlovakSloveneSomaliSouth AfricanSouth AmericanSouth American IndianSoviet UnionSpaniardSpanishSpanish AmericanSpanish American IndianSri LankanSubsaharan AfricanSudaneseSwedishSwissSyrianTaiwaneseThaiTlingit-HaidaTohono O'OdhamTonganTrinidadian and TobagonianTsimshianTurkishU.S. Virgin IslanderUgandanUkrainianUruguayanUteVenezuelanVietnameseWelshWest IndianYakamaYaquiYugoslavianYumanYup'ikZimbabwean
Immigration
NonimmigrantsImmigrantsAfghanistanAfricaAlbaniaArgentinaArmeniaAsiaAustraliaAustriaBahamasBangladeshBarbadosBelarusBelgiumBelizeBoliviaBosnia and HerzegovinaBrazilBulgariaBurma/MyanmarCabo VerdeCambodiaCameroonCanadaCaribbeanCentral AmericaChileChinaColombiaCongoCosta RicaCroatiaCubaCzechoslovakiaDenmarkDominicaDominican RepublicEastern AfricaEastern AsiaEastern EuropeEcuadorEgyptEl SalvadorEnglandEritreaEthiopiaEuropeFijiFranceGermanyGhanaGreeceGrenadaGuatemalaGuyanaHaitiHong KongHungaryIndiaIndonesiaIranIraqIrelandIsraelItalyJamaicaJapanJordanKazakhstanKenyaKoreaKuwaitLaosLatin AmericaLatviaLebanonLiberiaLithuaniaMalaysiaMexicoMicronesiaMiddle AfricaMoldovaMoroccoNepalNetherlandsNicaraguaNigeriaNorth AmericaNorth MacedoniaNorthern AfricaNorthern EuropeNorwayOceaniaPakistanPanamaPeruPhilippinesPolandPortugalRomaniaRussiaSaudi ArabiaScotlandSenegalSerbiaSierra LeoneSingaporeSomaliaSouth AfricaSouth AmericaSouth Central AsiaSouth Eastern AsiaSouthern EuropeSpainSri LankaSt. Vincent and the GrenadinesSudanSwedenSwitzerlandSyriaTaiwanThailandTrinidad and TobagoTurkeyUgandaUkraineUruguayUzbekistanVenezuelaVietnamWest IndiesWestern AfricaWestern AsiaWestern EuropeYemenZaireZimbabweAzores
4 or more Vehicles in Household
Income
Poverty
Unemployment
Labor Participation
Family Structure
Vehicle Availability
Education Level
Disability

4 or more Vehicles in Household Comparison

Immigrants from Honduras

Welsh

Poor
Exceptional
6.1%
4 OR MORE VEHICLES IN HOUSEHOLD
15.4/ 100
METRIC RATING
209th/ 347
METRIC RANK
7.5%
4 OR MORE VEHICLES IN HOUSEHOLD
99.9/ 100
METRIC RATING
68th/ 347
METRIC RANK

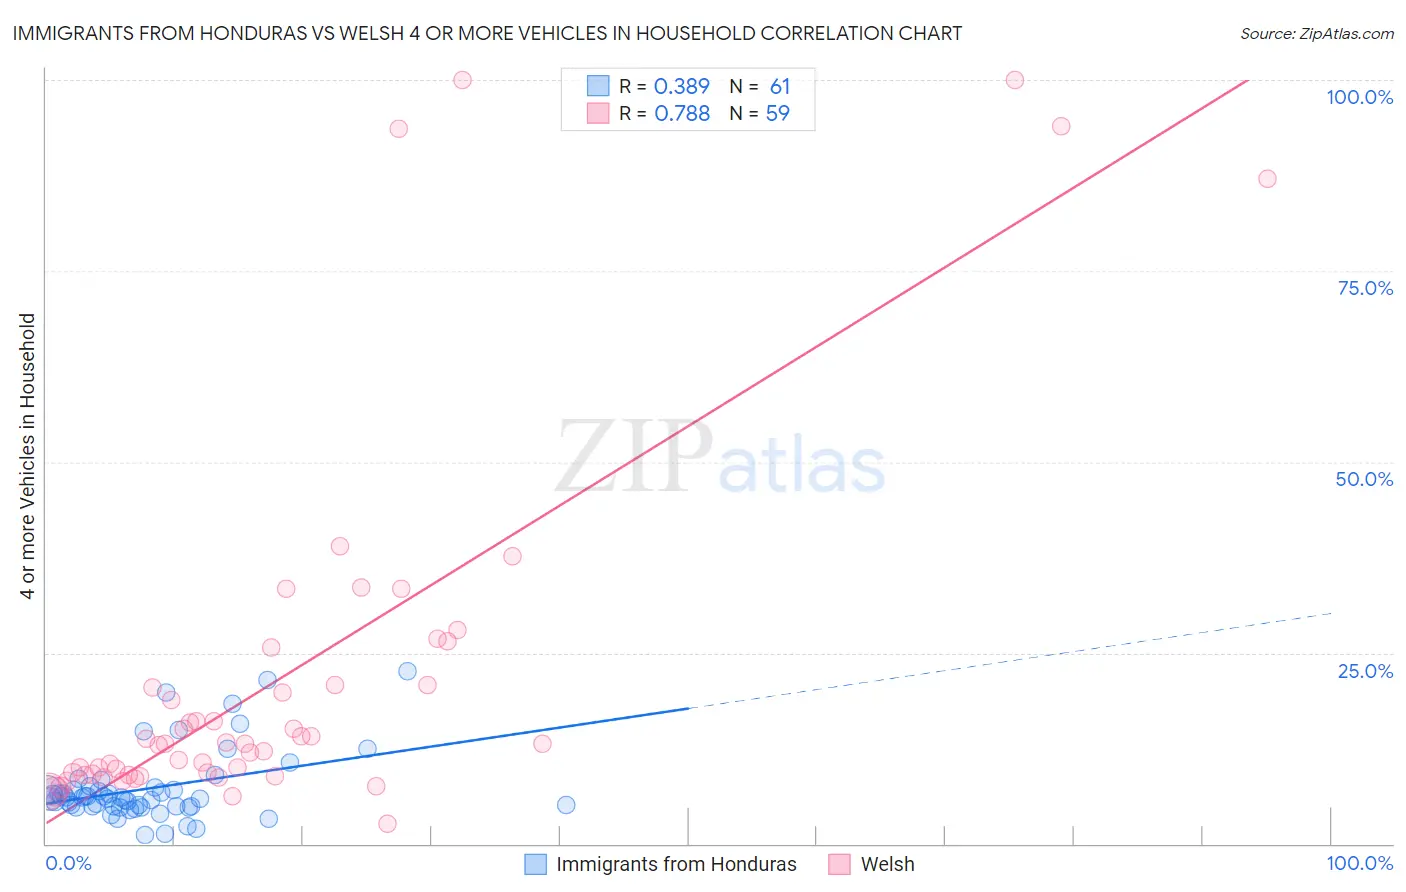
Immigrants from Honduras vs Welsh 4 or more Vehicles in Household Correlation Chart

The statistical analysis conducted on geographies consisting of 321,252,543 people shows a mild positive correlation between the proportion of Immigrants from Honduras and percentage of households with 4 or more vehicles available in the United States with a correlation coefficient (R) of 0.389 and weighted average of 6.1%. Similarly, the statistical analysis conducted on geographies consisting of 526,008,670 people shows a strong positive correlation between the proportion of Welsh and percentage of households with 4 or more vehicles available in the United States with a correlation coefficient (R) of 0.788 and weighted average of 7.5%, a difference of 23.8%.
Immigrants from Honduras vs Welsh 4 or more Vehicles in Household

4 or more Vehicles in Household Correlation Summary

MeasurementImmigrants from HondurasWelsh
Minimum1.1%2.6%
Maximum22.6%100.0%
Range21.5%97.4%
Mean7.3%21.8%
Median6.1%13.1%
Interquartile 25% (IQ1)4.9%9.1%
Interquartile 75% (IQ3)7.2%20.8%
Interquartile Range (IQR)2.3%11.8%
Standard Deviation (Sample)4.6%24.0%
Standard Deviation (Population)4.6%23.8%

Similar Demographics by 4 or more Vehicles in Household

Demographics Similar to Immigrants from Honduras by 4 or more Vehicles in Household

In terms of 4 or more vehicles in household, the demographic groups most similar to Immigrants from Honduras are Immigrants from Nigeria (6.1%, a difference of 0.030%), Immigrants from Zimbabwe (6.0%, a difference of 0.050%), Panamanian (6.0%, a difference of 0.13%), Immigrants from Egypt (6.0%, a difference of 0.15%), and Arab (6.0%, a difference of 0.21%).
DemographicsRating | Rank4 or more Vehicles in Household
Immigrants | South Central Asia
21.3
/100
|
#202
Fair
6.1%
Immigrants | Sierra Leone
20.5
/100
|
#203
Fair
6.1%
Immigrants | Belize
19.8
/100
|
#204
Poor
6.1%
Hondurans
19.3
/100
|
#205
Poor
6.1%
Kenyans
18.5
/100
|
#206
Poor
6.1%
Immigrants | Chile
16.9
/100
|
#207
Poor
6.1%
Immigrants | Nigeria
15.6
/100
|
#208
Poor
6.1%
Immigrants | Honduras
15.4
/100
|
#209
Poor
6.1%
Immigrants | Zimbabwe
15.1
/100
|
#210
Poor
6.0%
Panamanians
14.8
/100
|
#211
Poor
6.0%
Immigrants | Egypt
14.7
/100
|
#212
Poor
6.0%
Arabs
14.4
/100
|
#213
Poor
6.0%
Immigrants | Austria
14.3
/100
|
#214
Poor
6.0%
Immigrants | China
13.8
/100
|
#215
Poor
6.0%
Immigrants | Romania
13.8
/100
|
#216
Poor
6.0%

Demographics Similar to Welsh by 4 or more Vehicles in Household

In terms of 4 or more vehicles in household, the demographic groups most similar to Welsh are American (7.5%, a difference of 0.36%), Immigrants from Taiwan (7.5%, a difference of 0.37%), German (7.5%, a difference of 0.59%), Scottish (7.4%, a difference of 0.67%), and Immigrants from the Azores (7.5%, a difference of 0.70%).
DemographicsRating | Rank4 or more Vehicles in Household
Europeans
100.0
/100
|
#61
Exceptional
7.6%
Chippewa
100.0
/100
|
#62
Exceptional
7.6%
Immigrants | Micronesia
100.0
/100
|
#63
Exceptional
7.6%
Bangladeshis
100.0
/100
|
#64
Exceptional
7.6%
Immigrants | Azores
100.0
/100
|
#65
Exceptional
7.5%
Immigrants | Taiwan
99.9
/100
|
#66
Exceptional
7.5%
Americans
99.9
/100
|
#67
Exceptional
7.5%
Welsh
99.9
/100
|
#68
Exceptional
7.5%
Germans
99.9
/100
|
#69
Exceptional
7.5%
Scottish
99.9
/100
|
#70
Exceptional
7.4%
Chickasaw
99.9
/100
|
#71
Exceptional
7.4%
Scotch-Irish
99.9
/100
|
#72
Exceptional
7.4%
Portuguese
99.9
/100
|
#73
Exceptional
7.4%
Icelanders
99.9
/100
|
#74
Exceptional
7.4%
Immigrants | Cambodia
99.9
/100
|
#75
Exceptional
7.4%