Finnish Receiving Food Stamps
COMPARE
Finnish
Select to Compare
Receiving Food Stamps
Finnish Receiving Food Stamps
10.2%
PUBLIC INCOME | FOOD STAMPS
97.9/ 100
METRIC RATING
90th/ 347
METRIC RANK
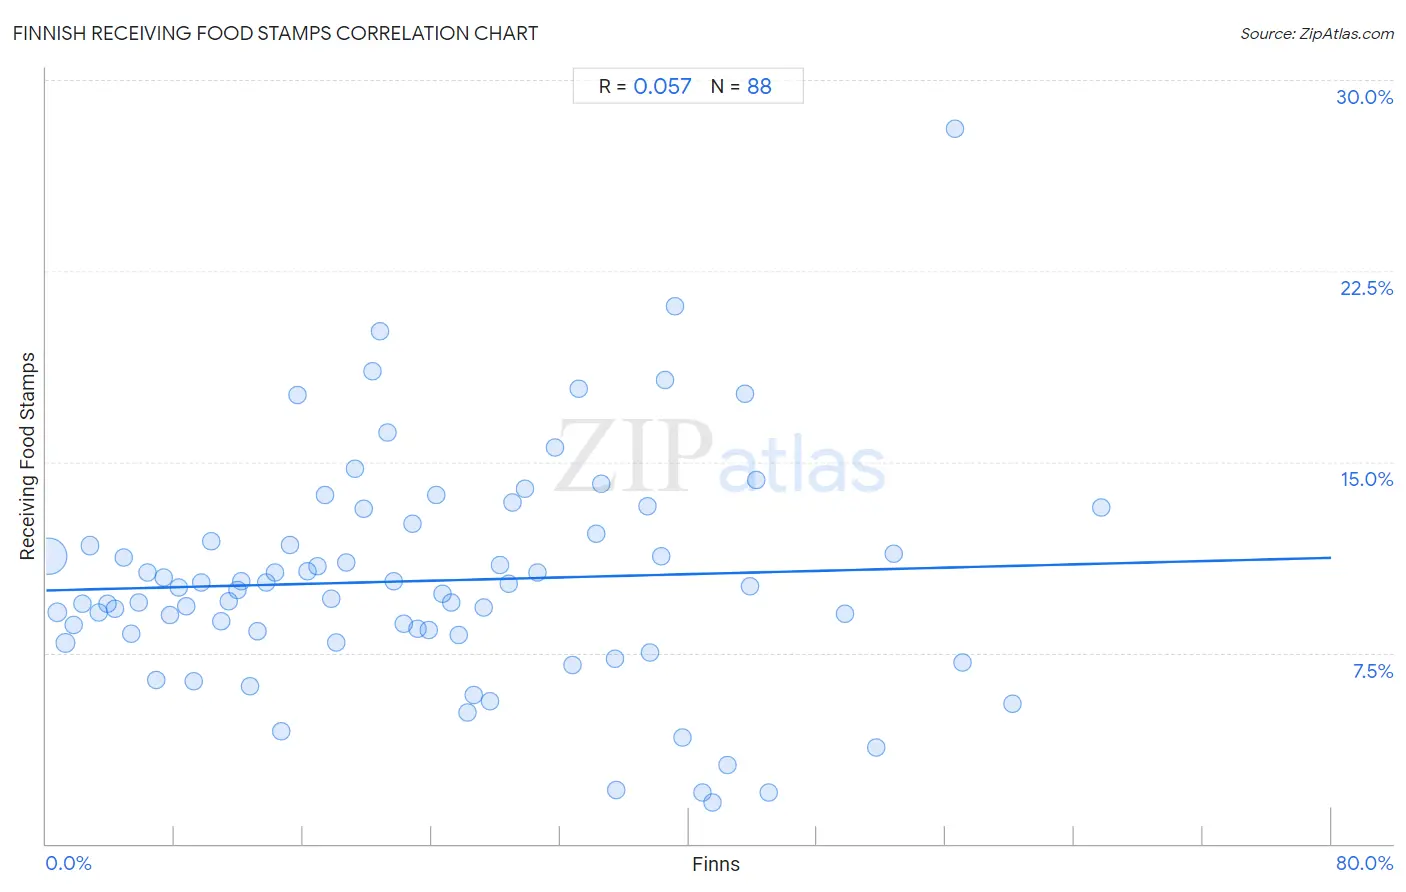
Finnish Receiving Food Stamps Correlation Chart
The statistical analysis conducted on geographies consisting of 403,543,220 people shows a slight positive correlation between the proportion of Finns and percentage of population receiving government assistance and/or food stamps in the United States with a correlation coefficient (R) of 0.057 and weighted average of 10.2%. On average, for every 1% (one percent) increase in Finns within a typical geography, there is an increase of 0.016% in percentage of population receiving government assistance and/or food stamps.
It is essential to understand that the correlation between the percentage of Finns and percentage of population receiving government assistance and/or food stamps does not imply a direct cause-and-effect relationship. It remains uncertain whether the presence of Finns influences an upward or downward trend in the level of percentage of population receiving government assistance and/or food stamps within an area, or if Finns simply ended up residing in those areas with higher or lower levels of percentage of population receiving government assistance and/or food stamps due to other factors.
Demographics Similar to Finns by Receiving Food Stamps
In terms of receiving food stamps, the demographic groups most similar to Finns are Jordanian (10.2%, a difference of 0.040%), Irish (10.2%, a difference of 0.040%), Belgian (10.2%, a difference of 0.42%), Immigrants from France (10.1%, a difference of 0.85%), and Immigrants from Greece (10.3%, a difference of 0.95%).
| Demographics | Rating | Rank | Receiving Food Stamps |
| Dutch | 98.6 /100 | #83 | Exceptional 10.0% |
| Immigrants from Israel | 98.5 /100 | #84 | Exceptional 10.0% |
| Immigrants from Romania | 98.5 /100 | #85 | Exceptional 10.0% |
| Immigrants from Norway | 98.4 /100 | #86 | Exceptional 10.0% |
| Egyptians | 98.4 /100 | #87 | Exceptional 10.0% |
| Immigrants from Kuwait | 98.4 /100 | #88 | Exceptional 10.0% |
| Immigrants from France | 98.3 /100 | #89 | Exceptional 10.1% |
| Finns | 97.9 /100 | #90 | Exceptional 10.2% |
| Jordanians | 97.9 /100 | #91 | Exceptional 10.2% |
| Irish | 97.9 /100 | #92 | Exceptional 10.2% |
| Belgians | 97.7 /100 | #93 | Exceptional 10.2% |
| Immigrants from Greece | 97.4 /100 | #94 | Exceptional 10.3% |
| Basques | 97.4 /100 | #95 | Exceptional 10.3% |
| Welsh | 97.3 /100 | #96 | Exceptional 10.3% |
| Czechoslovakians | 97.2 /100 | #97 | Exceptional 10.3% |
Finnish Receiving Food Stamps Correlation Summary
| Measurement | Finnish Data | Receiving Food Stamps Data |
| Minimum | 0.14% | 1.6% |
| Maximum | 65.7% | 28.1% |
| Range | 65.6% | 26.5% |
| Mean | 23.8% | 10.3% |
| Median | 22.0% | 10.0% |
| Interquartile 25% (IQ1) | 11.1% | 8.2% |
| Interquartile 75% (IQ3) | 35.0% | 12.0% |
| Interquartile Range (IQR) | 23.9% | 3.8% |
| Standard Deviation (Sample) | 15.7% | 4.4% |
| Standard Deviation (Population) | 15.6% | 4.4% |
Correlation Details
| Finnish Percentile | Sample Size | Receiving Food Stamps |
[ 0.0% - 0.5% ] 0.14% | 357,034,480 | 11.3% |
[ 0.5% - 1.0% ] 0.68% | 31,611,729 | 9.1% |
[ 1.0% - 1.5% ] 1.20% | 8,150,573 | 7.9% |
[ 1.5% - 2.0% ] 1.70% | 2,708,700 | 8.6% |
[ 2.0% - 2.5% ] 2.24% | 1,171,667 | 9.4% |
[ 2.5% - 3.0% ] 2.75% | 601,665 | 11.7% |
[ 3.0% - 3.5% ] 3.25% | 478,980 | 9.1% |
[ 3.5% - 4.0% ] 3.79% | 172,648 | 9.4% |
[ 4.0% - 4.5% ] 4.25% | 256,676 | 9.2% |
[ 4.5% - 5.0% ] 4.79% | 94,220 | 11.3% |
[ 5.0% - 5.5% ] 5.30% | 86,142 | 8.2% |
[ 5.5% - 6.0% ] 5.79% | 144,704 | 9.5% |
[ 6.0% - 6.5% ] 6.28% | 177,032 | 10.7% |
[ 6.5% - 7.0% ] 6.81% | 78,369 | 6.4% |
[ 7.0% - 7.5% ] 7.30% | 72,937 | 10.4% |
[ 7.5% - 8.0% ] 7.74% | 34,827 | 9.0% |
[ 8.0% - 8.5% ] 8.26% | 37,767 | 10.1% |
[ 8.5% - 9.0% ] 8.68% | 55,328 | 9.3% |
[ 9.0% - 9.5% ] 9.21% | 38,656 | 6.4% |
[ 9.5% - 10.0% ] 9.62% | 29,933 | 10.3% |
[ 10.0% - 10.5% ] 10.30% | 33,515 | 11.9% |
[ 10.5% - 11.0% ] 10.87% | 70,394 | 8.8% |
[ 11.0% - 11.5% ] 11.36% | 35,872 | 9.5% |
[ 11.5% - 12.0% ] 11.92% | 48,712 | 10.0% |
[ 12.0% - 12.5% ] 12.17% | 26,915 | 10.3% |
[ 12.5% - 13.0% ] 12.66% | 18,324 | 6.2% |
[ 13.0% - 13.5% ] 13.18% | 10,733 | 8.4% |
[ 13.5% - 14.0% ] 13.68% | 9,138 | 10.3% |
[ 14.0% - 14.5% ] 14.27% | 14,613 | 10.6% |
[ 14.5% - 15.0% ] 14.62% | 12,405 | 4.4% |
[ 15.0% - 15.5% ] 15.18% | 5,750 | 11.7% |
[ 15.5% - 16.0% ] 15.68% | 2,730 | 17.6% |
[ 16.0% - 16.5% ] 16.29% | 4,009 | 10.7% |
[ 16.5% - 17.0% ] 16.88% | 10,266 | 10.9% |
[ 17.0% - 17.5% ] 17.33% | 13,116 | 13.7% |
[ 17.5% - 18.0% ] 17.73% | 11,318 | 9.6% |
[ 18.0% - 18.5% ] 18.09% | 8,089 | 7.9% |
[ 18.5% - 19.0% ] 18.67% | 4,194 | 11.1% |
[ 19.0% - 19.5% ] 19.20% | 14,269 | 14.7% |
[ 19.5% - 20.0% ] 19.75% | 8,465 | 13.1% |
[ 20.0% - 20.5% ] 20.29% | 12,833 | 18.6% |
[ 20.5% - 21.0% ] 20.81% | 10,004 | 20.1% |
[ 21.0% - 21.5% ] 21.28% | 7,553 | 16.2% |
[ 21.5% - 22.0% ] 21.65% | 194 | 10.3% |
[ 22.0% - 22.5% ] 22.27% | 7,975 | 8.6% |
[ 22.5% - 23.0% ] 22.78% | 3,200 | 12.6% |
[ 23.0% - 23.5% ] 23.13% | 2,309 | 8.5% |
[ 23.5% - 24.0% ] 23.81% | 11,265 | 8.4% |
[ 24.0% - 24.5% ] 24.29% | 2,697 | 13.7% |
[ 24.5% - 25.0% ] 24.70% | 19,575 | 9.8% |
[ 25.0% - 25.5% ] 25.25% | 5,121 | 9.5% |
[ 25.5% - 26.0% ] 25.70% | 2,673 | 8.2% |
[ 26.0% - 26.5% ] 26.23% | 1,403 | 5.2% |
[ 26.5% - 27.0% ] 26.64% | 9,910 | 5.8% |
[ 27.0% - 27.5% ] 27.26% | 2,781 | 9.3% |
[ 27.5% - 28.0% ] 27.64% | 2,713 | 5.6% |
[ 28.0% - 28.5% ] 28.23% | 889 | 10.9% |
[ 28.5% - 29.0% ] 28.76% | 3,477 | 10.2% |
[ 29.0% - 29.5% ] 29.06% | 2,780 | 13.4% |
[ 29.5% - 30.0% ] 29.83% | 10,680 | 14.0% |
[ 30.5% - 31.0% ] 30.59% | 706 | 10.7% |
[ 31.5% - 32.0% ] 31.67% | 300 | 15.6% |
[ 32.5% - 33.0% ] 32.76% | 7,945 | 7.0% |
[ 33.0% - 33.5% ] 33.11% | 1,063 | 17.9% |
[ 34.0% - 34.5% ] 34.27% | 356 | 12.2% |
[ 34.5% - 35.0% ] 34.55% | 301 | 14.1% |
[ 35.0% - 35.5% ] 35.39% | 1,003 | 7.3% |
[ 35.5% - 36.0% ] 35.51% | 780 | 2.1% |
[ 37.0% - 37.5% ] 37.40% | 1,179 | 13.3% |
[ 37.5% - 38.0% ] 37.61% | 117 | 7.5% |
[ 38.0% - 38.5% ] 38.28% | 1,382 | 11.3% |
[ 38.5% - 39.0% ] 38.51% | 509 | 18.2% |
[ 39.0% - 39.5% ] 39.13% | 69 | 21.1% |
[ 39.5% - 40.0% ] 39.59% | 1,109 | 4.2% |
[ 40.5% - 41.0% ] 40.86% | 257 | 2.0% |
[ 41.0% - 41.5% ] 41.47% | 516 | 1.6% |
[ 42.0% - 42.5% ] 42.40% | 1,198 | 3.1% |
[ 43.0% - 43.5% ] 43.49% | 499 | 17.7% |
[ 43.5% - 44.0% ] 43.78% | 201 | 10.1% |
[ 44.0% - 44.5% ] 44.23% | 312 | 14.3% |
[ 44.5% - 45.0% ] 44.95% | 109 | 2.0% |
[ 49.5% - 50.0% ] 49.75% | 396 | 9.0% |
[ 51.5% - 52.0% ] 51.65% | 273 | 3.8% |
[ 52.5% - 53.0% ] 52.80% | 2,072 | 11.4% |
[ 56.5% - 57.0% ] 56.59% | 129 | 28.1% |
[ 57.0% - 57.5% ] 57.04% | 277 | 7.1% |
[ 60.0% - 60.5% ] 60.15% | 133 | 5.5% |
[ 65.5% - 66.0% ] 65.69% | 137 | 13.2% |