Finnish Unemployment Among Women with Children Ages 6 to 17 years
COMPARE
Finnish
Select to Compare
Unemployment Among Women with Children Ages 6 to 17 years
Finnish Unemployment Among Women with Children Ages 6 to 17 years
9.2%
UNEMPLOYMENT | WOMEN W/ CHILDREN 6 TO 17
10.0/ 100
METRIC RATING
210th/ 347
METRIC RANK
Finnish Unemployment Among Women with Children Ages 6 to 17 years Correlation Chart
The statistical analysis conducted on geographies consisting of 277,451,978 people shows a mild positive correlation between the proportion of Finns and unemployment rate among women with children between the ages 6 and 17 in the United States with a correlation coefficient (R) of 0.370 and weighted average of 9.2%. On average, for every 1% (one percent) increase in Finns within a typical geography, there is an increase of 1.2% in unemployment rate among women with children between the ages 6 and 17.
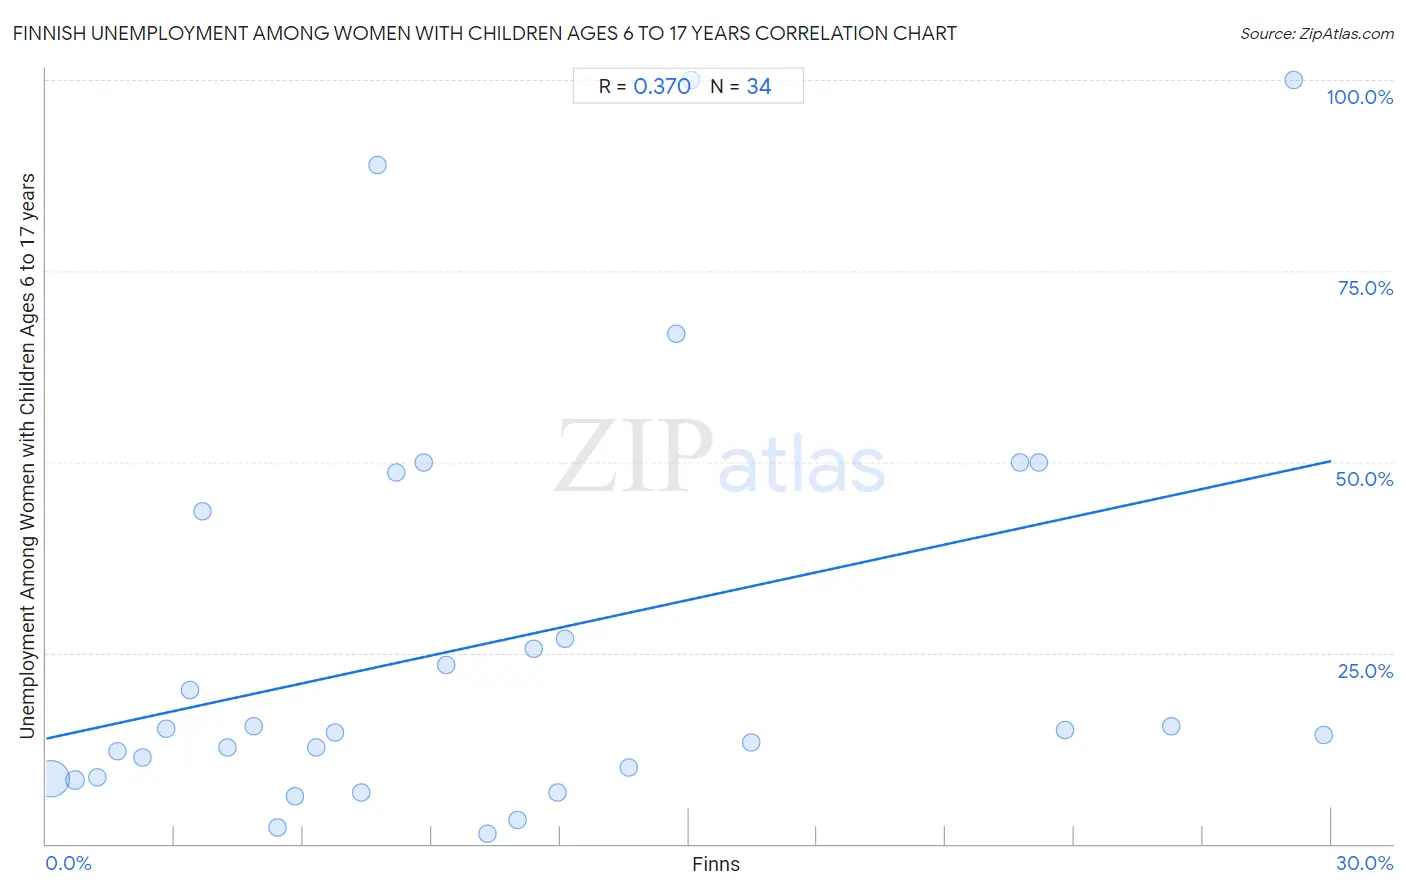
It is essential to understand that the correlation between the percentage of Finns and unemployment rate among women with children between the ages 6 and 17 does not imply a direct cause-and-effect relationship. It remains uncertain whether the presence of Finns influences an upward or downward trend in the level of unemployment rate among women with children between the ages 6 and 17 within an area, or if Finns simply ended up residing in those areas with higher or lower levels of unemployment rate among women with children between the ages 6 and 17 due to other factors.
Demographics Similar to Finns by Unemployment Among Women with Children Ages 6 to 17 years
In terms of unemployment among women with children ages 6 to 17 years, the demographic groups most similar to Finns are Immigrants from Cuba (9.2%, a difference of 0.050%), Salvadoran (9.2%, a difference of 0.090%), Cuban (9.2%, a difference of 0.10%), Immigrants from Peru (9.2%, a difference of 0.10%), and Peruvian (9.2%, a difference of 0.13%).
| Demographics | Rating | Rank | Unemployment Among Women with Children Ages 6 to 17 years |
| Maltese | 15.3 /100 | #203 | Poor 9.1% |
| Immigrants from Canada | 15.3 /100 | #204 | Poor 9.1% |
| Immigrants from Western Europe | 14.1 /100 | #205 | Poor 9.1% |
| Immigrants from North America | 12.7 /100 | #206 | Poor 9.2% |
| Cubans | 10.9 /100 | #207 | Poor 9.2% |
| Immigrants from Peru | 10.8 /100 | #208 | Poor 9.2% |
| Salvadorans | 10.7 /100 | #209 | Poor 9.2% |
| Finns | 10.0 /100 | #210 | Tragic 9.2% |
| Immigrants from Cuba | 9.6 /100 | #211 | Tragic 9.2% |
| Peruvians | 9.0 /100 | #212 | Tragic 9.2% |
| Spaniards | 8.2 /100 | #213 | Tragic 9.2% |
| Iroquois | 7.5 /100 | #214 | Tragic 9.2% |
| Immigrants from Germany | 7.2 /100 | #215 | Tragic 9.2% |
| Immigrants from Uruguay | 7.2 /100 | #216 | Tragic 9.2% |
| Germans | 7.2 /100 | #217 | Tragic 9.2% |
Finnish Unemployment Among Women with Children Ages 6 to 17 years Correlation Summary
| Measurement | Finnish Data | Unemployment Among Women with Children Ages 6 to 17 years Data |
| Minimum | 0.12% | 1.3% |
| Maximum | 29.8% | 100.0% |
| Range | 29.7% | 98.7% |
| Mean | 10.6% | 26.7% |
| Median | 8.5% | 14.7% |
| Interquartile 25% (IQ1) | 4.2% | 8.6% |
| Interquartile 75% (IQ3) | 14.7% | 43.5% |
| Interquartile Range (IQR) | 10.5% | 34.9% |
| Standard Deviation (Sample) | 8.4% | 27.4% |
| Standard Deviation (Population) | 8.3% | 27.0% |
Correlation Details
| Finnish Percentile | Sample Size | Unemployment Among Women with Children Ages 6 to 17 years |
[ 0.0% - 0.5% ] 0.12% | 255,897,878 | 8.5% |
[ 0.5% - 1.0% ] 0.67% | 15,737,340 | 8.4% |
[ 1.0% - 1.5% ] 1.18% | 3,778,574 | 8.6% |
[ 1.5% - 2.0% ] 1.67% | 856,163 | 12.1% |
[ 2.0% - 2.5% ] 2.25% | 391,447 | 11.2% |
[ 2.5% - 3.0% ] 2.80% | 238,408 | 15.1% |
[ 3.0% - 3.5% ] 3.36% | 94,456 | 20.2% |
[ 3.5% - 4.0% ] 3.65% | 15,119 | 43.5% |
[ 4.0% - 4.5% ] 4.23% | 79,000 | 12.5% |
[ 4.5% - 5.0% ] 4.84% | 25,545 | 15.3% |
[ 5.0% - 5.5% ] 5.39% | 12,144 | 2.2% |
[ 5.5% - 6.0% ] 5.82% | 47,013 | 6.2% |
[ 6.0% - 6.5% ] 6.29% | 102,847 | 12.6% |
[ 6.5% - 7.0% ] 6.73% | 21,606 | 14.6% |
[ 7.0% - 7.5% ] 7.35% | 37,731 | 6.7% |
[ 7.5% - 8.0% ] 7.74% | 2,158 | 88.9% |
[ 8.0% - 8.5% ] 8.18% | 15,584 | 48.5% |
[ 8.5% - 9.0% ] 8.81% | 6,825 | 49.9% |
[ 9.0% - 9.5% ] 9.33% | 5,090 | 23.4% |
[ 10.0% - 10.5% ] 10.29% | 19,002 | 1.3% |
[ 10.5% - 11.0% ] 10.99% | 12,559 | 3.1% |
[ 11.0% - 11.5% ] 11.38% | 5,714 | 25.6% |
[ 11.5% - 12.0% ] 11.92% | 24,709 | 6.7% |
[ 12.0% - 12.5% ] 12.10% | 1,190 | 26.9% |
[ 13.5% - 14.0% ] 13.61% | 3,328 | 9.9% |
[ 14.5% - 15.0% ] 14.71% | 435 | 66.7% |
[ 15.0% - 15.5% ] 15.06% | 737 | 100.0% |
[ 16.0% - 16.5% ] 16.46% | 1,871 | 13.3% |
[ 22.5% - 23.0% ] 22.74% | 431 | 50.0% |
[ 23.0% - 23.5% ] 23.17% | 423 | 50.0% |
[ 23.5% - 24.0% ] 23.79% | 8,233 | 14.9% |
[ 26.0% - 26.5% ] 26.27% | 902 | 15.4% |
[ 29.0% - 29.5% ] 29.14% | 278 | 100.0% |
[ 29.5% - 30.0% ] 29.81% | 7,238 | 14.3% |