Brazilian College, Under 1 year
COMPARE
Brazilian
Select to Compare
College, Under 1 year
Brazilian College, Under 1 year
65.9%
COLLEGE, UNDER 1 YEAR
66.0/ 100
METRIC RATING
161st/ 347
METRIC RANK
Brazilian College, Under 1 year Correlation Chart
The statistical analysis conducted on geographies consisting of 323,962,626 people shows a mild negative correlation between the proportion of Brazilians and percentage of population with at least college, under 1 year education in the United States with a correlation coefficient (R) of -0.357 and weighted average of 65.9%. On average, for every 1% (one percent) increase in Brazilians within a typical geography, there is a decrease of 0.52% in percentage of population with at least college, under 1 year education.
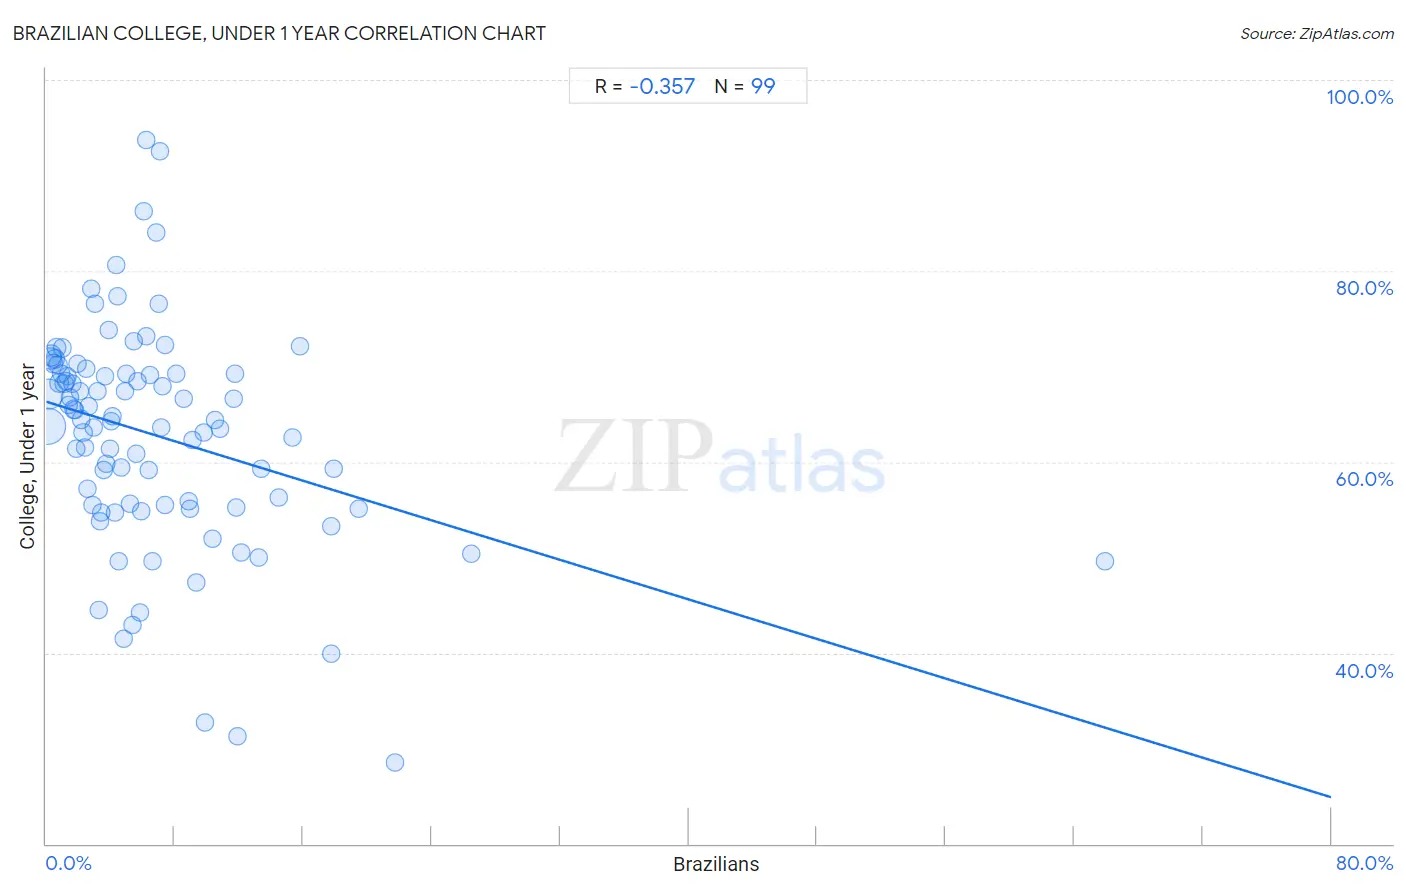
It is essential to understand that the correlation between the percentage of Brazilians and percentage of population with at least college, under 1 year education does not imply a direct cause-and-effect relationship. It remains uncertain whether the presence of Brazilians influences an upward or downward trend in the level of percentage of population with at least college, under 1 year education within an area, or if Brazilians simply ended up residing in those areas with higher or lower levels of percentage of population with at least college, under 1 year education due to other factors.
Demographics Similar to Brazilians by College, Under 1 year
In terms of college, under 1 year, the demographic groups most similar to Brazilians are Albanian (65.9%, a difference of 0.010%), Tlingit-Haida (65.9%, a difference of 0.020%), Korean (65.9%, a difference of 0.030%), Celtic (65.9%, a difference of 0.070%), and Sierra Leonean (66.0%, a difference of 0.090%).
| Demographics | Rating | Rank | College, Under 1 year |
| Immigrants from Eritrea | 71.9 /100 | #154 | Good 66.1% |
| Irish | 70.3 /100 | #155 | Good 66.0% |
| Welsh | 69.9 /100 | #156 | Good 66.0% |
| Sierra Leoneans | 67.8 /100 | #157 | Good 66.0% |
| Celtics | 67.3 /100 | #158 | Good 65.9% |
| Tlingit-Haida | 66.4 /100 | #159 | Good 65.9% |
| Albanians | 66.1 /100 | #160 | Good 65.9% |
| Brazilians | 66.0 /100 | #161 | Good 65.9% |
| Koreans | 65.3 /100 | #162 | Good 65.9% |
| Somalis | 62.7 /100 | #163 | Good 65.8% |
| Czechoslovakians | 62.6 /100 | #164 | Good 65.8% |
| Immigrants from Uzbekistan | 61.6 /100 | #165 | Good 65.8% |
| Moroccans | 56.7 /100 | #166 | Average 65.6% |
| Immigrants from Somalia | 56.4 /100 | #167 | Average 65.6% |
| Hungarians | 55.9 /100 | #168 | Average 65.6% |
Brazilian College, Under 1 year Correlation Summary
| Measurement | Brazilian Data | College, Under 1 year Data |
| Minimum | 0.046% | 28.5% |
| Maximum | 65.9% | 93.7% |
| Range | 65.9% | 65.2% |
| Mean | 6.8% | 62.8% |
| Median | 4.9% | 64.4% |
| Interquartile 25% (IQ1) | 2.4% | 55.5% |
| Interquartile 75% (IQ3) | 9.0% | 69.3% |
| Interquartile Range (IQR) | 6.6% | 13.8% |
| Standard Deviation (Sample) | 8.0% | 11.6% |
| Standard Deviation (Population) | 7.9% | 11.5% |
Correlation Details
| Brazilian Percentile | Sample Size | College, Under 1 year |
[ 0.0% - 0.5% ] 0.046% | 137,019,397 | 63.7% |
[ 0.0% - 0.5% ] 0.14% | 85,392,038 | 67.1% |
[ 0.0% - 0.5% ] 0.24% | 31,744,304 | 70.8% |
[ 0.0% - 0.5% ] 0.33% | 19,850,679 | 71.1% |
[ 0.0% - 0.5% ] 0.43% | 12,173,004 | 70.3% |
[ 0.5% - 1.0% ] 0.53% | 7,593,410 | 70.7% |
[ 0.5% - 1.0% ] 0.63% | 5,725,301 | 72.0% |
[ 0.5% - 1.0% ] 0.73% | 2,623,104 | 70.2% |
[ 0.5% - 1.0% ] 0.81% | 3,097,017 | 68.3% |
[ 0.5% - 1.0% ] 0.92% | 2,547,065 | 69.3% |
[ 1.0% - 1.5% ] 1.02% | 2,026,823 | 71.9% |
[ 1.0% - 1.5% ] 1.12% | 1,609,851 | 68.2% |
[ 1.0% - 1.5% ] 1.21% | 1,432,636 | 68.4% |
[ 1.0% - 1.5% ] 1.31% | 967,552 | 69.0% |
[ 1.0% - 1.5% ] 1.41% | 819,150 | 65.9% |
[ 1.5% - 2.0% ] 1.50% | 801,833 | 66.7% |
[ 1.5% - 2.0% ] 1.60% | 583,826 | 68.2% |
[ 1.5% - 2.0% ] 1.69% | 1,006,548 | 65.5% |
[ 1.5% - 2.0% ] 1.80% | 263,349 | 65.5% |
[ 1.5% - 2.0% ] 1.90% | 486,593 | 61.4% |
[ 1.5% - 2.0% ] 1.97% | 151,262 | 70.3% |
[ 2.0% - 2.5% ] 2.11% | 735,276 | 67.4% |
[ 2.0% - 2.5% ] 2.18% | 440,427 | 64.5% |
[ 2.0% - 2.5% ] 2.30% | 368,846 | 63.1% |
[ 2.0% - 2.5% ] 2.37% | 296,770 | 61.5% |
[ 2.0% - 2.5% ] 2.47% | 143,659 | 69.8% |
[ 2.5% - 3.0% ] 2.56% | 198,456 | 57.2% |
[ 2.5% - 3.0% ] 2.67% | 121,638 | 65.8% |
[ 2.5% - 3.0% ] 2.79% | 60,860 | 78.2% |
[ 2.5% - 3.0% ] 2.87% | 167,682 | 55.5% |
[ 2.5% - 3.0% ] 2.98% | 183,241 | 63.6% |
[ 3.0% - 3.5% ] 3.06% | 65,423 | 76.5% |
[ 3.0% - 3.5% ] 3.16% | 61,562 | 67.3% |
[ 3.0% - 3.5% ] 3.25% | 400 | 44.4% |
[ 3.0% - 3.5% ] 3.37% | 107,926 | 53.8% |
[ 3.0% - 3.5% ] 3.45% | 240,705 | 54.7% |
[ 3.5% - 4.0% ] 3.58% | 255,685 | 59.1% |
[ 3.5% - 4.0% ] 3.65% | 143,358 | 69.0% |
[ 3.5% - 4.0% ] 3.74% | 174,154 | 59.9% |
[ 3.5% - 4.0% ] 3.87% | 32,655 | 73.8% |
[ 3.5% - 4.0% ] 3.96% | 97,412 | 61.3% |
[ 4.0% - 4.5% ] 4.03% | 151,720 | 64.3% |
[ 4.0% - 4.5% ] 4.13% | 29,781 | 64.7% |
[ 4.0% - 4.5% ] 4.25% | 7,419 | 54.7% |
[ 4.0% - 4.5% ] 4.32% | 63,354 | 80.6% |
[ 4.0% - 4.5% ] 4.47% | 42,045 | 77.3% |
[ 4.0% - 4.5% ] 4.50% | 122,618 | 49.5% |
[ 4.5% - 5.0% ] 4.64% | 12,532 | 59.4% |
[ 4.5% - 5.0% ] 4.79% | 321,508 | 41.5% |
[ 4.5% - 5.0% ] 4.90% | 9,246 | 67.4% |
[ 5.0% - 5.5% ] 5.02% | 5,799 | 69.3% |
[ 5.0% - 5.5% ] 5.18% | 29,576 | 55.7% |
[ 5.0% - 5.5% ] 5.38% | 818 | 43.0% |
[ 5.0% - 5.5% ] 5.46% | 1,924 | 72.6% |
[ 5.5% - 6.0% ] 5.61% | 144,030 | 60.9% |
[ 5.5% - 6.0% ] 5.70% | 20,668 | 68.5% |
[ 5.5% - 6.0% ] 5.81% | 3,957 | 44.3% |
[ 5.5% - 6.0% ] 5.93% | 1,012 | 54.8% |
[ 6.0% - 6.5% ] 6.09% | 10,623 | 86.3% |
[ 6.0% - 6.5% ] 6.20% | 742 | 93.7% |
[ 6.0% - 6.5% ] 6.25% | 9,051 | 73.2% |
[ 6.0% - 6.5% ] 6.40% | 5,003 | 59.1% |
[ 6.0% - 6.5% ] 6.48% | 48,922 | 69.1% |
[ 6.5% - 7.0% ] 6.59% | 57,900 | 49.6% |
[ 6.5% - 7.0% ] 6.85% | 70,451 | 84.0% |
[ 6.5% - 7.0% ] 7.00% | 46,938 | 76.6% |
[ 7.0% - 7.5% ] 7.07% | 948 | 92.6% |
[ 7.0% - 7.5% ] 7.12% | 2,330 | 63.6% |
[ 7.0% - 7.5% ] 7.25% | 33,691 | 67.9% |
[ 7.0% - 7.5% ] 7.37% | 17,870 | 72.3% |
[ 7.0% - 7.5% ] 7.42% | 58,698 | 55.5% |
[ 8.0% - 8.5% ] 8.10% | 51,318 | 69.2% |
[ 8.5% - 9.0% ] 8.59% | 32,076 | 66.6% |
[ 8.5% - 9.0% ] 8.89% | 118,546 | 55.9% |
[ 8.5% - 9.0% ] 8.96% | 31,932 | 55.1% |
[ 9.0% - 9.5% ] 9.11% | 2,570 | 62.3% |
[ 9.0% - 9.5% ] 9.37% | 98,856 | 47.4% |
[ 9.5% - 10.0% ] 9.81% | 11,653 | 63.0% |
[ 9.5% - 10.0% ] 9.91% | 13,154 | 32.7% |
[ 10.0% - 10.5% ] 10.38% | 60,009 | 51.9% |
[ 10.5% - 11.0% ] 10.51% | 1,580 | 64.4% |
[ 10.5% - 11.0% ] 10.79% | 82,782 | 63.4% |
[ 11.5% - 12.0% ] 11.68% | 50,112 | 66.6% |
[ 11.5% - 12.0% ] 11.74% | 71,805 | 69.2% |
[ 11.5% - 12.0% ] 11.86% | 59 | 55.2% |
[ 11.5% - 12.0% ] 11.93% | 3,848 | 31.2% |
[ 12.0% - 12.5% ] 12.14% | 17,178 | 50.5% |
[ 13.0% - 13.5% ] 13.26% | 181 | 50.0% |
[ 13.0% - 13.5% ] 13.38% | 30,411 | 59.3% |
[ 14.0% - 14.5% ] 14.48% | 27,569 | 56.3% |
[ 15.0% - 15.5% ] 15.29% | 8,547 | 62.5% |
[ 15.5% - 16.0% ] 15.76% | 203 | 72.1% |
[ 17.5% - 18.0% ] 17.72% | 1,016 | 39.9% |
[ 17.5% - 18.0% ] 17.75% | 1,183 | 53.3% |
[ 17.5% - 18.0% ] 17.87% | 38,898 | 59.3% |
[ 19.0% - 19.5% ] 19.48% | 2,367 | 55.1% |
[ 21.5% - 22.0% ] 21.74% | 61,855 | 28.5% |
[ 26.0% - 26.5% ] 26.46% | 650 | 50.3% |
[ 65.5% - 66.0% ] 65.90% | 217 | 49.6% |