Brazilian Married-couple Households
COMPARE
Brazilian
Select to Compare
Married-couple Households
Brazilian Married-couple Households
46.2%
MARRIED-COUPLE HOUSEHOLDS
35.9/ 100
METRIC RATING
185th/ 347
METRIC RANK
Brazilian Married-couple Households Correlation Chart
The statistical analysis conducted on geographies consisting of 323,707,241 people shows a mild positive correlation between the proportion of Brazilians and percentage of married-couple family households in the United States with a correlation coefficient (R) of 0.346 and weighted average of 46.2%. On average, for every 1% (one percent) increase in Brazilians within a typical geography, there is an increase of 0.45% in percentage of married-couple family households.
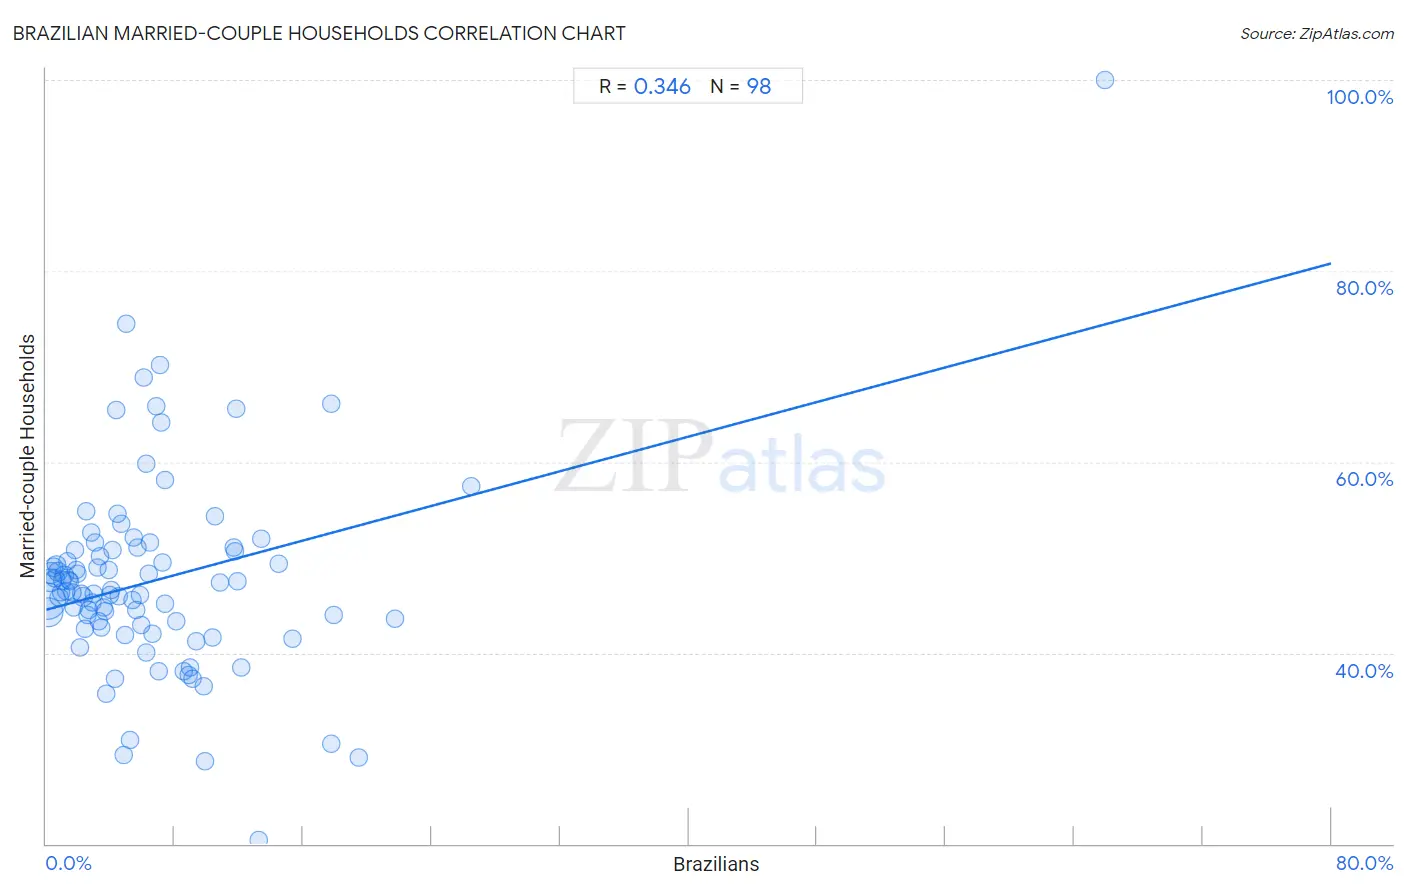
It is essential to understand that the correlation between the percentage of Brazilians and percentage of married-couple family households does not imply a direct cause-and-effect relationship. It remains uncertain whether the presence of Brazilians influences an upward or downward trend in the level of percentage of married-couple family households within an area, or if Brazilians simply ended up residing in those areas with higher or lower levels of percentage of married-couple family households due to other factors.
Demographics Similar to Brazilians by Married-couple Households
In terms of married-couple households, the demographic groups most similar to Brazilians are Immigrants from Switzerland (46.2%, a difference of 0.040%), Immigrants from Brazil (46.2%, a difference of 0.10%), Yugoslavian (46.2%, a difference of 0.12%), Albanian (46.1%, a difference of 0.20%), and Mongolian (46.3%, a difference of 0.24%).
| Demographics | Rating | Rank | Married-couple Households |
| Immigrants from Costa Rica | 43.4 /100 | #178 | Average 46.3% |
| Immigrants from Zimbabwe | 43.0 /100 | #179 | Average 46.3% |
| Mongolians | 42.0 /100 | #180 | Average 46.3% |
| Malaysians | 41.8 /100 | #181 | Average 46.3% |
| Yugoslavians | 38.9 /100 | #182 | Fair 46.2% |
| Immigrants from Brazil | 38.3 /100 | #183 | Fair 46.2% |
| Immigrants from Switzerland | 36.9 /100 | #184 | Fair 46.2% |
| Brazilians | 35.9 /100 | #185 | Fair 46.2% |
| Albanians | 31.1 /100 | #186 | Fair 46.1% |
| Fijians | 29.2 /100 | #187 | Fair 46.1% |
| South American Indians | 28.4 /100 | #188 | Fair 46.0% |
| Immigrants from Latvia | 26.9 /100 | #189 | Fair 46.0% |
| Immigrants from Kuwait | 25.6 /100 | #190 | Fair 46.0% |
| Choctaw | 24.9 /100 | #191 | Fair 46.0% |
| Immigrants from Northern Africa | 24.6 /100 | #192 | Fair 46.0% |
Brazilian Married-couple Households Correlation Summary
| Measurement | Brazilian Data | Married-couple Households Data |
| Minimum | 0.046% | 20.4% |
| Maximum | 65.9% | 100.0% |
| Range | 65.9% | 79.6% |
| Mean | 6.7% | 47.6% |
| Median | 4.8% | 46.4% |
| Interquartile 25% (IQ1) | 2.4% | 42.9% |
| Interquartile 75% (IQ3) | 8.9% | 50.7% |
| Interquartile Range (IQR) | 6.5% | 7.8% |
| Standard Deviation (Sample) | 7.9% | 10.4% |
| Standard Deviation (Population) | 7.9% | 10.4% |
Correlation Details
| Brazilian Percentile | Sample Size | Married-couple Households |
[ 0.0% - 0.5% ] 0.046% | 136,986,961 | 45.3% |
[ 0.0% - 0.5% ] 0.14% | 85,356,894 | 44.3% |
[ 0.0% - 0.5% ] 0.24% | 31,715,068 | 47.6% |
[ 0.0% - 0.5% ] 0.33% | 19,817,149 | 48.4% |
[ 0.0% - 0.5% ] 0.43% | 12,135,450 | 49.0% |
[ 0.5% - 1.0% ] 0.53% | 7,570,762 | 47.8% |
[ 0.5% - 1.0% ] 0.63% | 5,704,148 | 49.2% |
[ 0.5% - 1.0% ] 0.73% | 2,614,309 | 48.5% |
[ 0.5% - 1.0% ] 0.81% | 3,083,345 | 45.8% |
[ 0.5% - 1.0% ] 0.92% | 2,545,129 | 46.4% |
[ 1.0% - 1.5% ] 1.02% | 2,023,027 | 47.6% |
[ 1.0% - 1.5% ] 1.12% | 1,609,851 | 48.1% |
[ 1.0% - 1.5% ] 1.21% | 1,432,636 | 46.5% |
[ 1.0% - 1.5% ] 1.31% | 957,568 | 49.5% |
[ 1.0% - 1.5% ] 1.41% | 819,150 | 47.7% |
[ 1.5% - 2.0% ] 1.50% | 801,833 | 47.5% |
[ 1.5% - 2.0% ] 1.60% | 583,826 | 46.3% |
[ 1.5% - 2.0% ] 1.69% | 1,006,548 | 44.8% |
[ 1.5% - 2.0% ] 1.80% | 259,954 | 50.8% |
[ 1.5% - 2.0% ] 1.90% | 486,593 | 48.6% |
[ 1.5% - 2.0% ] 1.97% | 150,919 | 48.3% |
[ 2.0% - 2.5% ] 2.11% | 735,276 | 40.5% |
[ 2.0% - 2.5% ] 2.18% | 440,427 | 46.2% |
[ 2.0% - 2.5% ] 2.30% | 368,846 | 45.9% |
[ 2.0% - 2.5% ] 2.37% | 296,770 | 42.5% |
[ 2.0% - 2.5% ] 2.47% | 143,659 | 54.8% |
[ 2.5% - 3.0% ] 2.56% | 198,698 | 43.9% |
[ 2.5% - 3.0% ] 2.67% | 121,638 | 44.5% |
[ 2.5% - 3.0% ] 2.79% | 60,644 | 52.7% |
[ 2.5% - 3.0% ] 2.87% | 167,682 | 45.3% |
[ 2.5% - 3.0% ] 2.98% | 183,241 | 46.2% |
[ 3.0% - 3.5% ] 3.06% | 65,423 | 51.5% |
[ 3.0% - 3.5% ] 3.16% | 61,562 | 48.9% |
[ 3.0% - 3.5% ] 3.25% | 154 | 43.3% |
[ 3.0% - 3.5% ] 3.37% | 107,926 | 50.1% |
[ 3.0% - 3.5% ] 3.45% | 240,705 | 42.7% |
[ 3.5% - 4.0% ] 3.58% | 255,318 | 44.8% |
[ 3.5% - 4.0% ] 3.65% | 143,358 | 44.3% |
[ 3.5% - 4.0% ] 3.74% | 174,154 | 35.7% |
[ 3.5% - 4.0% ] 3.87% | 32,655 | 48.7% |
[ 3.5% - 4.0% ] 3.96% | 97,412 | 46.0% |
[ 4.0% - 4.5% ] 4.03% | 151,720 | 46.5% |
[ 4.0% - 4.5% ] 4.13% | 29,781 | 50.7% |
[ 4.0% - 4.5% ] 4.25% | 7,419 | 37.3% |
[ 4.0% - 4.5% ] 4.32% | 63,354 | 65.4% |
[ 4.0% - 4.5% ] 4.47% | 42,045 | 54.6% |
[ 4.0% - 4.5% ] 4.50% | 122,618 | 45.9% |
[ 4.5% - 5.0% ] 4.64% | 12,532 | 53.5% |
[ 4.5% - 5.0% ] 4.79% | 321,508 | 29.3% |
[ 4.5% - 5.0% ] 4.90% | 9,246 | 41.9% |
[ 5.0% - 5.5% ] 5.02% | 5,799 | 74.5% |
[ 5.0% - 5.5% ] 5.18% | 29,576 | 30.8% |
[ 5.0% - 5.5% ] 5.37% | 670 | 45.6% |
[ 5.0% - 5.5% ] 5.46% | 1,924 | 52.1% |
[ 5.5% - 6.0% ] 5.61% | 144,030 | 44.5% |
[ 5.5% - 6.0% ] 5.70% | 20,668 | 51.0% |
[ 5.5% - 6.0% ] 5.81% | 3,957 | 46.1% |
[ 5.5% - 6.0% ] 5.93% | 843 | 42.9% |
[ 6.0% - 6.5% ] 6.09% | 10,623 | 68.8% |
[ 6.0% - 6.5% ] 6.20% | 742 | 59.8% |
[ 6.0% - 6.5% ] 6.25% | 9,051 | 40.0% |
[ 6.0% - 6.5% ] 6.40% | 5,003 | 48.3% |
[ 6.0% - 6.5% ] 6.48% | 48,922 | 51.5% |
[ 6.5% - 7.0% ] 6.59% | 57,900 | 42.0% |
[ 6.5% - 7.0% ] 6.85% | 70,451 | 65.9% |
[ 6.5% - 7.0% ] 7.00% | 46,938 | 38.1% |
[ 7.0% - 7.5% ] 7.07% | 948 | 70.2% |
[ 7.0% - 7.5% ] 7.12% | 2,330 | 64.1% |
[ 7.0% - 7.5% ] 7.25% | 33,691 | 49.5% |
[ 7.0% - 7.5% ] 7.37% | 17,214 | 58.1% |
[ 7.0% - 7.5% ] 7.42% | 58,698 | 45.1% |
[ 8.0% - 8.5% ] 8.10% | 51,318 | 43.3% |
[ 8.5% - 9.0% ] 8.59% | 32,076 | 38.0% |
[ 8.5% - 9.0% ] 8.89% | 118,546 | 37.7% |
[ 8.5% - 9.0% ] 8.96% | 31,932 | 38.5% |
[ 9.0% - 9.5% ] 9.11% | 2,570 | 37.3% |
[ 9.0% - 9.5% ] 9.37% | 98,856 | 41.2% |
[ 9.5% - 10.0% ] 9.81% | 11,653 | 36.6% |
[ 9.5% - 10.0% ] 9.91% | 13,154 | 28.7% |
[ 10.0% - 10.5% ] 10.38% | 60,009 | 41.6% |
[ 10.5% - 11.0% ] 10.51% | 1,580 | 54.3% |
[ 10.5% - 11.0% ] 10.79% | 82,782 | 47.3% |
[ 11.5% - 12.0% ] 11.68% | 50,112 | 51.1% |
[ 11.5% - 12.0% ] 11.74% | 71,805 | 50.6% |
[ 11.5% - 12.0% ] 11.86% | 59 | 65.6% |
[ 11.5% - 12.0% ] 11.93% | 3,848 | 47.5% |
[ 12.0% - 12.5% ] 12.14% | 17,178 | 38.5% |
[ 13.0% - 13.5% ] 13.26% | 181 | 20.4% |
[ 13.0% - 13.5% ] 13.38% | 30,411 | 51.9% |
[ 14.0% - 14.5% ] 14.48% | 27,569 | 49.3% |
[ 15.0% - 15.5% ] 15.29% | 8,547 | 41.5% |
[ 17.5% - 18.0% ] 17.72% | 1,016 | 30.5% |
[ 17.5% - 18.0% ] 17.75% | 1,183 | 66.0% |
[ 17.5% - 18.0% ] 17.87% | 38,898 | 43.9% |
[ 19.0% - 19.5% ] 19.48% | 2,367 | 29.0% |
[ 21.5% - 22.0% ] 21.74% | 61,855 | 43.6% |
[ 26.0% - 26.5% ] 26.46% | 650 | 57.4% |
[ 65.5% - 66.0% ] 65.90% | 217 | 100.0% |