Lubbock, TX Map & Demographics
Lubbock Map
Lubbock Overview
$33,259
PER CAPITA INCOME
$78,682
AVG FAMILY INCOME
$58,734
AVG HOUSEHOLD INCOME
31.2%
WAGE / INCOME GAP [ % ]
68.8¢/ $1
WAGE / INCOME GAP [ $ ]
$11,194
FAMILY INCOME DEFICIT
0.49
INEQUALITY / GINI INDEX
258,190
TOTAL POPULATION
127,237
MALE POPULATION
130,953
FEMALE POPULATION
97.16
MALES / 100 FEMALES
102.92
FEMALES / 100 MALES
30.0
MEDIAN AGE
3.1
AVG FAMILY SIZE
2.4
AVG HOUSEHOLD SIZE
135,629
LABOR FORCE [ PEOPLE ]
65.8%
PERCENT IN LABOR FORCE
4.6%
UNEMPLOYMENT RATE
Lubbock Zip Codes
Lubbock Area Codes
Income in Lubbock
Income Overview in Lubbock
Per Capita Income in Lubbock is $33,259, while median incomes of families and households are $78,682 and $58,734 respectively.
| Characteristic | Number | Measure |
| Per Capita Income | 258,190 | $33,259 |
| Median Family Income | 58,249 | $78,682 |
| Mean Family Income | 58,249 | $103,650 |
| Median Household Income | 102,894 | $58,734 |
| Mean Household Income | 102,894 | $82,415 |
| Income Deficit | 58,249 | $11,194 |
| Wage / Income Gap (%) | 258,190 | 31.18% |
| Wage / Income Gap ($) | 258,190 | 68.82¢ per $1 |
| Gini / Inequality Index | 258,190 | 0.49 |
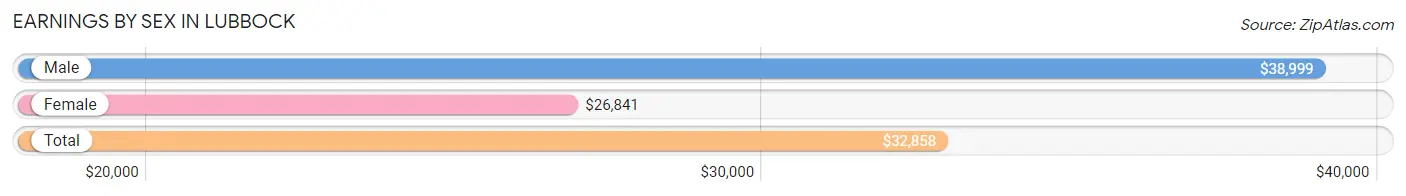
Earnings by Sex in Lubbock
Average Earnings in Lubbock are $32,858, $38,999 for men and $26,841 for women, a difference of 31.2%.
| Sex | Number | Average Earnings |
| Male | 75,945 (52.3%) | $38,999 |
| Female | 69,262 (47.7%) | $26,841 |
| Total | 145,207 (100.0%) | $32,858 |
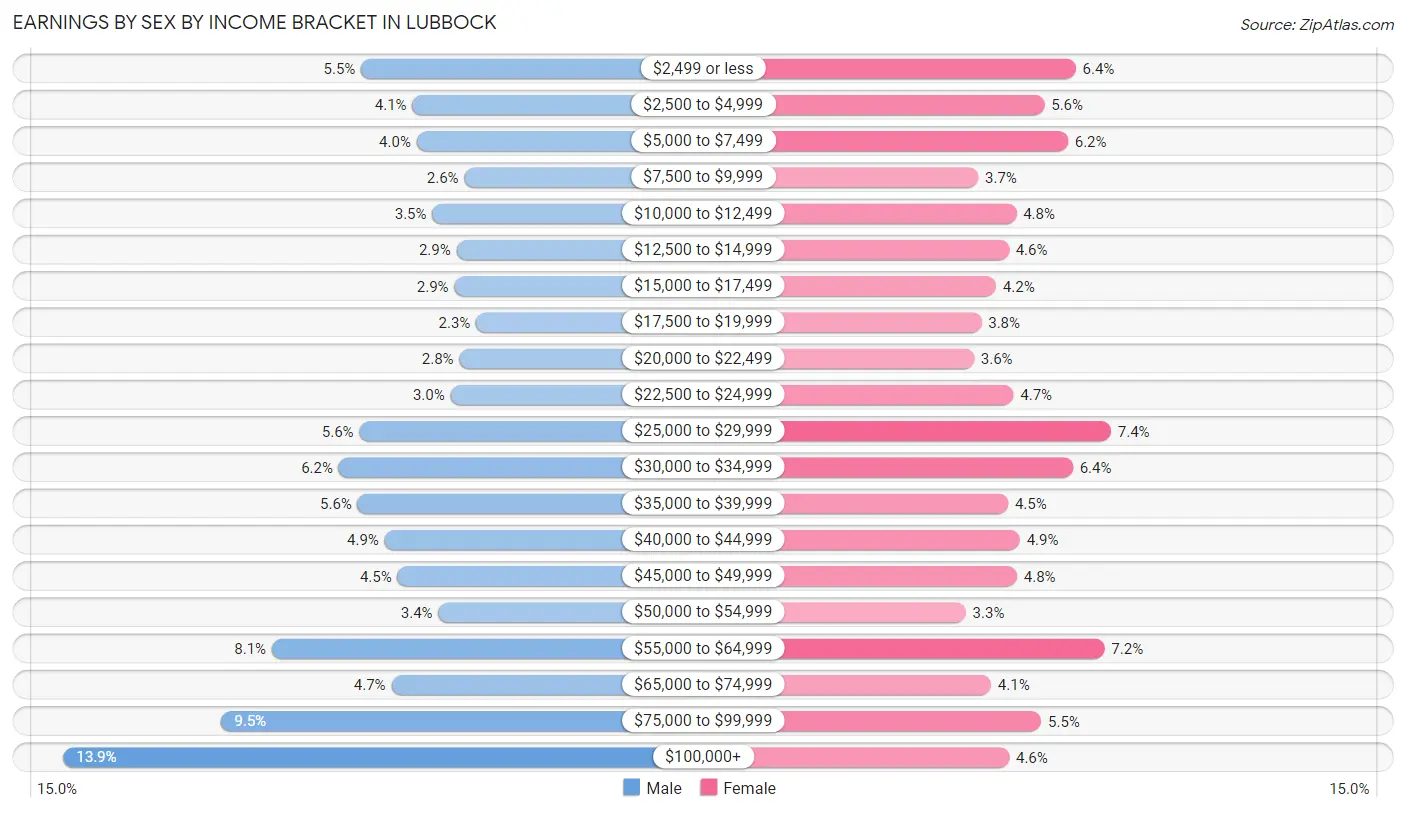
Earnings by Sex by Income Bracket in Lubbock
The most common earnings brackets in Lubbock are $100,000+ for men (10,566 | 13.9%) and $25,000 to $29,999 for women (5,137 | 7.4%).
| Income | Male | Female |
| $2,499 or less | 4,209 (5.5%) | 4,457 (6.4%) |
| $2,500 to $4,999 | 3,117 (4.1%) | 3,842 (5.6%) |
| $5,000 to $7,499 | 3,025 (4.0%) | 4,302 (6.2%) |
| $7,500 to $9,999 | 2,005 (2.6%) | 2,553 (3.7%) |
| $10,000 to $12,499 | 2,691 (3.5%) | 3,299 (4.8%) |
| $12,500 to $14,999 | 2,173 (2.9%) | 3,149 (4.5%) |
| $15,000 to $17,499 | 2,215 (2.9%) | 2,905 (4.2%) |
| $17,500 to $19,999 | 1,757 (2.3%) | 2,620 (3.8%) |
| $20,000 to $22,499 | 2,108 (2.8%) | 2,473 (3.6%) |
| $22,500 to $24,999 | 2,304 (3.0%) | 3,243 (4.7%) |
| $25,000 to $29,999 | 4,243 (5.6%) | 5,137 (7.4%) |
| $30,000 to $34,999 | 4,685 (6.2%) | 4,395 (6.4%) |
| $35,000 to $39,999 | 4,283 (5.6%) | 3,135 (4.5%) |
| $40,000 to $44,999 | 3,707 (4.9%) | 3,365 (4.9%) |
| $45,000 to $49,999 | 3,434 (4.5%) | 3,309 (4.8%) |
| $50,000 to $54,999 | 2,561 (3.4%) | 2,310 (3.3%) |
| $55,000 to $64,999 | 6,111 (8.1%) | 5,015 (7.2%) |
| $65,000 to $74,999 | 3,560 (4.7%) | 2,808 (4.1%) |
| $75,000 to $99,999 | 7,191 (9.5%) | 3,785 (5.5%) |
| $100,000+ | 10,566 (13.9%) | 3,160 (4.6%) |
| Total | 75,945 (100.0%) | 69,262 (100.0%) |
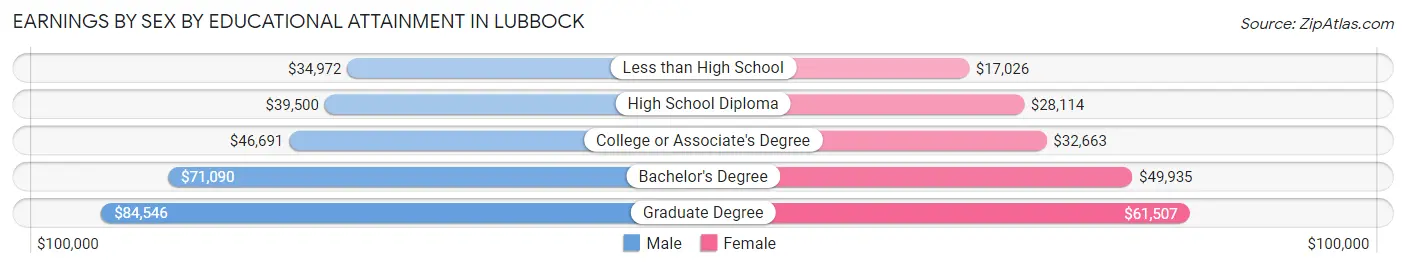
Earnings by Sex by Educational Attainment in Lubbock
Average earnings in Lubbock are $51,809 for men and $35,539 for women, a difference of 31.4%. Men with an educational attainment of graduate degree enjoy the highest average annual earnings of $84,546, while those with less than high school education earn the least with $34,972. Women with an educational attainment of graduate degree earn the most with the average annual earnings of $61,507, while those with less than high school education have the smallest earnings of $17,026.
| Educational Attainment | Male Income | Female Income |
| Less than High School | $34,972 | $17,026 |
| High School Diploma | $39,500 | $28,114 |
| College or Associate's Degree | $46,691 | $32,663 |
| Bachelor's Degree | $71,090 | $49,935 |
| Graduate Degree | $84,546 | $61,507 |
| Total | $51,809 | $35,539 |
Family Income in Lubbock
Family Income Brackets in Lubbock
According to the Lubbock family income data, there are 11,009 families falling into the $100,000 to $149,999 income range, which is the most common income bracket and makes up 18.9% of all families. Conversely, the $10,000 to $14,999 income bracket is the least frequent group with only 1,631 families (2.8%) belonging to this category.
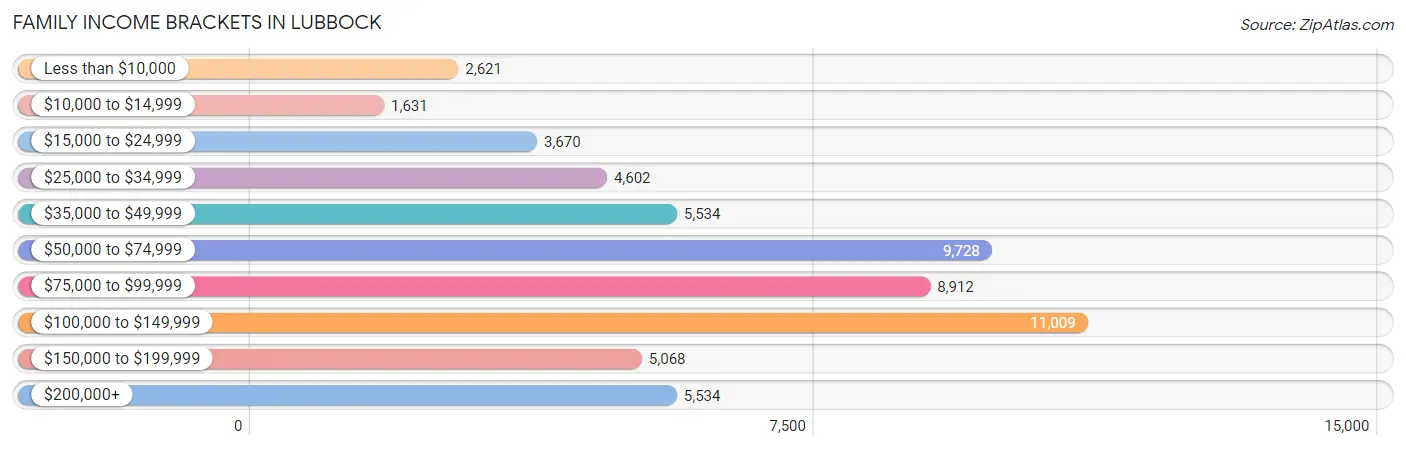
| Income Bracket | # Families | % Families |
| Less than $10,000 | 2,621 | 4.5% |
| $10,000 to $14,999 | 1,631 | 2.8% |
| $15,000 to $24,999 | 3,670 | 6.3% |
| $25,000 to $34,999 | 4,602 | 7.9% |
| $35,000 to $49,999 | 5,534 | 9.5% |
| $50,000 to $74,999 | 9,728 | 16.7% |
| $75,000 to $99,999 | 8,912 | 15.3% |
| $100,000 to $149,999 | 11,009 | 18.9% |
| $150,000 to $199,999 | 5,068 | 8.7% |
| $200,000+ | 5,534 | 9.5% |
Family Income by Famaliy Size in Lubbock
4-person families (10,371 | 17.8%) account for the highest median family income in Lubbock with $99,388 per family, while 2-person families (27,471 | 47.2%) have the highest median income of $35,478 per family member.
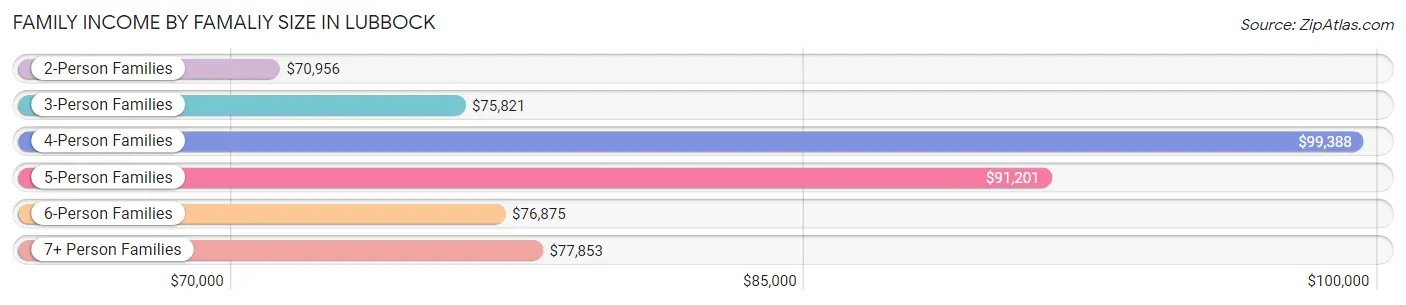
| Income Bracket | # Families | Median Income |
| 2-Person Families | 27,471 (47.2%) | $70,956 |
| 3-Person Families | 13,073 (22.4%) | $75,821 |
| 4-Person Families | 10,371 (17.8%) | $99,388 |
| 5-Person Families | 4,729 (8.1%) | $91,201 |
| 6-Person Families | 1,810 (3.1%) | $76,875 |
| 7+ Person Families | 795 (1.4%) | $77,853 |
| Total | 58,249 (100.0%) | $78,682 |
Family Income by Number of Earners in Lubbock
The median family income in Lubbock is $78,682, with families comprising 3+ earners (5,753) having the highest median family income of $113,827, while families with no earners (7,470) have the lowest median family income of $37,928, accounting for 9.9% and 12.8% of families, respectively.
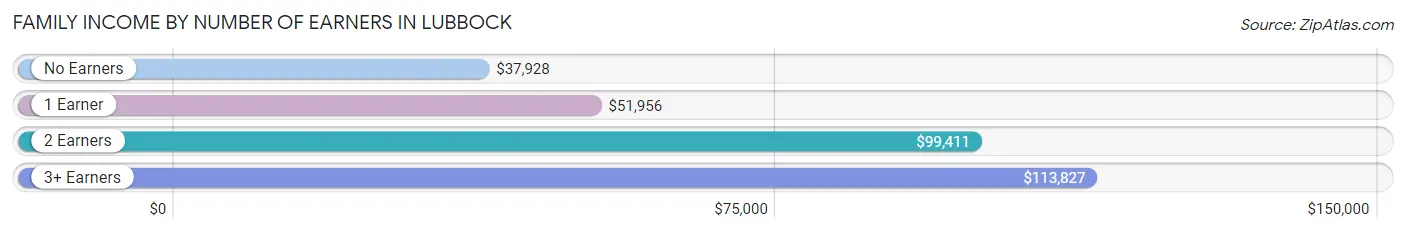
| Number of Earners | # Families | Median Income |
| No Earners | 7,470 (12.8%) | $37,928 |
| 1 Earner | 18,891 (32.4%) | $51,956 |
| 2 Earners | 26,135 (44.9%) | $99,411 |
| 3+ Earners | 5,753 (9.9%) | $113,827 |
| Total | 58,249 (100.0%) | $78,682 |
Household Income in Lubbock
Household Income Brackets in Lubbock
With 17,389 households falling in the category, the $50,000 to $74,999 income range is the most frequent in Lubbock, accounting for 16.9% of all households. In contrast, only 5,350 households (5.2%) fall into the $10,000 to $14,999 income bracket, making it the least populous group.
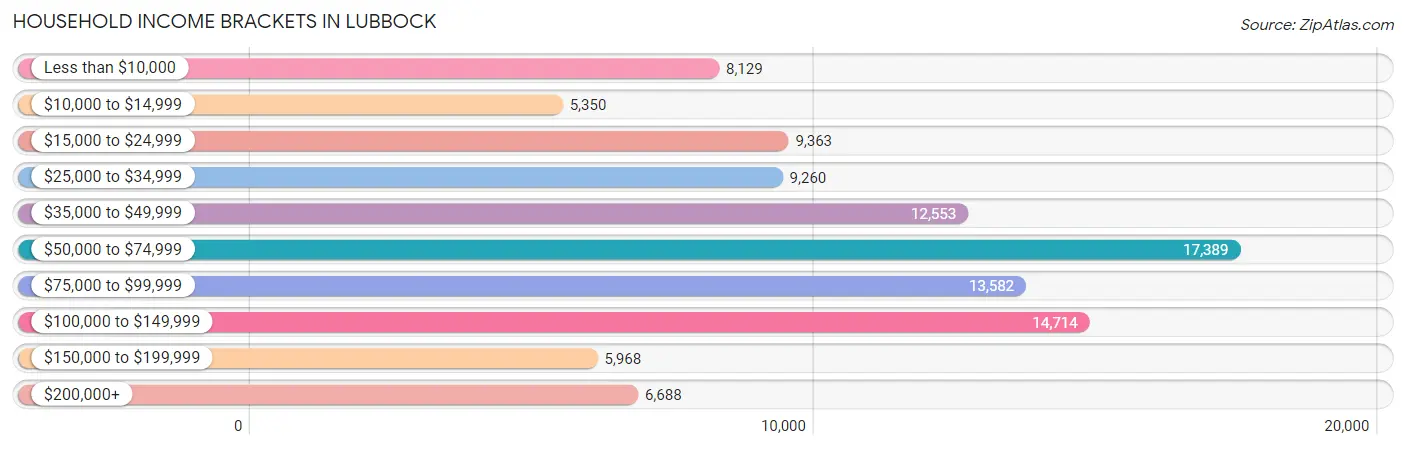
| Income Bracket | # Households | % Households |
| Less than $10,000 | 8,129 | 7.9% |
| $10,000 to $14,999 | 5,350 | 5.2% |
| $15,000 to $24,999 | 9,363 | 9.1% |
| $25,000 to $34,999 | 9,260 | 9.0% |
| $35,000 to $49,999 | 12,553 | 12.2% |
| $50,000 to $74,999 | 17,389 | 16.9% |
| $75,000 to $99,999 | 13,582 | 13.2% |
| $100,000 to $149,999 | 14,714 | 14.3% |
| $150,000 to $199,999 | 5,968 | 5.8% |
| $200,000+ | 6,688 | 6.5% |
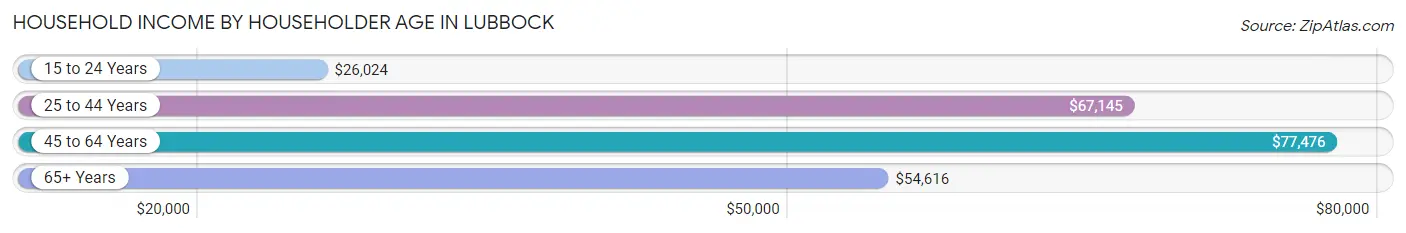
Household Income by Householder Age in Lubbock
The median household income in Lubbock is $58,734, with the highest median household income of $77,476 found in the 45 to 64 years age bracket for the primary householder. A total of 28,186 households (27.4%) fall into this category. Meanwhile, the 15 to 24 years age bracket for the primary householder has the lowest median household income of $26,024, with 15,340 households (14.9%) in this group.
| Income Bracket | # Households | Median Income |
| 15 to 24 Years | 15,340 (14.9%) | $26,024 |
| 25 to 44 Years | 38,395 (37.3%) | $67,145 |
| 45 to 64 Years | 28,186 (27.4%) | $77,476 |
| 65+ Years | 20,973 (20.4%) | $54,616 |
| Total | 102,894 (100.0%) | $58,734 |
Poverty in Lubbock
Income Below Poverty by Sex and Age in Lubbock
With 18.3% poverty level for males and 20.2% for females among the residents of Lubbock, 18 to 24 year old males and 18 to 24 year old females are the most vulnerable to poverty, with 9,120 males (43.6%) and 9,054 females (45.6%) in their respective age groups living below the poverty level.
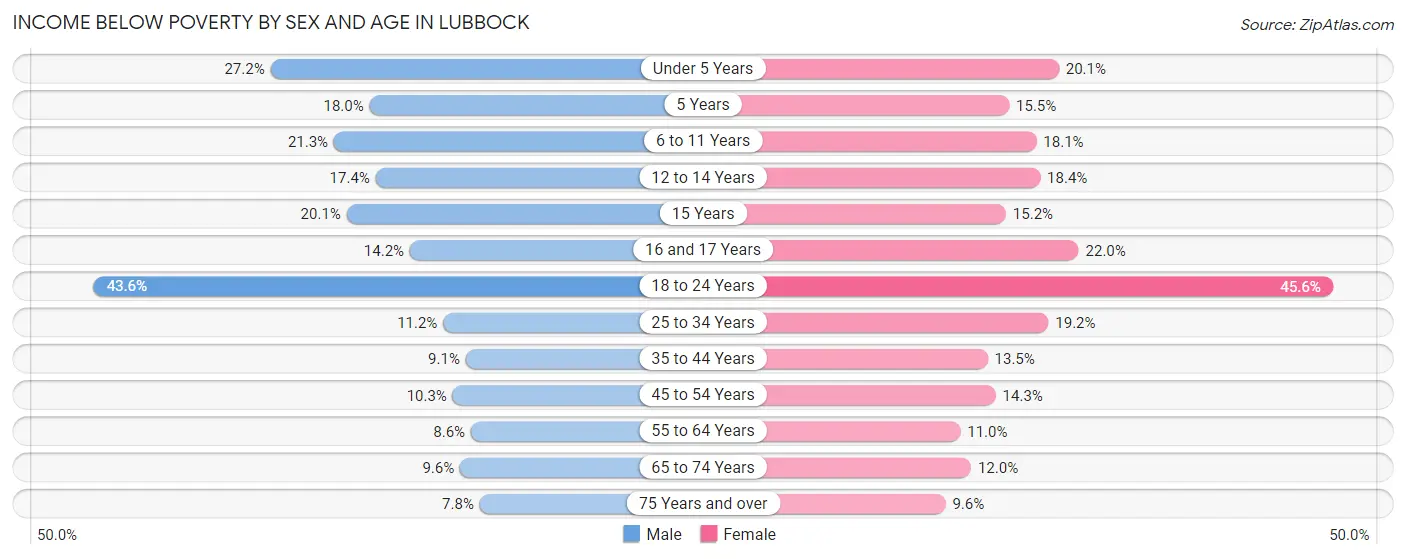
| Age Bracket | Male | Female |
| Under 5 Years | 2,218 (27.2%) | 1,661 (20.1%) |
| 5 Years | 312 (18.0%) | 242 (15.5%) |
| 6 to 11 Years | 2,115 (21.3%) | 1,594 (18.1%) |
| 12 to 14 Years | 828 (17.4%) | 972 (18.4%) |
| 15 Years | 303 (20.1%) | 255 (15.2%) |
| 16 and 17 Years | 468 (14.2%) | 735 (22.0%) |
| 18 to 24 Years | 9,120 (43.6%) | 9,054 (45.6%) |
| 25 to 34 Years | 2,118 (11.2%) | 3,651 (19.2%) |
| 35 to 44 Years | 1,397 (9.1%) | 2,058 (13.5%) |
| 45 to 54 Years | 1,193 (10.3%) | 1,784 (14.3%) |
| 55 to 64 Years | 988 (8.6%) | 1,374 (11.0%) |
| 65 to 74 Years | 800 (9.6%) | 1,173 (12.0%) |
| 75 Years and over | 394 (7.8%) | 741 (9.6%) |
| Total | 22,254 (18.3%) | 25,294 (20.2%) |
Income Above Poverty by Sex and Age in Lubbock
According to the poverty statistics in Lubbock, males aged 75 years and over and females aged 75 years and over are the age groups that are most secure financially, with 92.2% of males and 90.4% of females in these age groups living above the poverty line.
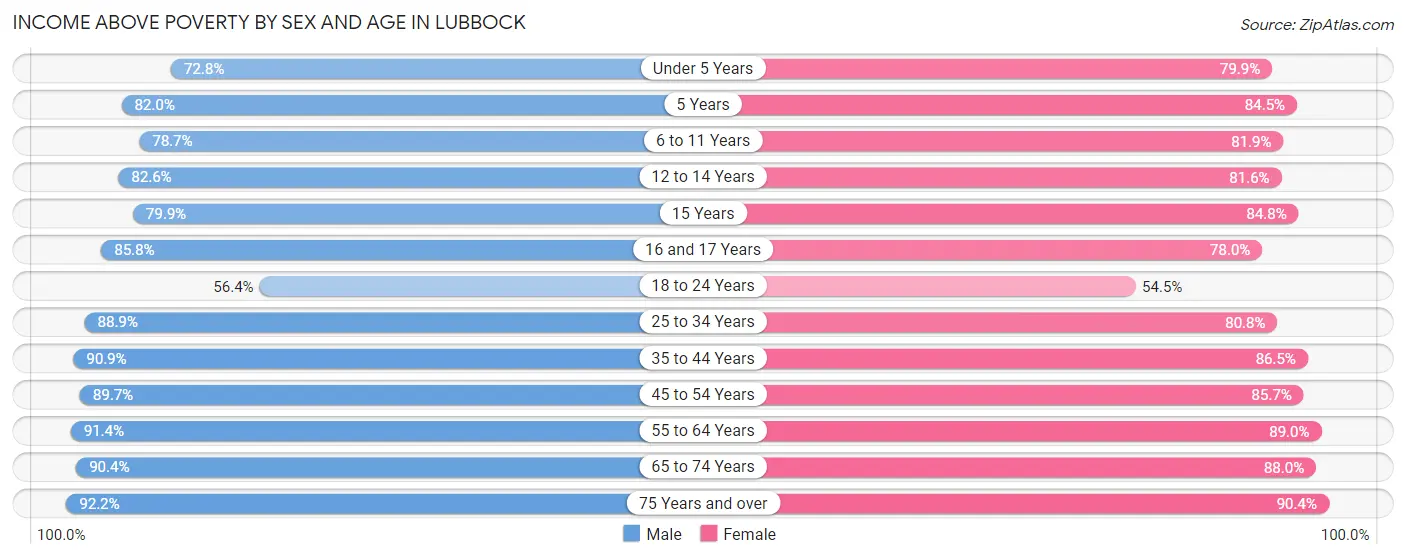
| Age Bracket | Male | Female |
| Under 5 Years | 5,941 (72.8%) | 6,587 (79.9%) |
| 5 Years | 1,422 (82.0%) | 1,316 (84.5%) |
| 6 to 11 Years | 7,821 (78.7%) | 7,231 (81.9%) |
| 12 to 14 Years | 3,926 (82.6%) | 4,308 (81.6%) |
| 15 Years | 1,204 (79.9%) | 1,419 (84.8%) |
| 16 and 17 Years | 2,819 (85.8%) | 2,609 (78.0%) |
| 18 to 24 Years | 11,807 (56.4%) | 10,821 (54.4%) |
| 25 to 34 Years | 16,882 (88.8%) | 15,398 (80.8%) |
| 35 to 44 Years | 14,026 (90.9%) | 13,148 (86.5%) |
| 45 to 54 Years | 10,428 (89.7%) | 10,705 (85.7%) |
| 55 to 64 Years | 10,528 (91.4%) | 11,116 (89.0%) |
| 65 to 74 Years | 7,544 (90.4%) | 8,612 (88.0%) |
| 75 Years and over | 4,683 (92.2%) | 6,965 (90.4%) |
| Total | 99,031 (81.7%) | 100,235 (79.8%) |
Income Below Poverty Among Married-Couple Families in Lubbock
The poverty statistics for married-couple families in Lubbock show that 5.4% or 2,171 of the total 40,123 families live below the poverty line. Families with 5 or more children have the highest poverty rate of 23.7%, comprising of 95 families. On the other hand, families with 1 or 2 children have the lowest poverty rate of 4.9%, which includes 666 families.
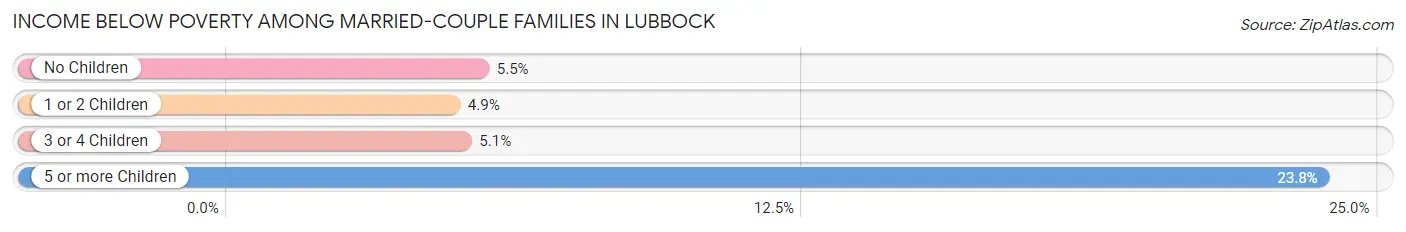
| Children | Above Poverty | Below Poverty |
| No Children | 21,108 (94.5%) | 1,224 (5.5%) |
| 1 or 2 Children | 13,077 (95.2%) | 666 (4.9%) |
| 3 or 4 Children | 3,462 (94.9%) | 186 (5.1%) |
| 5 or more Children | 305 (76.2%) | 95 (23.7%) |
| Total | 37,952 (94.6%) | 2,171 (5.4%) |
Income Below Poverty Among Single-Parent Households in Lubbock
According to the poverty data in Lubbock, 17.8% or 800 single-father households and 32.4% or 4,418 single-mother households are living below the poverty line. Among single-father households, those with 5 or more children have the highest poverty rate, with 8 households (22.9%) experiencing poverty. Likewise, among single-mother households, those with 5 or more children have the highest poverty rate, with 163 households (75.5%) falling below the poverty line.
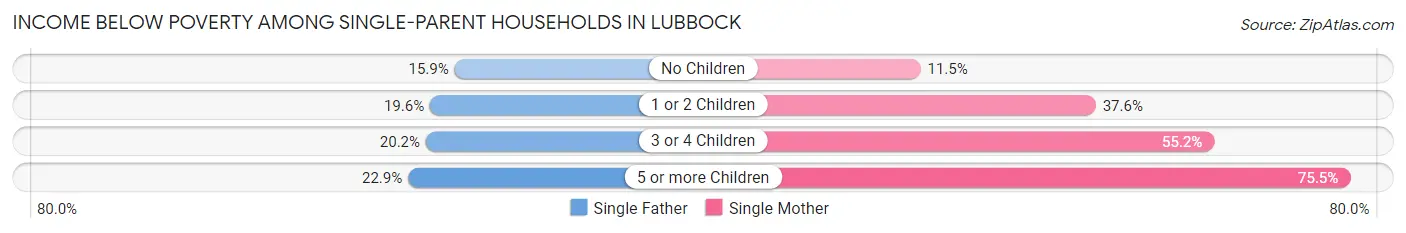
| Children | Single Father | Single Mother |
| No Children | 358 (15.9%) | 490 (11.5%) |
| 1 or 2 Children | 395 (19.6%) | 2,730 (37.6%) |
| 3 or 4 Children | 39 (20.2%) | 1,035 (55.2%) |
| 5 or more Children | 8 (22.9%) | 163 (75.5%) |
| Total | 800 (17.8%) | 4,418 (32.4%) |
Income Below Poverty Among Married-Couple vs Single-Parent Households in Lubbock
The poverty data for Lubbock shows that 2,171 of the married-couple family households (5.4%) and 5,218 of the single-parent households (28.8%) are living below the poverty level. Within the married-couple family households, those with 5 or more children have the highest poverty rate, with 95 households (23.7%) falling below the poverty line. Among the single-parent households, those with 5 or more children have the highest poverty rate, with 171 household (68.1%) living below poverty.
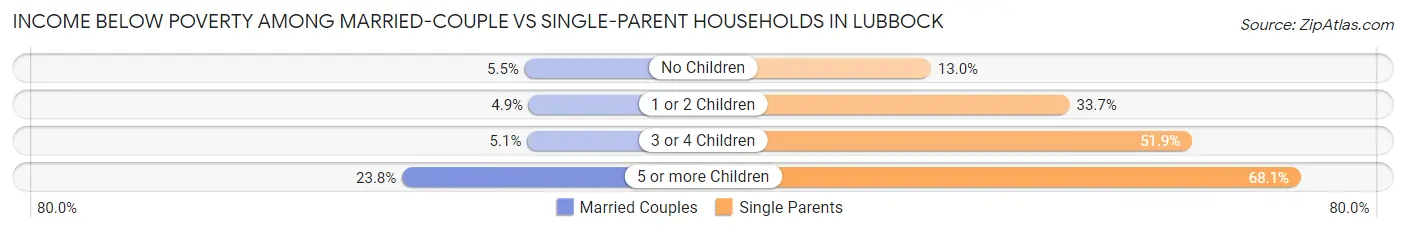
| Children | Married-Couple Families | Single-Parent Households |
| No Children | 1,224 (5.5%) | 848 (13.0%) |
| 1 or 2 Children | 666 (4.9%) | 3,125 (33.7%) |
| 3 or 4 Children | 186 (5.1%) | 1,074 (51.9%) |
| 5 or more Children | 95 (23.7%) | 171 (68.1%) |
| Total | 2,171 (5.4%) | 5,218 (28.8%) |
Race in Lubbock
The most populous races in Lubbock are White / Caucasian (174,252 | 67.5%), Hispanic or Latino (97,078 | 37.6%), and Two or more Races (35,553 | 13.8%).
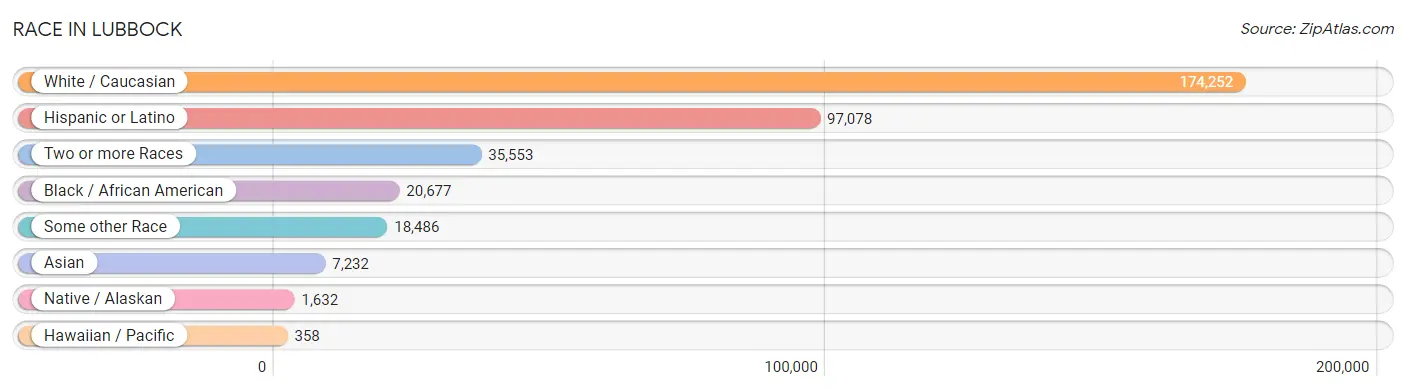
| Race | # Population | % Population |
| Asian | 7,232 | 2.8% |
| Black / African American | 20,677 | 8.0% |
| Hawaiian / Pacific | 358 | 0.1% |
| Hispanic or Latino | 97,078 | 37.6% |
| Native / Alaskan | 1,632 | 0.6% |
| White / Caucasian | 174,252 | 67.5% |
| Two or more Races | 35,553 | 13.8% |
| Some other Race | 18,486 | 7.2% |
| Total | 258,190 | 100.0% |
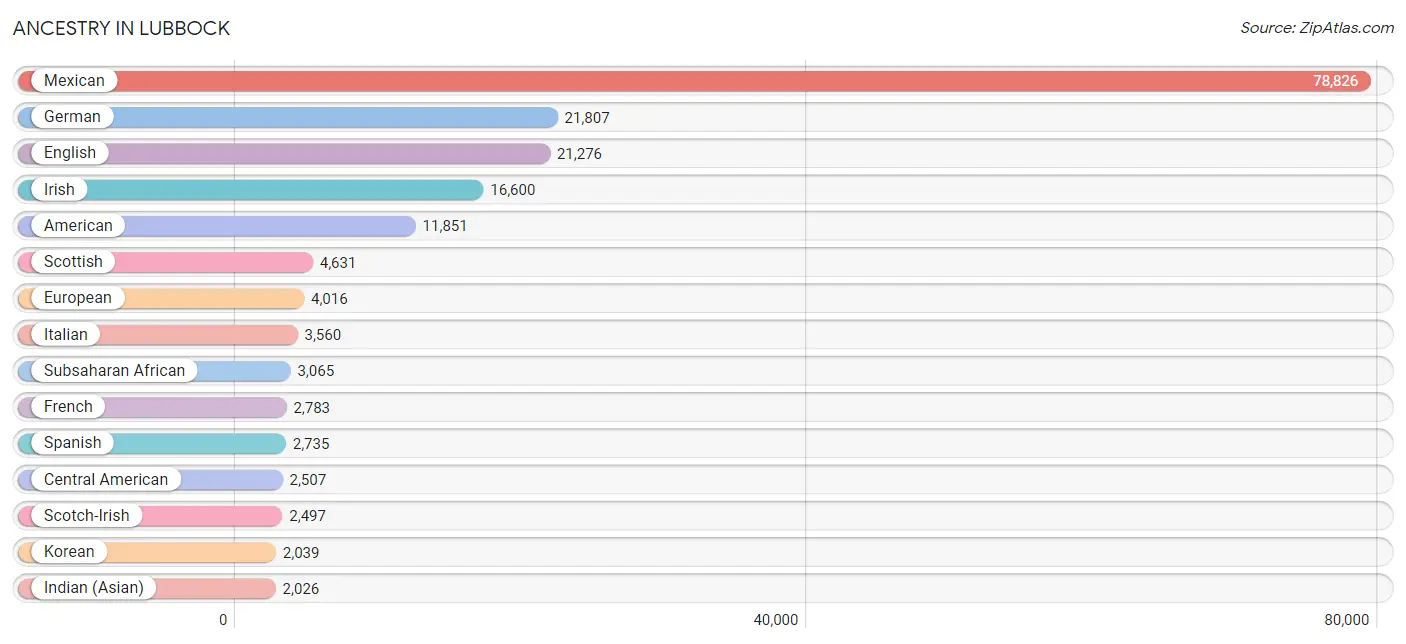
Ancestry in Lubbock
The most populous ancestries reported in Lubbock are Mexican (78,826 | 30.5%), German (21,807 | 8.5%), English (21,276 | 8.2%), Irish (16,600 | 6.4%), and American (11,851 | 4.6%), together accounting for 58.2% of all Lubbock residents.
| Ancestry | # Population | % Population |
| African | 906 | 0.4% |
| Alaska Native | 5 | 0.0% |
| Albanian | 11 | 0.0% |
| Alsatian | 14 | 0.0% |
| American | 11,851 | 4.6% |
| Apache | 214 | 0.1% |
| Arab | 1,015 | 0.4% |
| Argentinean | 41 | 0.0% |
| Armenian | 33 | 0.0% |
| Australian | 22 | 0.0% |
| Austrian | 214 | 0.1% |
| Bahamian | 7 | 0.0% |
| Barbadian | 9 | 0.0% |
| Basque | 8 | 0.0% |
| Belgian | 34 | 0.0% |
| Bhutanese | 357 | 0.1% |
| Blackfeet | 215 | 0.1% |
| Bolivian | 54 | 0.0% |
| Brazilian | 178 | 0.1% |
| British | 1,487 | 0.6% |
| Bulgarian | 14 | 0.0% |
| Burmese | 790 | 0.3% |
| Cajun | 58 | 0.0% |
| Cambodian | 9 | 0.0% |
| Canadian | 383 | 0.2% |
| Cape Verdean | 17 | 0.0% |
| Celtic | 41 | 0.0% |
| Central American | 2,507 | 1.0% |
| Central American Indian | 182 | 0.1% |
| Cherokee | 974 | 0.4% |
| Cheyenne | 41 | 0.0% |
| Chickasaw | 114 | 0.0% |
| Chilean | 72 | 0.0% |
| Chippewa | 24 | 0.0% |
| Choctaw | 381 | 0.2% |
| Colombian | 482 | 0.2% |
| Comanche | 273 | 0.1% |
| Costa Rican | 34 | 0.0% |
| Creek | 54 | 0.0% |
| Croatian | 18 | 0.0% |
| Cuban | 239 | 0.1% |
| Czech | 918 | 0.4% |
| Czechoslovakian | 186 | 0.1% |
| Danish | 248 | 0.1% |
| Dominican | 49 | 0.0% |
| Dutch | 1,161 | 0.4% |
| Dutch West Indian | 245 | 0.1% |
| Eastern European | 211 | 0.1% |
| Ecuadorian | 144 | 0.1% |
| Egyptian | 135 | 0.1% |
| English | 21,276 | 8.2% |
| Ethiopian | 744 | 0.3% |
| European | 4,016 | 1.6% |
| Fijian | 34 | 0.0% |
| Filipino | 50 | 0.0% |
| Finnish | 57 | 0.0% |
| French | 2,783 | 1.1% |
| French American Indian | 17 | 0.0% |
| French Canadian | 350 | 0.1% |
| German | 21,807 | 8.5% |
| German Russian | 76 | 0.0% |
| Ghanaian | 147 | 0.1% |
| Greek | 169 | 0.1% |
| Guamanian / Chamorro | 110 | 0.0% |
| Guatemalan | 517 | 0.2% |
| Guyanese | 3 | 0.0% |
| Haitian | 58 | 0.0% |
| Honduran | 472 | 0.2% |
| Hungarian | 148 | 0.1% |
| Indian (Asian) | 2,026 | 0.8% |
| Indonesian | 8 | 0.0% |
| Iranian | 138 | 0.1% |
| Irish | 16,600 | 6.4% |
| Israeli | 59 | 0.0% |
| Italian | 3,560 | 1.4% |
| Jamaican | 115 | 0.0% |
| Japanese | 244 | 0.1% |
| Jordanian | 50 | 0.0% |
| Kenyan | 129 | 0.1% |
| Korean | 2,039 | 0.8% |
| Laotian | 116 | 0.0% |
| Latvian | 12 | 0.0% |
| Lebanese | 342 | 0.1% |
| Lithuanian | 91 | 0.0% |
| Luxembourger | 20 | 0.0% |
| Malaysian | 38 | 0.0% |
| Menominee | 31 | 0.0% |
| Mexican | 78,826 | 30.5% |
| Mexican American Indian | 113 | 0.0% |
| Moroccan | 12 | 0.0% |
| Native Hawaiian | 221 | 0.1% |
| Navajo | 39 | 0.0% |
| Nicaraguan | 12 | 0.0% |
| Nigerian | 526 | 0.2% |
| Northern European | 339 | 0.1% |
| Norwegian | 1,331 | 0.5% |
| Pakistani | 186 | 0.1% |
| Panamanian | 86 | 0.0% |
| Paraguayan | 27 | 0.0% |
| Pennsylvania German | 210 | 0.1% |
| Peruvian | 551 | 0.2% |
| Polish | 1,090 | 0.4% |
| Portuguese | 190 | 0.1% |
| Potawatomi | 32 | 0.0% |
| Puerto Rican | 1,248 | 0.5% |
| Russian | 251 | 0.1% |
| Salvadoran | 1,386 | 0.5% |
| Samoan | 268 | 0.1% |
| Scandinavian | 704 | 0.3% |
| Scotch-Irish | 2,497 | 1.0% |
| Scottish | 4,631 | 1.8% |
| Seminole | 42 | 0.0% |
| Serbian | 11 | 0.0% |
| Shoshone | 8 | 0.0% |
| Sierra Leonean | 54 | 0.0% |
| Slavic | 10 | 0.0% |
| Slovak | 80 | 0.0% |
| Slovene | 142 | 0.1% |
| Somali | 43 | 0.0% |
| South African | 17 | 0.0% |
| South American | 1,511 | 0.6% |
| South American Indian | 36 | 0.0% |
| Spaniard | 1,705 | 0.7% |
| Spanish | 2,735 | 1.1% |
| Spanish American | 355 | 0.1% |
| Spanish American Indian | 6 | 0.0% |
| Sri Lankan | 730 | 0.3% |
| Subsaharan African | 3,065 | 1.2% |
| Swedish | 1,570 | 0.6% |
| Swiss | 497 | 0.2% |
| Thai | 1,280 | 0.5% |
| Tlingit-Haida | 8 | 0.0% |
| Tohono O'Odham | 6 | 0.0% |
| Trinidadian and Tobagonian | 46 | 0.0% |
| Turkish | 209 | 0.1% |
| U.S. Virgin Islander | 16 | 0.0% |
| Ugandan | 25 | 0.0% |
| Ukrainian | 242 | 0.1% |
| Venezuelan | 140 | 0.1% |
| Vietnamese | 89 | 0.0% |
| Welsh | 1,931 | 0.7% |
| Yaqui | 79 | 0.0% | View All 142 Rows |
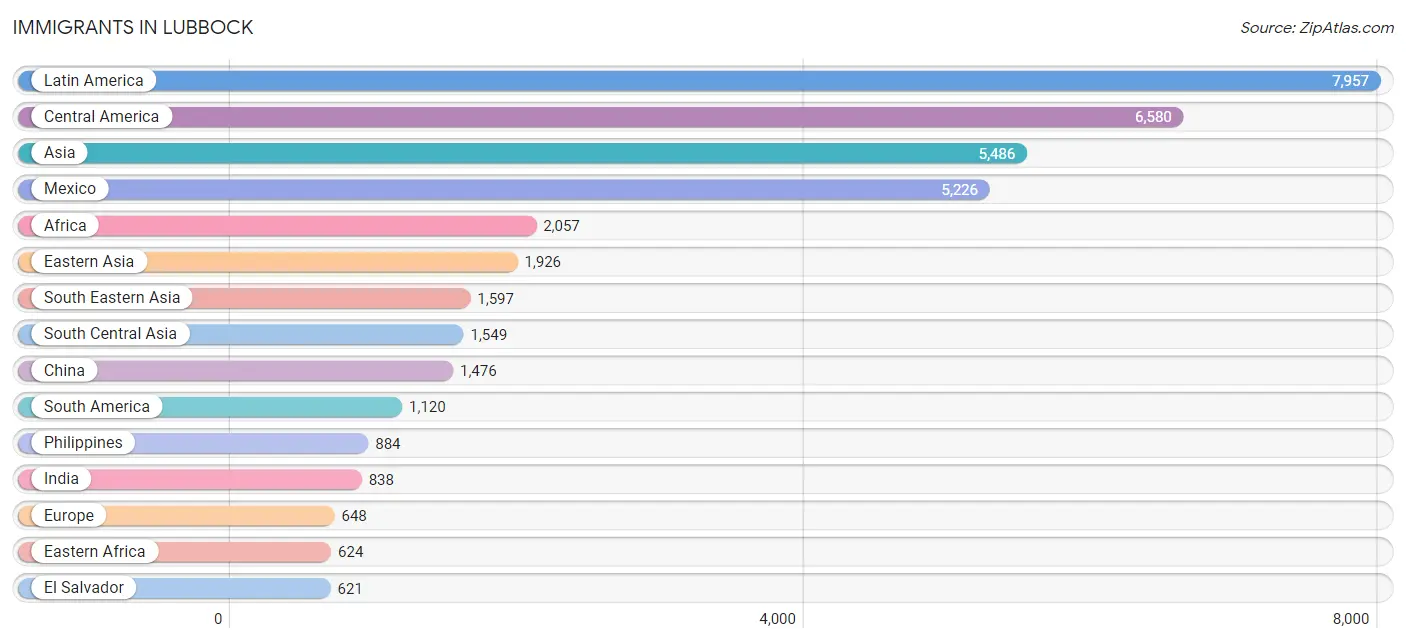
Immigrants in Lubbock
The most numerous immigrant groups reported in Lubbock came from Latin America (7,957 | 3.1%), Central America (6,580 | 2.5%), Asia (5,486 | 2.1%), Mexico (5,226 | 2.0%), and Africa (2,057 | 0.8%), together accounting for 10.6% of all Lubbock residents.
| Immigration Origin | # Population | % Population |
| Afghanistan | 5 | 0.0% |
| Africa | 2,057 | 0.8% |
| Argentina | 11 | 0.0% |
| Asia | 5,486 | 2.1% |
| Australia | 22 | 0.0% |
| Bahamas | 7 | 0.0% |
| Bangladesh | 92 | 0.0% |
| Belgium | 7 | 0.0% |
| Bolivia | 49 | 0.0% |
| Brazil | 139 | 0.1% |
| Bulgaria | 15 | 0.0% |
| Cambodia | 22 | 0.0% |
| Cameroon | 397 | 0.2% |
| Canada | 543 | 0.2% |
| Caribbean | 257 | 0.1% |
| Central America | 6,580 | 2.5% |
| Chile | 16 | 0.0% |
| China | 1,476 | 0.6% |
| Colombia | 169 | 0.1% |
| Cuba | 120 | 0.1% |
| Eastern Africa | 624 | 0.2% |
| Eastern Asia | 1,926 | 0.7% |
| Eastern Europe | 158 | 0.1% |
| Ecuador | 26 | 0.0% |
| Egypt | 181 | 0.1% |
| El Salvador | 621 | 0.2% |
| England | 84 | 0.0% |
| Ethiopia | 360 | 0.1% |
| Europe | 648 | 0.3% |
| Fiji | 9 | 0.0% |
| France | 34 | 0.0% |
| Germany | 109 | 0.0% |
| Ghana | 49 | 0.0% |
| Greece | 3 | 0.0% |
| Guatemala | 214 | 0.1% |
| Guyana | 3 | 0.0% |
| Honduras | 393 | 0.2% |
| Hong Kong | 13 | 0.0% |
| Hungary | 23 | 0.0% |
| India | 838 | 0.3% |
| Indonesia | 57 | 0.0% |
| Iran | 198 | 0.1% |
| Ireland | 10 | 0.0% |
| Israel | 36 | 0.0% |
| Italy | 15 | 0.0% |
| Jamaica | 15 | 0.0% |
| Japan | 75 | 0.0% |
| Jordan | 63 | 0.0% |
| Kenya | 142 | 0.1% |
| Korea | 375 | 0.2% |
| Kuwait | 42 | 0.0% |
| Latin America | 7,957 | 3.1% |
| Lebanon | 78 | 0.0% |
| Lithuania | 13 | 0.0% |
| Malaysia | 12 | 0.0% |
| Mexico | 5,226 | 2.0% |
| Micronesia | 8 | 0.0% |
| Middle Africa | 414 | 0.2% |
| Morocco | 10 | 0.0% |
| Nepal | 203 | 0.1% |
| Netherlands | 12 | 0.0% |
| Nicaragua | 28 | 0.0% |
| Nigeria | 368 | 0.1% |
| Northern Africa | 367 | 0.1% |
| Northern Europe | 261 | 0.1% |
| Norway | 21 | 0.0% |
| Oceania | 113 | 0.0% |
| Pakistan | 86 | 0.0% |
| Panama | 98 | 0.0% |
| Peru | 334 | 0.1% |
| Philippines | 884 | 0.3% |
| Poland | 39 | 0.0% |
| Russia | 39 | 0.0% |
| Saudi Arabia | 45 | 0.0% |
| Singapore | 6 | 0.0% |
| South Africa | 63 | 0.0% |
| South America | 1,120 | 0.4% |
| South Central Asia | 1,549 | 0.6% |
| South Eastern Asia | 1,597 | 0.6% |
| Southern Europe | 67 | 0.0% |
| Spain | 49 | 0.0% |
| Sri Lanka | 127 | 0.1% |
| Sudan | 41 | 0.0% |
| Sweden | 62 | 0.0% |
| Taiwan | 114 | 0.0% |
| Thailand | 135 | 0.1% |
| Trinidad and Tobago | 115 | 0.0% |
| Turkey | 117 | 0.1% |
| Uganda | 25 | 0.0% |
| Ukraine | 18 | 0.0% |
| Venezuela | 373 | 0.1% |
| Vietnam | 473 | 0.2% |
| Western Africa | 417 | 0.2% |
| Western Asia | 405 | 0.2% |
| Western Europe | 162 | 0.1% |
| Yemen | 15 | 0.0% |
| Zimbabwe | 35 | 0.0% | View All 97 Rows |
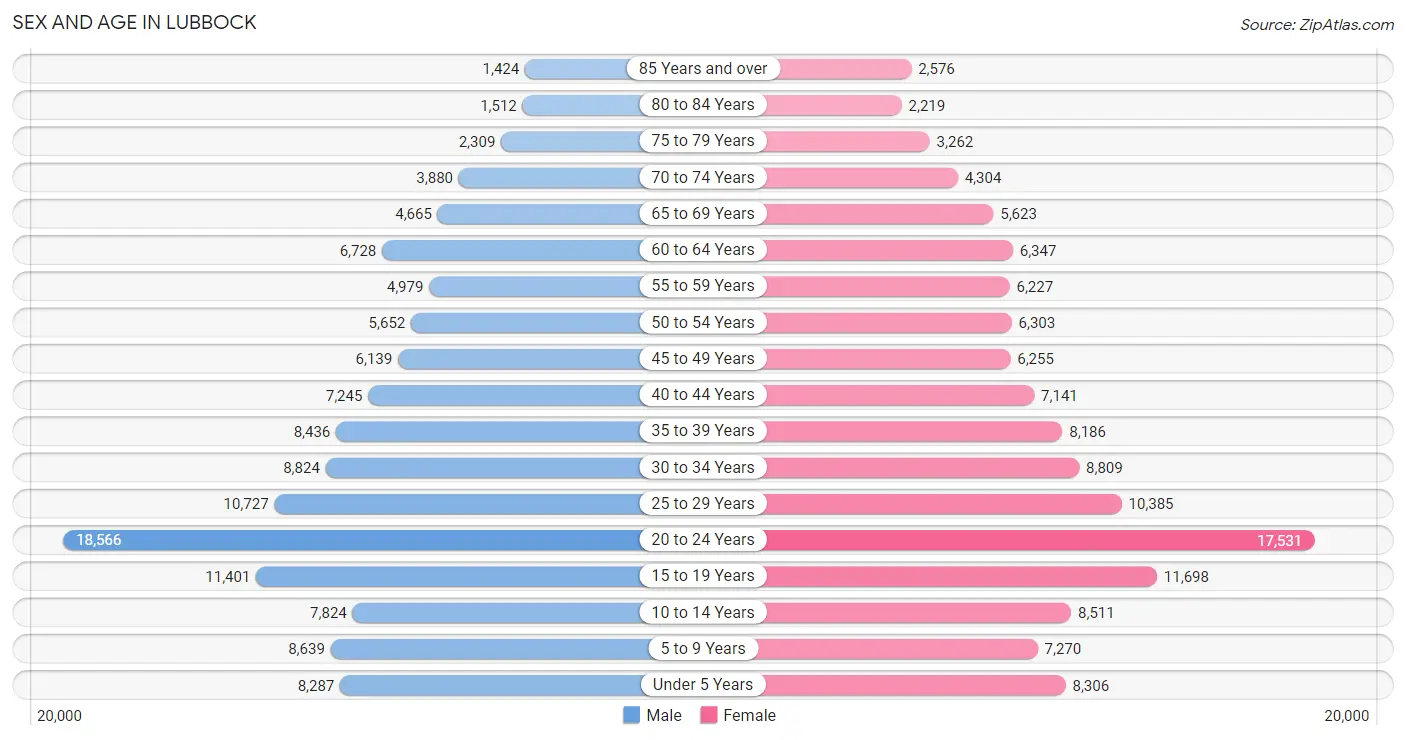
Sex and Age in Lubbock
Sex and Age in Lubbock
The most populous age groups in Lubbock are 20 to 24 Years (18,566 | 14.6%) for men and 20 to 24 Years (17,531 | 13.4%) for women.
| Age Bracket | Male | Female |
| Under 5 Years | 8,287 (6.5%) | 8,306 (6.3%) |
| 5 to 9 Years | 8,639 (6.8%) | 7,270 (5.6%) |
| 10 to 14 Years | 7,824 (6.1%) | 8,511 (6.5%) |
| 15 to 19 Years | 11,401 (9.0%) | 11,698 (8.9%) |
| 20 to 24 Years | 18,566 (14.6%) | 17,531 (13.4%) |
| 25 to 29 Years | 10,727 (8.4%) | 10,385 (7.9%) |
| 30 to 34 Years | 8,824 (6.9%) | 8,809 (6.7%) |
| 35 to 39 Years | 8,436 (6.6%) | 8,186 (6.2%) |
| 40 to 44 Years | 7,245 (5.7%) | 7,141 (5.4%) |
| 45 to 49 Years | 6,139 (4.8%) | 6,255 (4.8%) |
| 50 to 54 Years | 5,652 (4.4%) | 6,303 (4.8%) |
| 55 to 59 Years | 4,979 (3.9%) | 6,227 (4.8%) |
| 60 to 64 Years | 6,728 (5.3%) | 6,347 (4.9%) |
| 65 to 69 Years | 4,665 (3.7%) | 5,623 (4.3%) |
| 70 to 74 Years | 3,880 (3.0%) | 4,304 (3.3%) |
| 75 to 79 Years | 2,309 (1.8%) | 3,262 (2.5%) |
| 80 to 84 Years | 1,512 (1.2%) | 2,219 (1.7%) |
| 85 Years and over | 1,424 (1.1%) | 2,576 (2.0%) |
| Total | 127,237 (100.0%) | 130,953 (100.0%) |
Families and Households in Lubbock
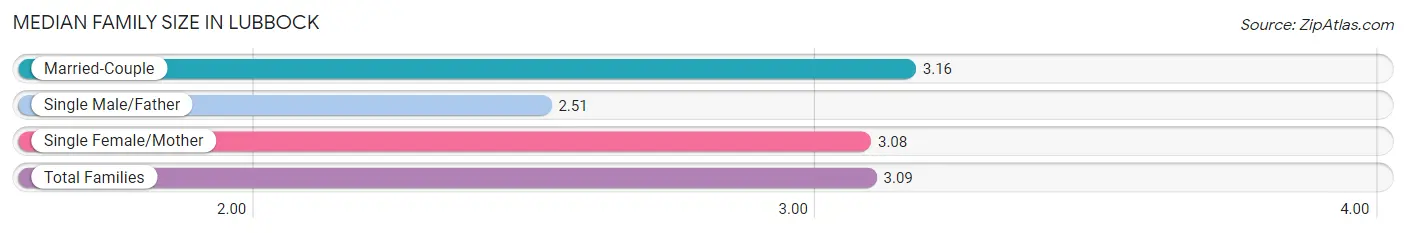
Median Family Size in Lubbock
The median family size in Lubbock is 3.09 persons per family, with married-couple families (40,123 | 68.9%) accounting for the largest median family size of 3.16 persons per family. On the other hand, single male/father families (4,490 | 7.7%) represent the smallest median family size with 2.51 persons per family.
| Family Type | # Families | Family Size |
| Married-Couple | 40,123 (68.9%) | 3.16 |
| Single Male/Father | 4,490 (7.7%) | 2.51 |
| Single Female/Mother | 13,636 (23.4%) | 3.08 |
| Total Families | 58,249 (100.0%) | 3.09 |
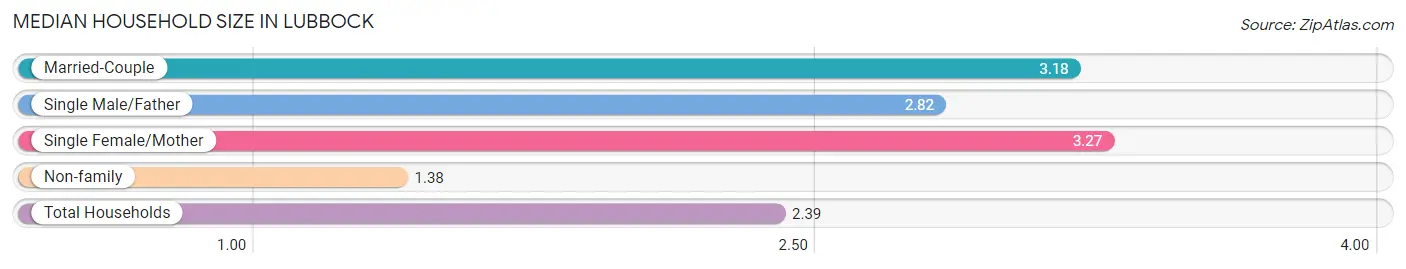
Median Household Size in Lubbock
The median household size in Lubbock is 2.39 persons per household, with single female/mother households (13,636 | 13.3%) accounting for the largest median household size of 3.27 persons per household. non-family households (44,645 | 43.4%) represent the smallest median household size with 1.38 persons per household.
| Household Type | # Households | Household Size |
| Married-Couple | 40,123 (39.0%) | 3.18 |
| Single Male/Father | 4,490 (4.4%) | 2.82 |
| Single Female/Mother | 13,636 (13.3%) | 3.27 |
| Non-family | 44,645 (43.4%) | 1.38 |
| Total Households | 102,894 (100.0%) | 2.39 |
Household Size by Marriage Status in Lubbock
Out of a total of 102,894 households in Lubbock, 58,249 (56.6%) are family households, while 44,645 (43.4%) are nonfamily households. The most numerous type of family households are 2-person households, comprising 25,450, and the most common type of nonfamily households are 1-person households, comprising 32,102.
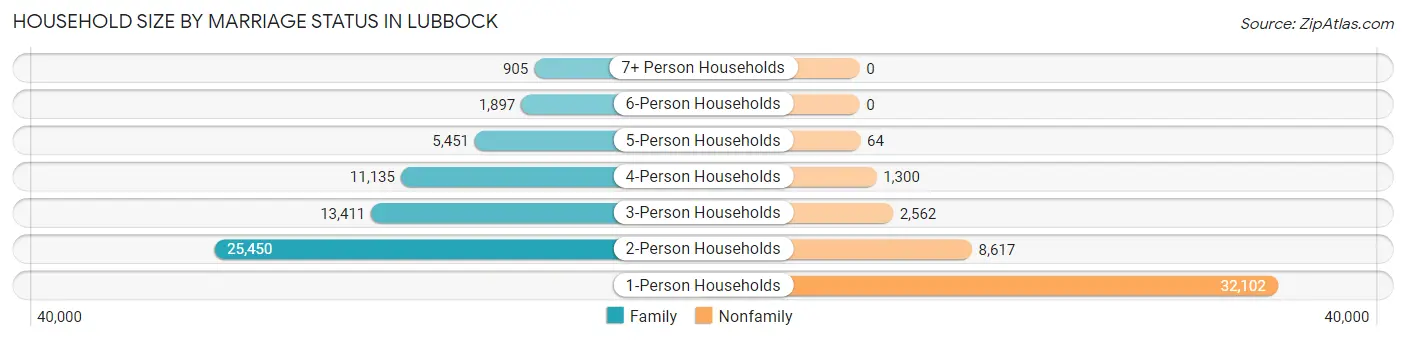
| Household Size | Family Households | Nonfamily Households |
| 1-Person Households | - | 32,102 (31.2%) |
| 2-Person Households | 25,450 (24.7%) | 8,617 (8.4%) |
| 3-Person Households | 13,411 (13.0%) | 2,562 (2.5%) |
| 4-Person Households | 11,135 (10.8%) | 1,300 (1.3%) |
| 5-Person Households | 5,451 (5.3%) | 64 (0.1%) |
| 6-Person Households | 1,897 (1.8%) | 0 (0.0%) |
| 7+ Person Households | 905 (0.9%) | 0 (0.0%) |
| Total | 58,249 (56.6%) | 44,645 (43.4%) |
Female Fertility in Lubbock
Fertility by Age in Lubbock
Average fertility rate in Lubbock is 56.0 births per 1,000 women. Women in the age bracket of 20 to 34 years have the highest fertility rate with 88.0 births per 1,000 women. Women in the age bracket of 20 to 34 years acount for 80.2% of all women with births.
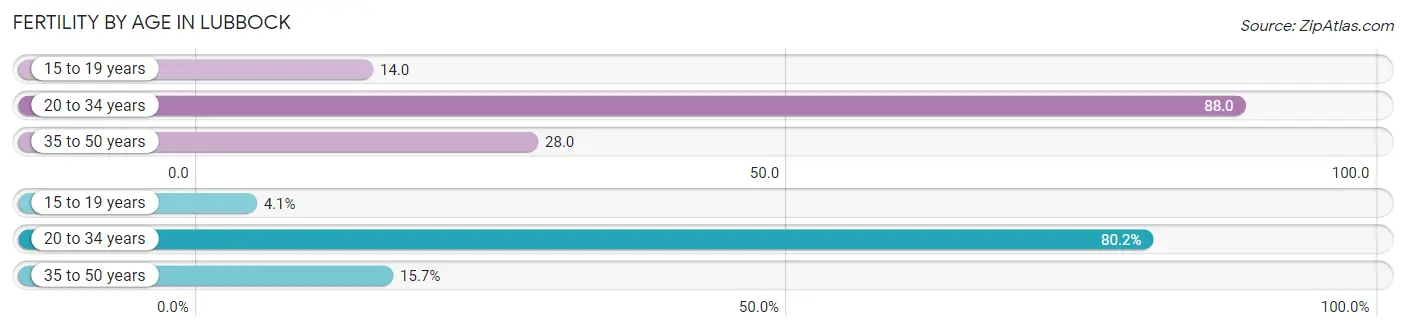
| Age Bracket | Women with Births | Births / 1,000 Women |
| 15 to 19 years | 166 (4.1%) | 14.0 |
| 20 to 34 years | 3,223 (80.2%) | 88.0 |
| 35 to 50 years | 631 (15.7%) | 28.0 |
| Total | 4,020 (100.0%) | 56.0 |
Fertility by Age by Marriage Status in Lubbock
58.3% of women with births (4,020) in Lubbock are married. The highest percentage of unmarried women with births falls into 15 to 19 years age bracket with 51.8% of them unmarried at the time of birth, while the lowest percentage of unmarried women with births belong to 35 to 50 years age bracket with 33.0% of them unmarried.
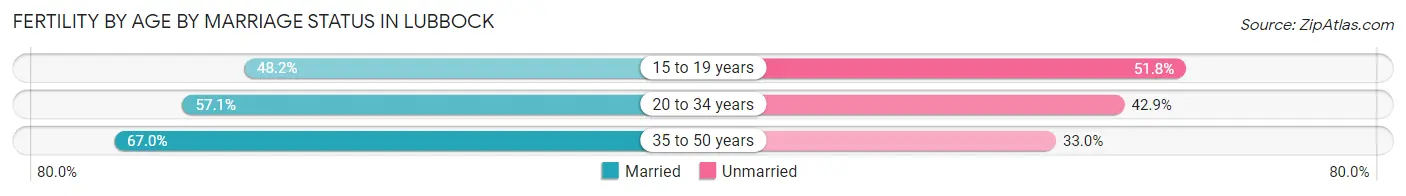
| Age Bracket | Married | Unmarried |
| 15 to 19 years | 80 (48.2%) | 86 (51.8%) |
| 20 to 34 years | 1,840 (57.1%) | 1,383 (42.9%) |
| 35 to 50 years | 423 (67.0%) | 208 (33.0%) |
| Total | 2,344 (58.3%) | 1,676 (41.7%) |
Fertility by Education in Lubbock
Average fertility rate in Lubbock is 56.0 births per 1,000 women. Women with the education attainment of graduate degree have the highest fertility rate of 71.0 births per 1,000 women, while women with the education attainment of college or associate's degree have the lowest fertility at 48.0 births per 1,000 women. Women with the education attainment of college or associate's degree represent 30.9% of all women with births.
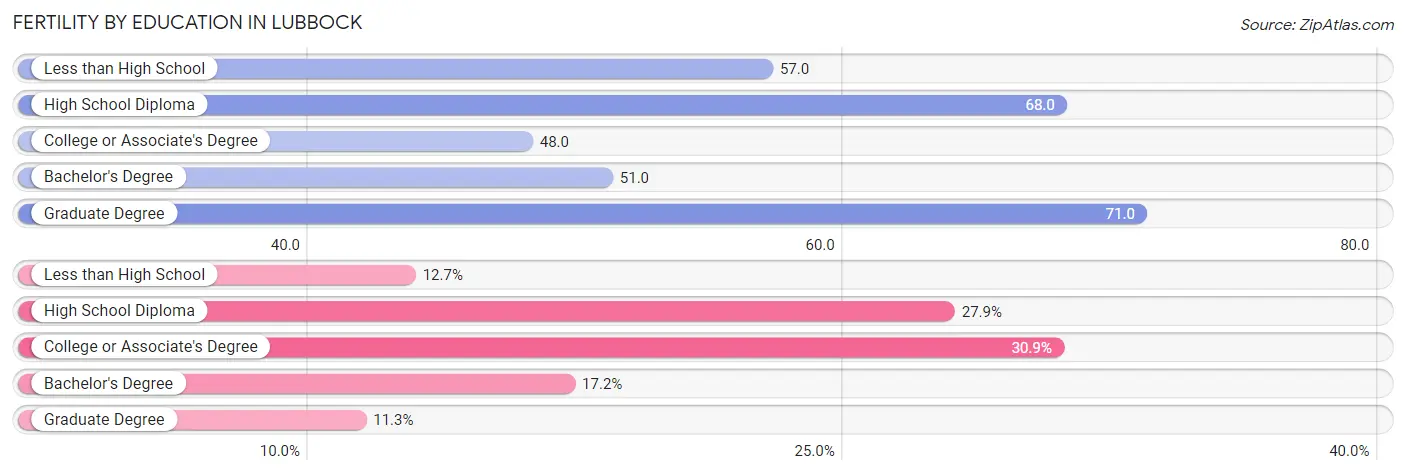
| Educational Attainment | Women with Births | Births / 1,000 Women |
| Less than High School | 511 (12.7%) | 57.0 |
| High School Diploma | 1,120 (27.9%) | 68.0 |
| College or Associate's Degree | 1,243 (30.9%) | 48.0 |
| Bachelor's Degree | 691 (17.2%) | 51.0 |
| Graduate Degree | 455 (11.3%) | 71.0 |
| Total | 4,020 (100.0%) | 56.0 |
Fertility by Education by Marriage Status in Lubbock
41.7% of women with births in Lubbock are unmarried. Women with the educational attainment of graduate degree are most likely to be married with 95.0% of them married at childbirth, while women with the educational attainment of less than high school are least likely to be married with 69.3% of them unmarried at childbirth.
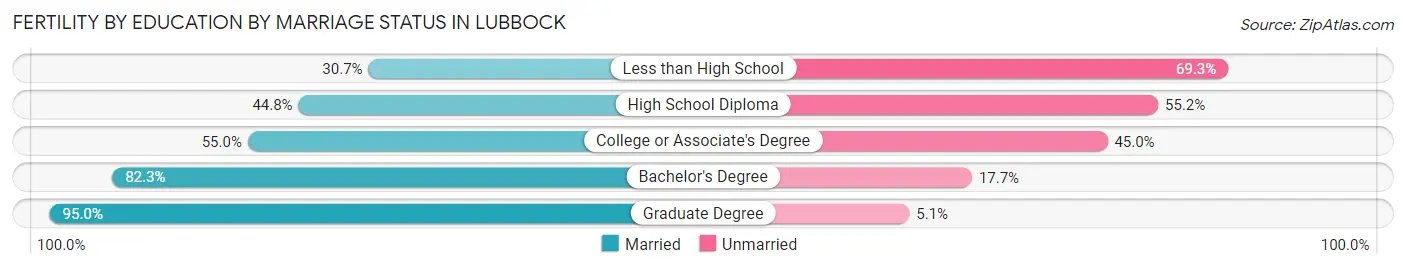
| Educational Attainment | Married | Unmarried |
| Less than High School | 157 (30.7%) | 354 (69.3%) |
| High School Diploma | 502 (44.8%) | 618 (55.2%) |
| College or Associate's Degree | 684 (55.0%) | 559 (45.0%) |
| Bachelor's Degree | 569 (82.3%) | 122 (17.7%) |
| Graduate Degree | 432 (95.0%) | 23 (5.1%) |
| Total | 2,344 (58.3%) | 1,676 (41.7%) |
Employment Characteristics in Lubbock
Employment by Class of Employer in Lubbock
Among the 127,119 employed individuals in Lubbock, private company employees (83,739 | 65.9%), state government employees (11,665 | 9.2%), and not-for-profit organizations (9,673 | 7.6%) make up the most common classes of employment.
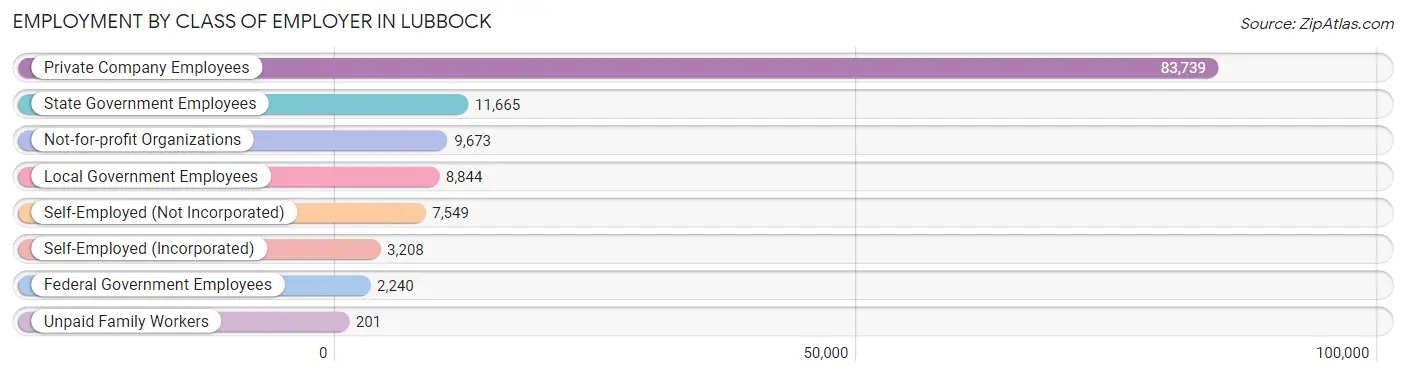
| Employer Class | # Employees | % Employees |
| Private Company Employees | 83,739 | 65.9% |
| Self-Employed (Incorporated) | 3,208 | 2.5% |
| Self-Employed (Not Incorporated) | 7,549 | 5.9% |
| Not-for-profit Organizations | 9,673 | 7.6% |
| Local Government Employees | 8,844 | 7.0% |
| State Government Employees | 11,665 | 9.2% |
| Federal Government Employees | 2,240 | 1.8% |
| Unpaid Family Workers | 201 | 0.2% |
| Total | 127,119 | 100.0% |
Employment Status by Age in Lubbock
According to the labor force statistics for Lubbock, out of the total population over 16 years of age (206,123), 65.8% or 135,629 individuals are in the labor force, with 4.6% or 6,239 of them unemployed. The age group with the highest labor force participation rate is 30 to 34 years, with 85.4% or 15,059 individuals in the labor force. Within the labor force, the 16 to 19 years age range has the highest percentage of unemployed individuals, with 12.6% or 946 of them being unemployed.
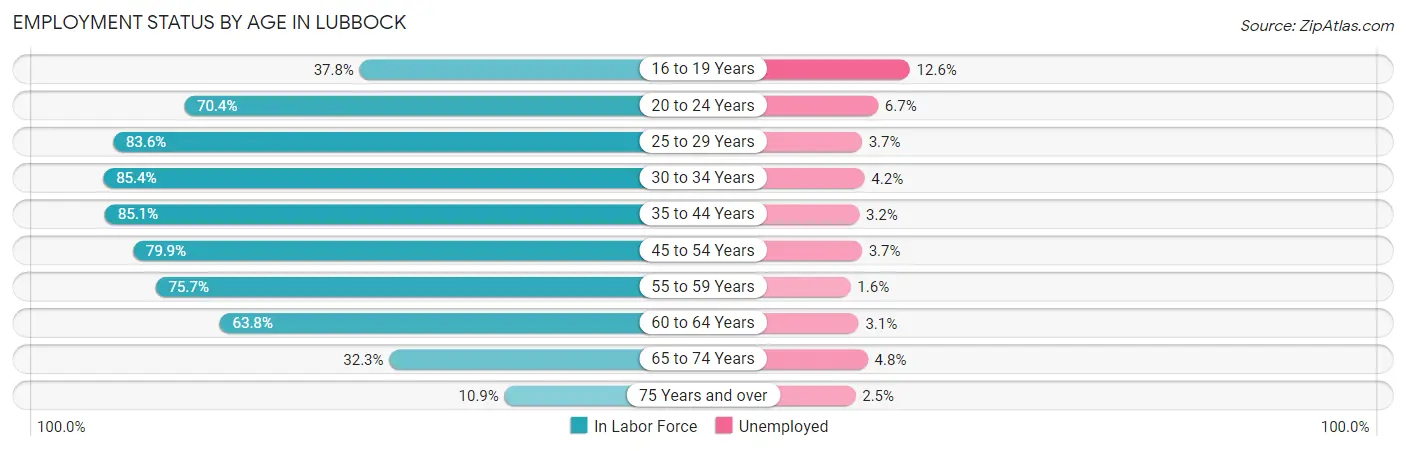
| Age Bracket | In Labor Force | Unemployed |
| 16 to 19 Years | 7,510 (37.8%) | 946 (12.6%) |
| 20 to 24 Years | 25,412 (70.4%) | 1,703 (6.7%) |
| 25 to 29 Years | 17,650 (83.6%) | 653 (3.7%) |
| 30 to 34 Years | 15,059 (85.4%) | 632 (4.2%) |
| 35 to 44 Years | 26,388 (85.1%) | 844 (3.2%) |
| 45 to 54 Years | 19,455 (79.9%) | 720 (3.7%) |
| 55 to 59 Years | 8,483 (75.7%) | 136 (1.6%) |
| 60 to 64 Years | 8,342 (63.8%) | 259 (3.1%) |
| 65 to 74 Years | 5,966 (32.3%) | 286 (4.8%) |
| 75 Years and over | 1,450 (10.9%) | 36 (2.5%) |
| Total | 135,629 (65.8%) | 6,239 (4.6%) |
Employment Status by Educational Attainment in Lubbock
According to labor force statistics for Lubbock, 80.6% of individuals (95,417) out of the total population between 25 and 64 years of age (118,383) are in the labor force, with 3.4% or 3,244 of them being unemployed. The group with the highest labor force participation rate are those with the educational attainment of bachelor's degree or higher, with 86.0% or 34,850 individuals in the labor force. Within the labor force, individuals with high school diploma education have the highest percentage of unemployment, with 4.7% or 1,060 of them being unemployed.
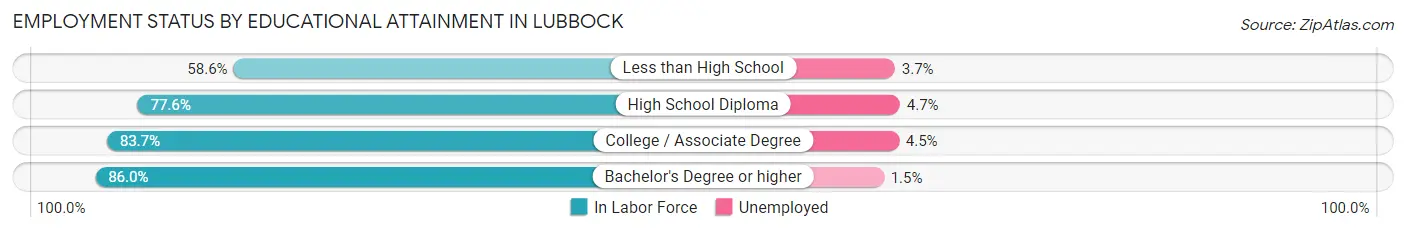
| Educational Attainment | In Labor Force | Unemployed |
| Less than High School | 6,769 (58.6%) | 427 (3.7%) |
| High School Diploma | 22,561 (77.6%) | 1,366 (4.7%) |
| College / Associate Degree | 31,166 (83.7%) | 1,676 (4.5%) |
| Bachelor's Degree or higher | 34,850 (86.0%) | 608 (1.5%) |
| Total | 95,417 (80.6%) | 4,025 (3.4%) |
Employment Occupations by Sex in Lubbock
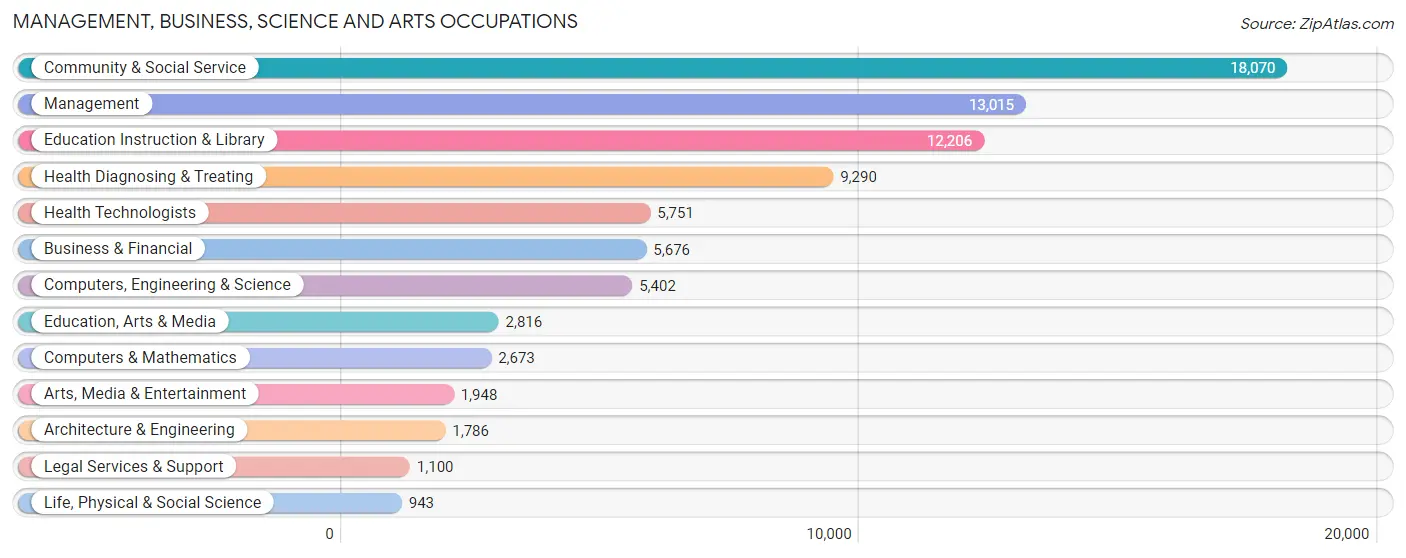
Management, Business, Science and Arts Occupations
The most common Management, Business, Science and Arts occupations in Lubbock are Community & Social Service (18,070 | 14.0%), Management (13,015 | 10.1%), Education Instruction & Library (12,206 | 9.5%), Health Diagnosing & Treating (9,290 | 7.2%), and Health Technologists (5,751 | 4.4%).
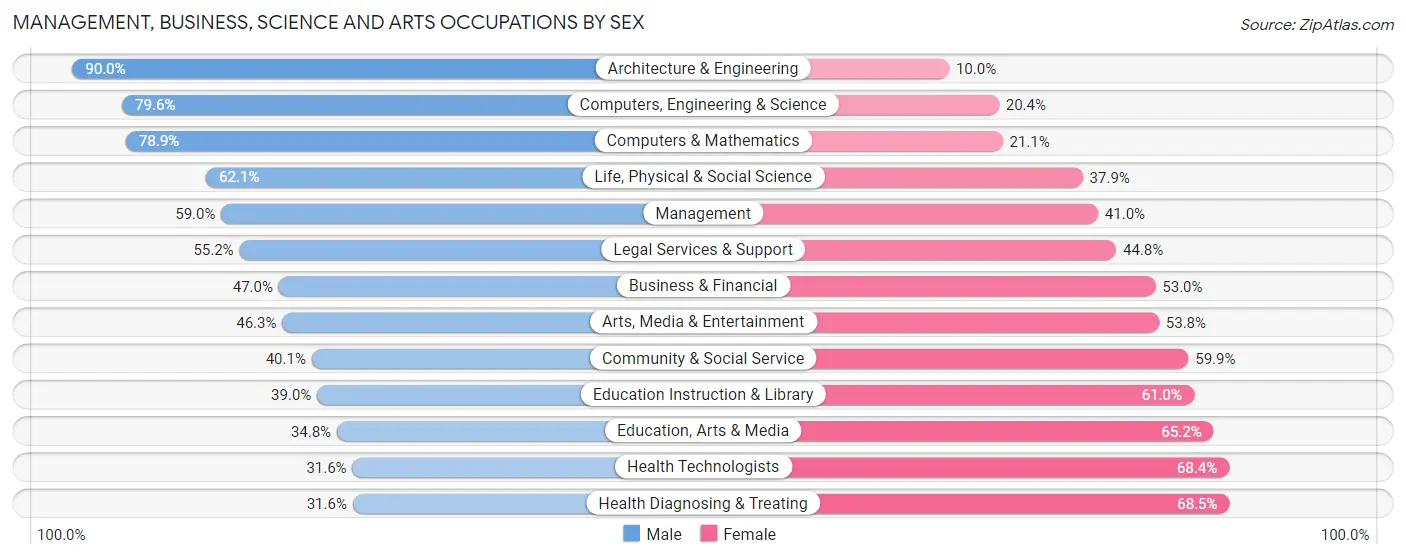
Management, Business, Science and Arts Occupations by Sex
Within the Management, Business, Science and Arts occupations in Lubbock, the most male-oriented occupations are Architecture & Engineering (90.0%), Computers, Engineering & Science (79.6%), and Computers & Mathematics (78.9%), while the most female-oriented occupations are Health Diagnosing & Treating (68.4%), Health Technologists (68.4%), and Education, Arts & Media (65.2%).
| Occupation | Male | Female |
| Management | 7,673 (59.0%) | 5,342 (41.0%) |
| Business & Financial | 2,666 (47.0%) | 3,010 (53.0%) |
| Computers, Engineering & Science | 4,302 (79.6%) | 1,100 (20.4%) |
| Computers & Mathematics | 2,108 (78.9%) | 565 (21.1%) |
| Architecture & Engineering | 1,608 (90.0%) | 178 (10.0%) |
| Life, Physical & Social Science | 586 (62.1%) | 357 (37.9%) |
| Community & Social Service | 7,246 (40.1%) | 10,824 (59.9%) |
| Education, Arts & Media | 981 (34.8%) | 1,835 (65.2%) |
| Legal Services & Support | 607 (55.2%) | 493 (44.8%) |
| Education Instruction & Library | 4,757 (39.0%) | 7,449 (61.0%) |
| Arts, Media & Entertainment | 901 (46.3%) | 1,047 (53.7%) |
| Health Diagnosing & Treating | 2,931 (31.6%) | 6,359 (68.4%) |
| Health Technologists | 1,818 (31.6%) | 3,933 (68.4%) |
| Total (Category) | 24,818 (48.2%) | 26,635 (51.8%) |
| Total (Overall) | 67,714 (52.4%) | 61,497 (47.6%) |
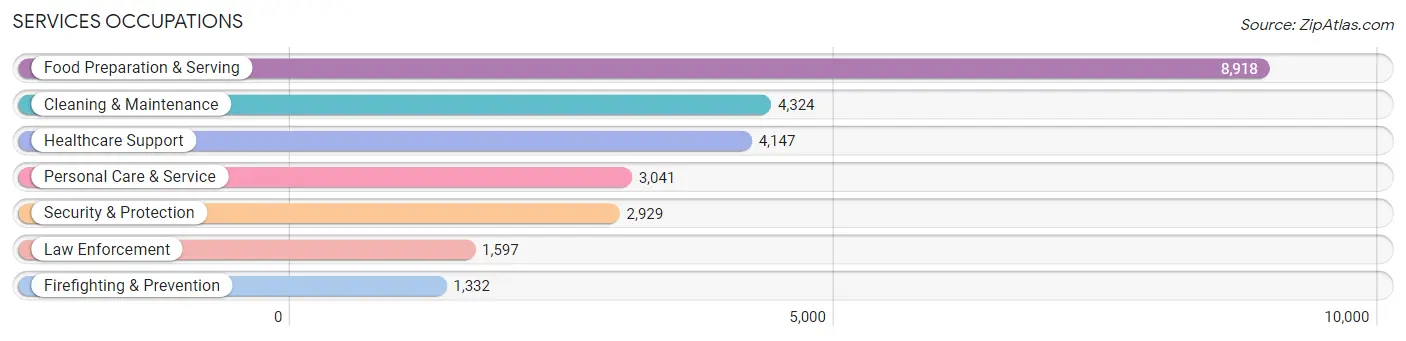
Services Occupations
The most common Services occupations in Lubbock are Food Preparation & Serving (8,918 | 6.9%), Cleaning & Maintenance (4,324 | 3.4%), Healthcare Support (4,147 | 3.2%), Personal Care & Service (3,041 | 2.4%), and Security & Protection (2,929 | 2.3%).
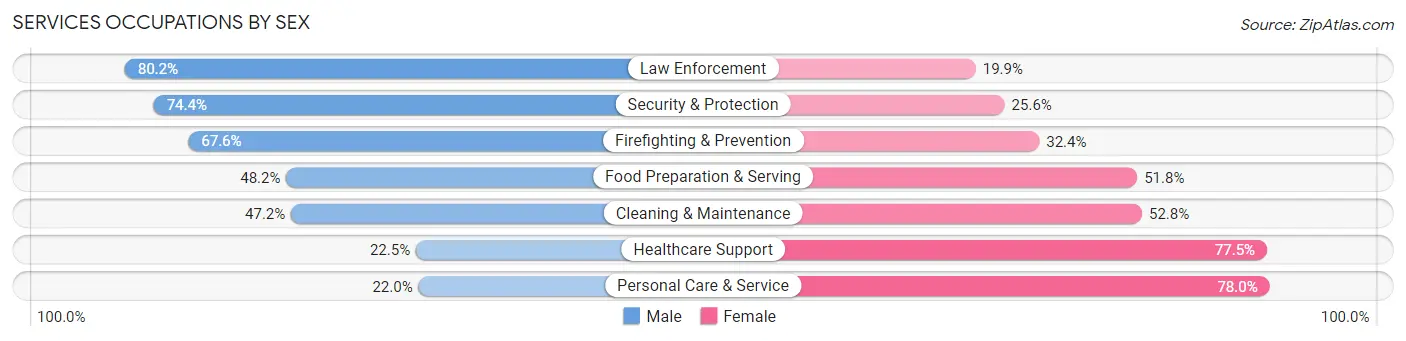
Services Occupations by Sex
Within the Services occupations in Lubbock, the most male-oriented occupations are Law Enforcement (80.1%), Security & Protection (74.4%), and Firefighting & Prevention (67.6%), while the most female-oriented occupations are Personal Care & Service (78.0%), Healthcare Support (77.5%), and Cleaning & Maintenance (52.8%).
| Occupation | Male | Female |
| Healthcare Support | 933 (22.5%) | 3,214 (77.5%) |
| Security & Protection | 2,180 (74.4%) | 749 (25.6%) |
| Firefighting & Prevention | 900 (67.6%) | 432 (32.4%) |
| Law Enforcement | 1,280 (80.1%) | 317 (19.9%) |
| Food Preparation & Serving | 4,297 (48.2%) | 4,621 (51.8%) |
| Cleaning & Maintenance | 2,042 (47.2%) | 2,282 (52.8%) |
| Personal Care & Service | 669 (22.0%) | 2,372 (78.0%) |
| Total (Category) | 10,121 (43.3%) | 13,238 (56.7%) |
| Total (Overall) | 67,714 (52.4%) | 61,497 (47.6%) |
Sales and Office Occupations
The most common Sales and Office occupations in Lubbock are Office & Administration (15,066 | 11.7%), and Sales & Related (14,160 | 11.0%).

Sales and Office Occupations by Sex
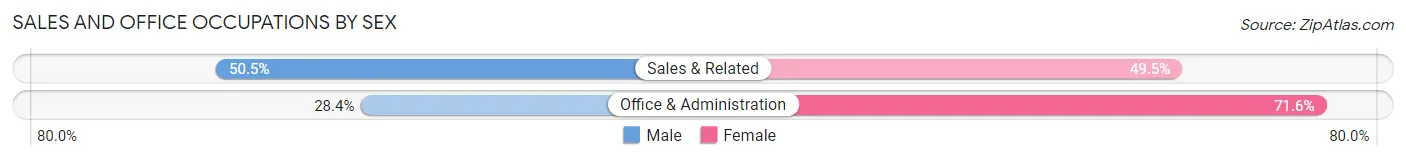
| Occupation | Male | Female |
| Sales & Related | 7,155 (50.5%) | 7,005 (49.5%) |
| Office & Administration | 4,273 (28.4%) | 10,793 (71.6%) |
| Total (Category) | 11,428 (39.1%) | 17,798 (60.9%) |
| Total (Overall) | 67,714 (52.4%) | 61,497 (47.6%) |
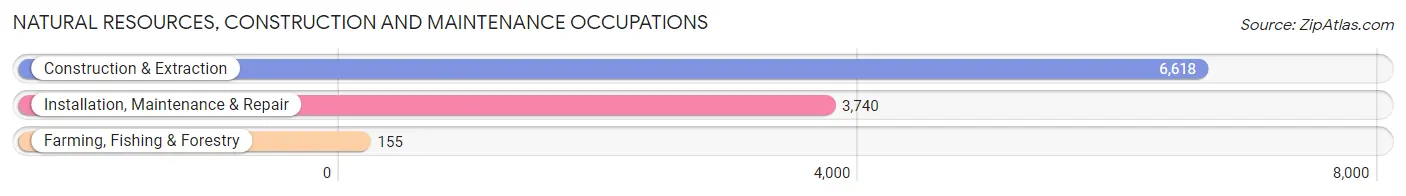
Natural Resources, Construction and Maintenance Occupations
The most common Natural Resources, Construction and Maintenance occupations in Lubbock are Construction & Extraction (6,618 | 5.1%), Installation, Maintenance & Repair (3,740 | 2.9%), and Farming, Fishing & Forestry (155 | 0.1%).
Natural Resources, Construction and Maintenance Occupations by Sex
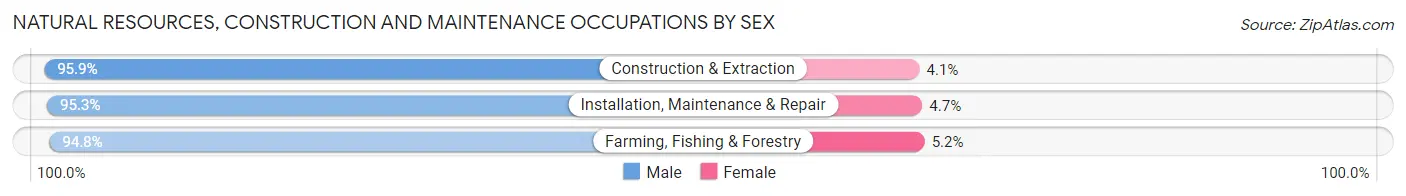
| Occupation | Male | Female |
| Farming, Fishing & Forestry | 147 (94.8%) | 8 (5.2%) |
| Construction & Extraction | 6,347 (95.9%) | 271 (4.1%) |
| Installation, Maintenance & Repair | 3,565 (95.3%) | 175 (4.7%) |
| Total (Category) | 10,059 (95.7%) | 454 (4.3%) |
| Total (Overall) | 67,714 (52.4%) | 61,497 (47.6%) |
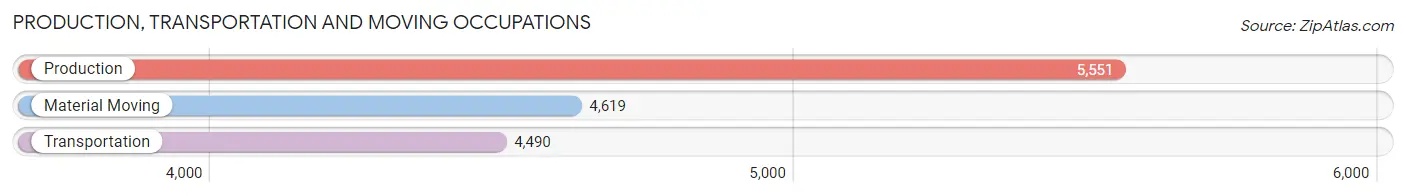
Production, Transportation and Moving Occupations
The most common Production, Transportation and Moving occupations in Lubbock are Production (5,551 | 4.3%), Material Moving (4,619 | 3.6%), and Transportation (4,490 | 3.5%).
Production, Transportation and Moving Occupations by Sex
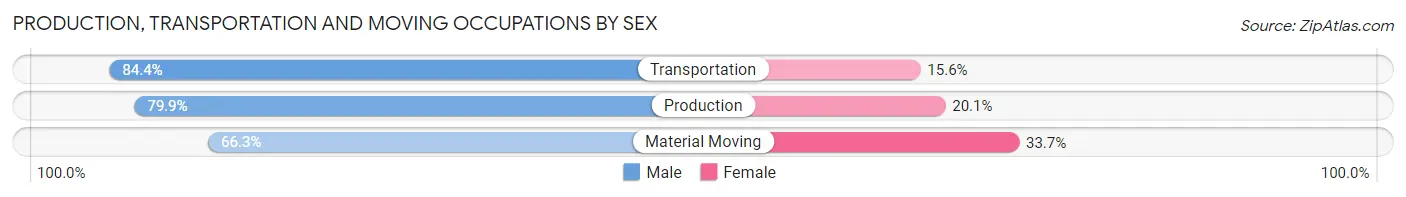
| Occupation | Male | Female |
| Production | 4,433 (79.9%) | 1,118 (20.1%) |
| Transportation | 3,791 (84.4%) | 699 (15.6%) |
| Material Moving | 3,064 (66.3%) | 1,555 (33.7%) |
| Total (Category) | 11,288 (77.0%) | 3,372 (23.0%) |
| Total (Overall) | 67,714 (52.4%) | 61,497 (47.6%) |
Employment Industries by Sex in Lubbock
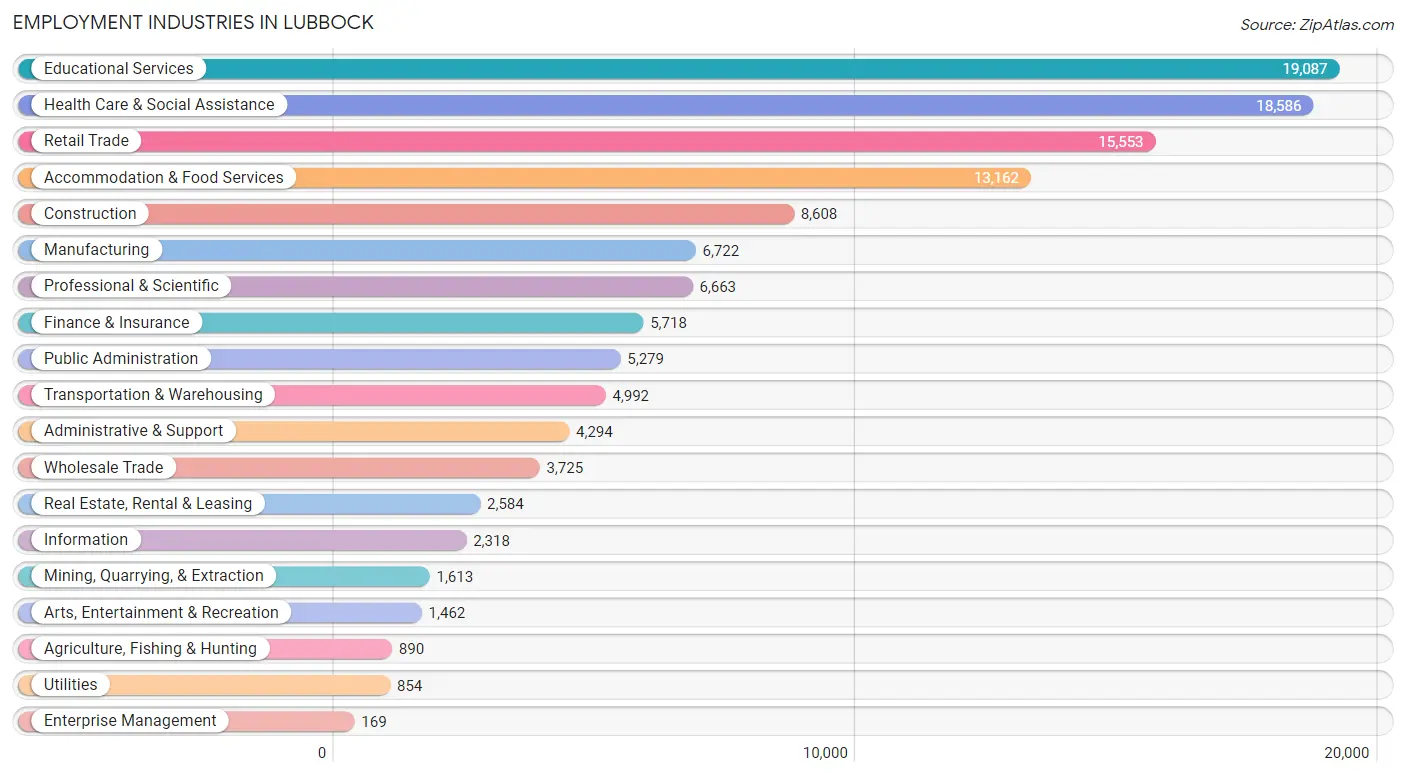
Employment Industries in Lubbock
The major employment industries in Lubbock include Educational Services (19,087 | 14.8%), Health Care & Social Assistance (18,586 | 14.4%), Retail Trade (15,553 | 12.0%), Accommodation & Food Services (13,162 | 10.2%), and Construction (8,608 | 6.7%).
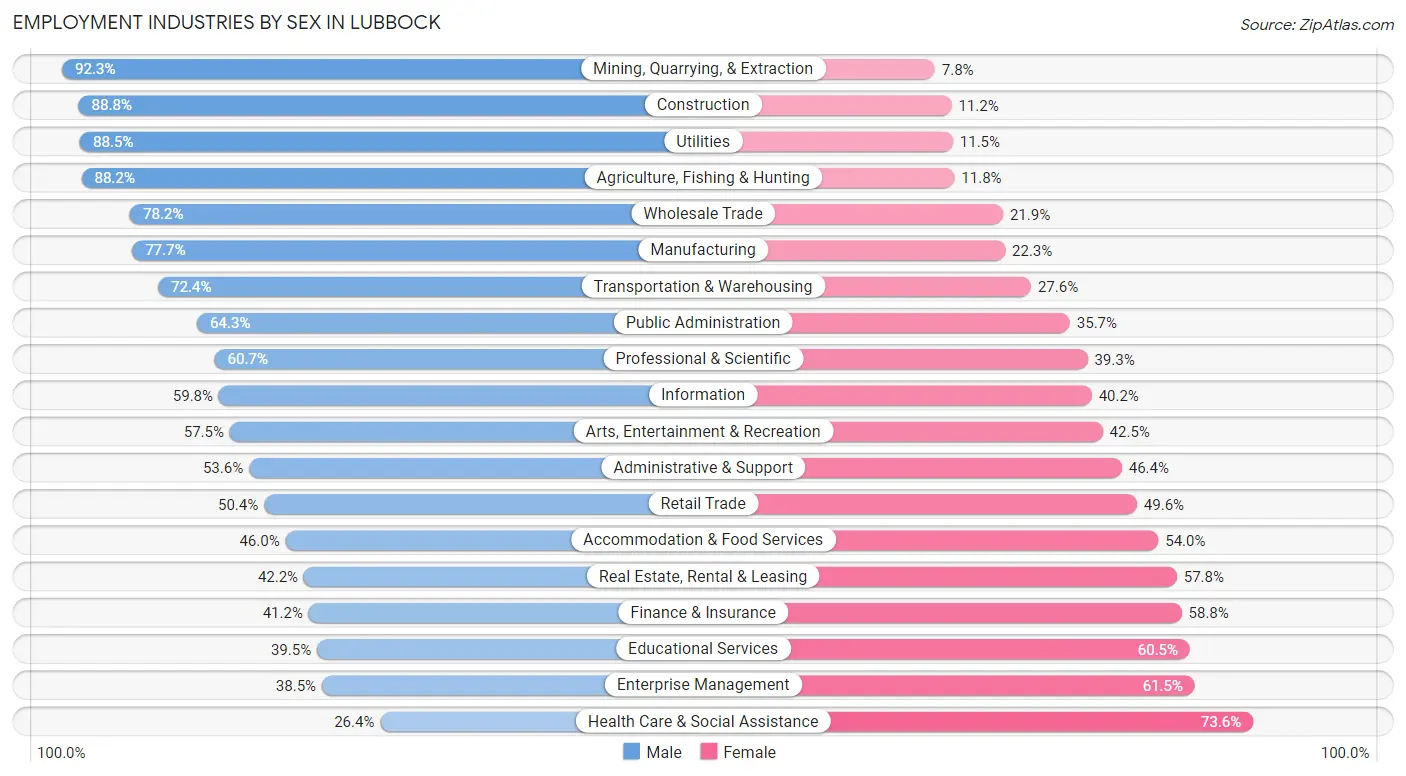
Employment Industries by Sex in Lubbock
The Lubbock industries that see more men than women are Mining, Quarrying, & Extraction (92.2%), Construction (88.8%), and Utilities (88.5%), whereas the industries that tend to have a higher number of women are Health Care & Social Assistance (73.6%), Enterprise Management (61.5%), and Educational Services (60.5%).
| Industry | Male | Female |
| Agriculture, Fishing & Hunting | 785 (88.2%) | 105 (11.8%) |
| Mining, Quarrying, & Extraction | 1,488 (92.2%) | 125 (7.7%) |
| Construction | 7,644 (88.8%) | 964 (11.2%) |
| Manufacturing | 5,224 (77.7%) | 1,498 (22.3%) |
| Wholesale Trade | 2,911 (78.1%) | 814 (21.8%) |
| Retail Trade | 7,844 (50.4%) | 7,709 (49.6%) |
| Transportation & Warehousing | 3,612 (72.4%) | 1,380 (27.6%) |
| Utilities | 756 (88.5%) | 98 (11.5%) |
| Information | 1,386 (59.8%) | 932 (40.2%) |
| Finance & Insurance | 2,355 (41.2%) | 3,363 (58.8%) |
| Real Estate, Rental & Leasing | 1,090 (42.2%) | 1,494 (57.8%) |
| Professional & Scientific | 4,042 (60.7%) | 2,621 (39.3%) |
| Enterprise Management | 65 (38.5%) | 104 (61.5%) |
| Administrative & Support | 2,300 (53.6%) | 1,994 (46.4%) |
| Educational Services | 7,535 (39.5%) | 11,552 (60.5%) |
| Health Care & Social Assistance | 4,904 (26.4%) | 13,682 (73.6%) |
| Arts, Entertainment & Recreation | 841 (57.5%) | 621 (42.5%) |
| Accommodation & Food Services | 6,054 (46.0%) | 7,108 (54.0%) |
| Public Administration | 3,395 (64.3%) | 1,884 (35.7%) |
| Total | 67,714 (52.4%) | 61,497 (47.6%) |
Education in Lubbock
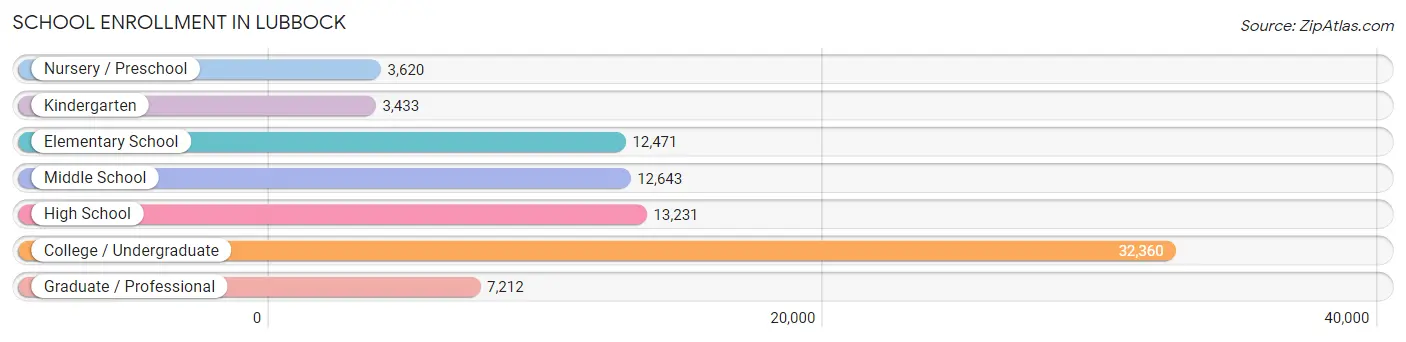
School Enrollment in Lubbock
The most common levels of schooling among the 84,970 students in Lubbock are college / undergraduate (32,360 | 38.1%), high school (13,231 | 15.6%), and middle school (12,643 | 14.9%).
| School Level | # Students | % Students |
| Nursery / Preschool | 3,620 | 4.3% |
| Kindergarten | 3,433 | 4.0% |
| Elementary School | 12,471 | 14.7% |
| Middle School | 12,643 | 14.9% |
| High School | 13,231 | 15.6% |
| College / Undergraduate | 32,360 | 38.1% |
| Graduate / Professional | 7,212 | 8.5% |
| Total | 84,970 | 100.0% |
School Enrollment by Age by Funding Source in Lubbock
Out of a total of 84,970 students who are enrolled in schools in Lubbock, 9,687 (11.4%) attend a private institution, while the remaining 75,283 (88.6%) are enrolled in public schools. The age group of 3 to 4 year olds has the highest likelihood of being enrolled in private schools, with 1,159 (40.4% in the age bracket) enrolled. Conversely, the age group of 25 to 34 year olds has the lowest likelihood of being enrolled in a private school, with 5,899 (92.7% in the age bracket) attending a public institution.
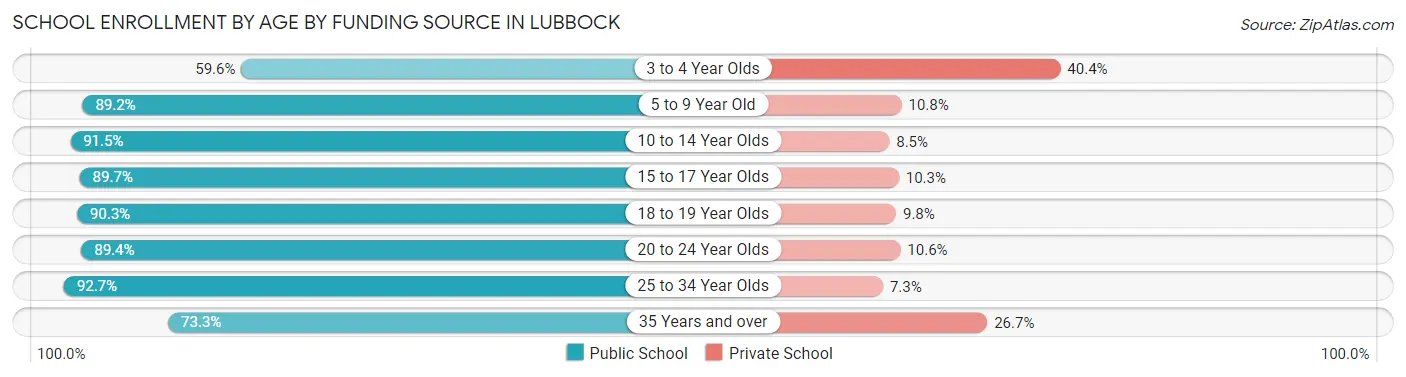
| Age Bracket | Public School | Private School |
| 3 to 4 Year Olds | 1,712 (59.6%) | 1,159 (40.4%) |
| 5 to 9 Year Old | 13,386 (89.2%) | 1,617 (10.8%) |
| 10 to 14 Year Olds | 14,556 (91.5%) | 1,352 (8.5%) |
| 15 to 17 Year Olds | 8,729 (89.7%) | 998 (10.3%) |
| 18 to 19 Year Olds | 9,628 (90.2%) | 1,040 (9.8%) |
| 20 to 24 Year Olds | 19,129 (89.4%) | 2,262 (10.6%) |
| 25 to 34 Year Olds | 5,899 (92.7%) | 466 (7.3%) |
| 35 Years and over | 2,225 (73.3%) | 812 (26.7%) |
| Total | 75,283 (88.6%) | 9,687 (11.4%) |
Educational Attainment by Field of Study in Lubbock
Business (10,158 | 18.3%), education (7,906 | 14.2%), science & technology (5,980 | 10.8%), bio, nature & agricultural (5,542 | 10.0%), and arts & humanities (4,784 | 8.6%) are the most common fields of study among 55,476 individuals in Lubbock who have obtained a bachelor's degree or higher.
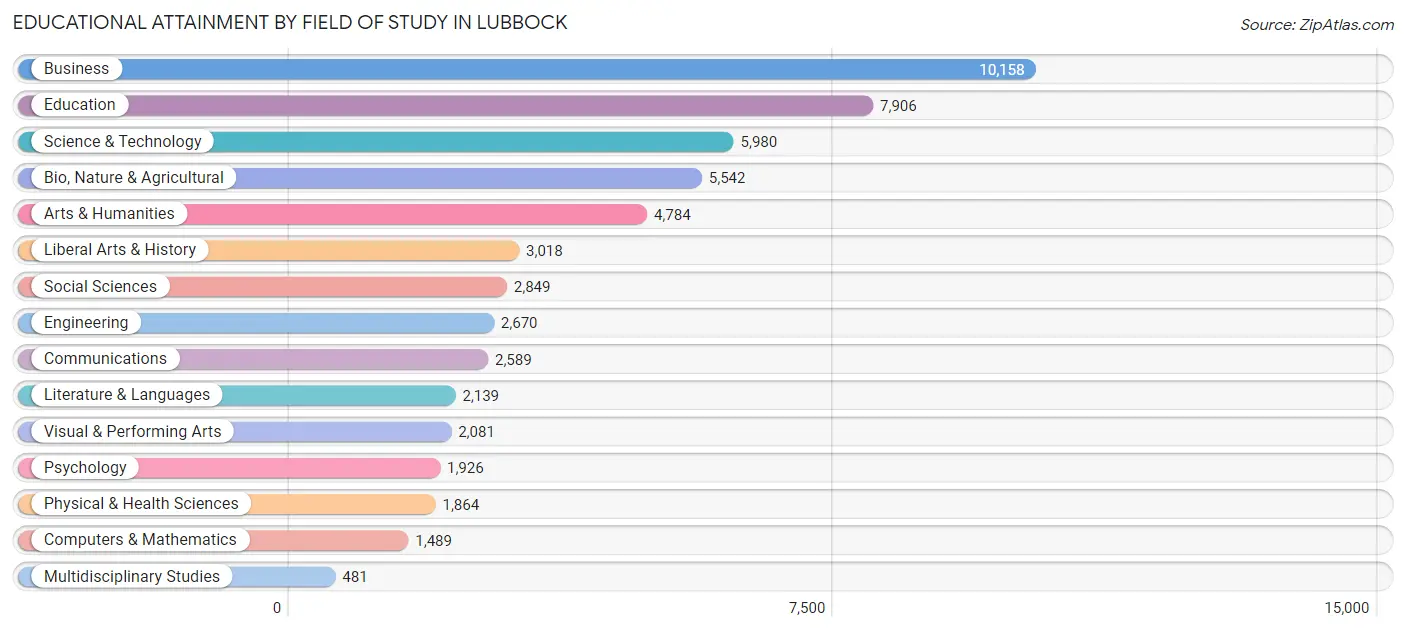
| Field of Study | # Graduates | % Graduates |
| Computers & Mathematics | 1,489 | 2.7% |
| Bio, Nature & Agricultural | 5,542 | 10.0% |
| Physical & Health Sciences | 1,864 | 3.4% |
| Psychology | 1,926 | 3.5% |
| Social Sciences | 2,849 | 5.1% |
| Engineering | 2,670 | 4.8% |
| Multidisciplinary Studies | 481 | 0.9% |
| Science & Technology | 5,980 | 10.8% |
| Business | 10,158 | 18.3% |
| Education | 7,906 | 14.2% |
| Literature & Languages | 2,139 | 3.9% |
| Liberal Arts & History | 3,018 | 5.4% |
| Visual & Performing Arts | 2,081 | 3.7% |
| Communications | 2,589 | 4.7% |
| Arts & Humanities | 4,784 | 8.6% |
| Total | 55,476 | 100.0% |
Transportation & Commute in Lubbock
Vehicle Availability by Sex in Lubbock
The most prevalent vehicle ownership categories in Lubbock are males with 2 vehicles (28,996, accounting for 43.8%) and females with 2 vehicles (25,383, making up 49.2%).
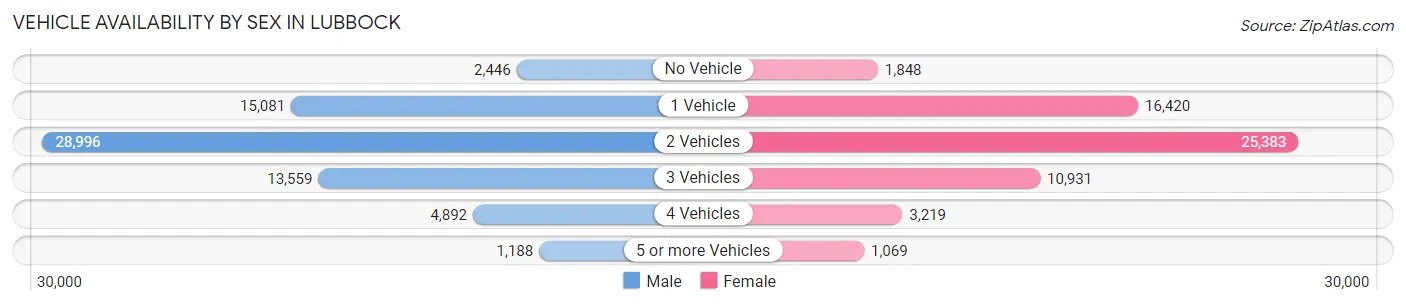
| Vehicles Available | Male | Female |
| No Vehicle | 2,446 (3.7%) | 1,848 (3.1%) |
| 1 Vehicle | 15,081 (22.8%) | 16,420 (27.9%) |
| 2 Vehicles | 28,996 (43.8%) | 25,383 (43.1%) |
| 3 Vehicles | 13,559 (20.5%) | 10,931 (18.6%) |
| 4 Vehicles | 4,892 (7.4%) | 3,219 (5.5%) |
| 5 or more Vehicles | 1,188 (1.8%) | 1,069 (1.8%) |
| Total | 66,162 (100.0%) | 58,870 (100.0%) |
Commute Time in Lubbock
The most frequently occuring commute durations in Lubbock are 15 to 19 minutes (34,779 commuters, 29.1%), 10 to 14 minutes (34,235 commuters, 28.6%), and 5 to 9 minutes (22,667 commuters, 18.9%).
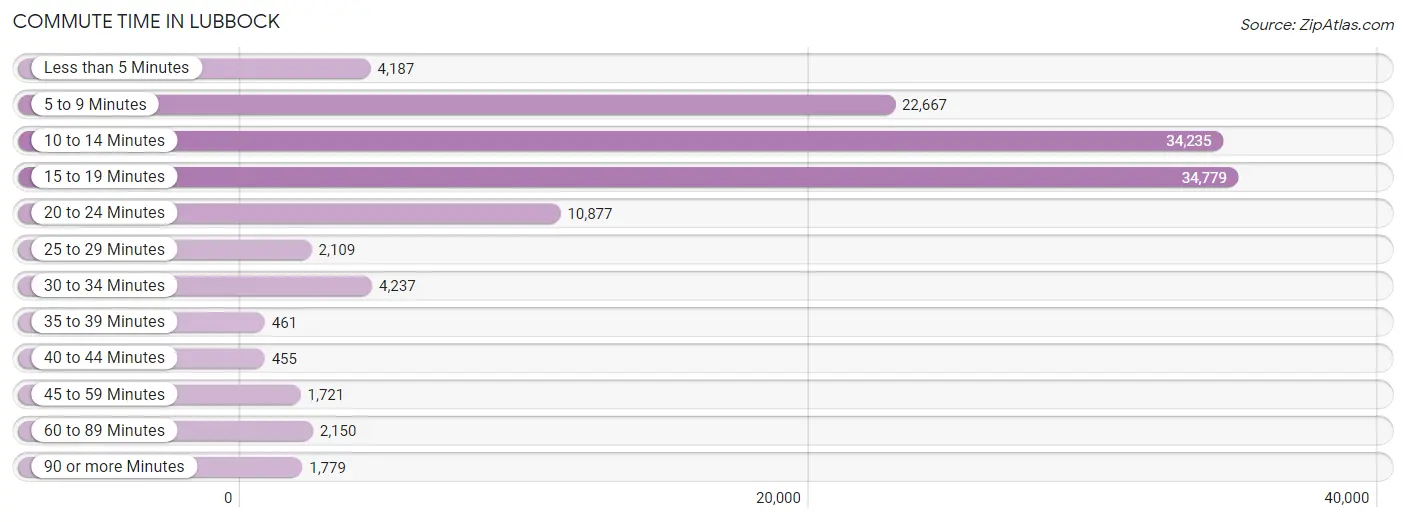
| Commute Time | # Commuters | % Commuters |
| Less than 5 Minutes | 4,187 | 3.5% |
| 5 to 9 Minutes | 22,667 | 18.9% |
| 10 to 14 Minutes | 34,235 | 28.6% |
| 15 to 19 Minutes | 34,779 | 29.1% |
| 20 to 24 Minutes | 10,877 | 9.1% |
| 25 to 29 Minutes | 2,109 | 1.8% |
| 30 to 34 Minutes | 4,237 | 3.5% |
| 35 to 39 Minutes | 461 | 0.4% |
| 40 to 44 Minutes | 455 | 0.4% |
| 45 to 59 Minutes | 1,721 | 1.4% |
| 60 to 89 Minutes | 2,150 | 1.8% |
| 90 or more Minutes | 1,779 | 1.5% |
Commute Time by Sex in Lubbock
The most common commute times in Lubbock are 15 to 19 minutes (18,204 commuters, 29.0%) for males and 10 to 14 minutes (16,690 commuters, 29.3%) for females.
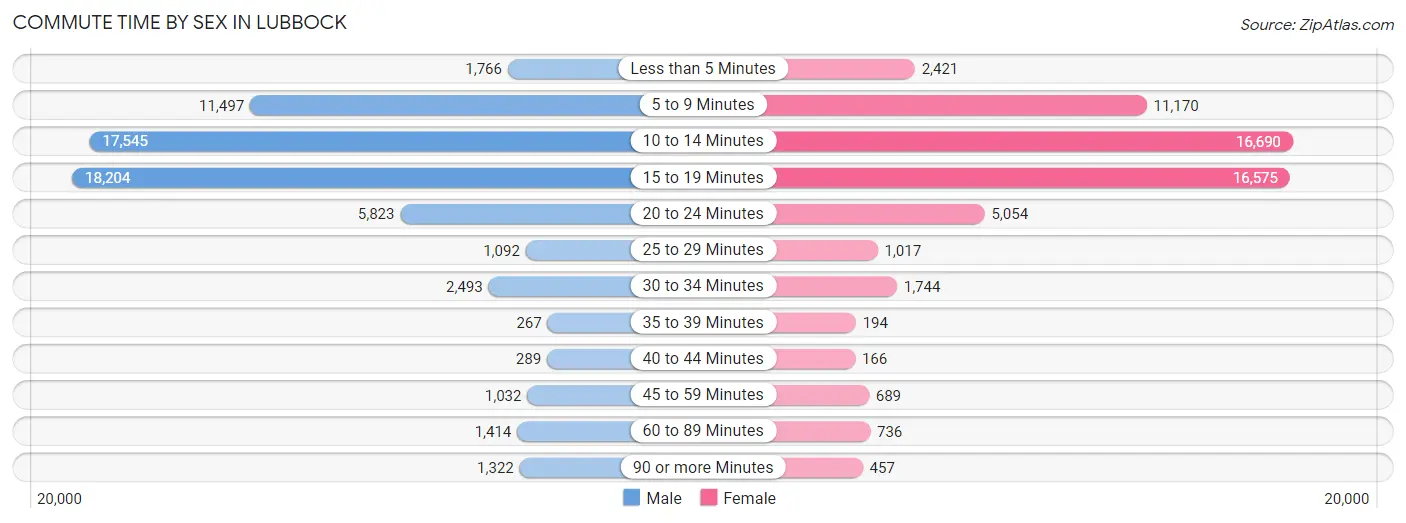
| Commute Time | Male | Female |
| Less than 5 Minutes | 1,766 (2.8%) | 2,421 (4.3%) |
| 5 to 9 Minutes | 11,497 (18.3%) | 11,170 (19.6%) |
| 10 to 14 Minutes | 17,545 (28.0%) | 16,690 (29.3%) |
| 15 to 19 Minutes | 18,204 (29.0%) | 16,575 (29.1%) |
| 20 to 24 Minutes | 5,823 (9.3%) | 5,054 (8.9%) |
| 25 to 29 Minutes | 1,092 (1.7%) | 1,017 (1.8%) |
| 30 to 34 Minutes | 2,493 (4.0%) | 1,744 (3.1%) |
| 35 to 39 Minutes | 267 (0.4%) | 194 (0.3%) |
| 40 to 44 Minutes | 289 (0.5%) | 166 (0.3%) |
| 45 to 59 Minutes | 1,032 (1.6%) | 689 (1.2%) |
| 60 to 89 Minutes | 1,414 (2.2%) | 736 (1.3%) |
| 90 or more Minutes | 1,322 (2.1%) | 457 (0.8%) |
Time of Departure to Work by Sex in Lubbock
The most frequent times of departure to work in Lubbock are 7:30 AM to 7:59 AM (12,206, 19.5%) for males and 7:30 AM to 7:59 AM (12,293, 21.6%) for females.
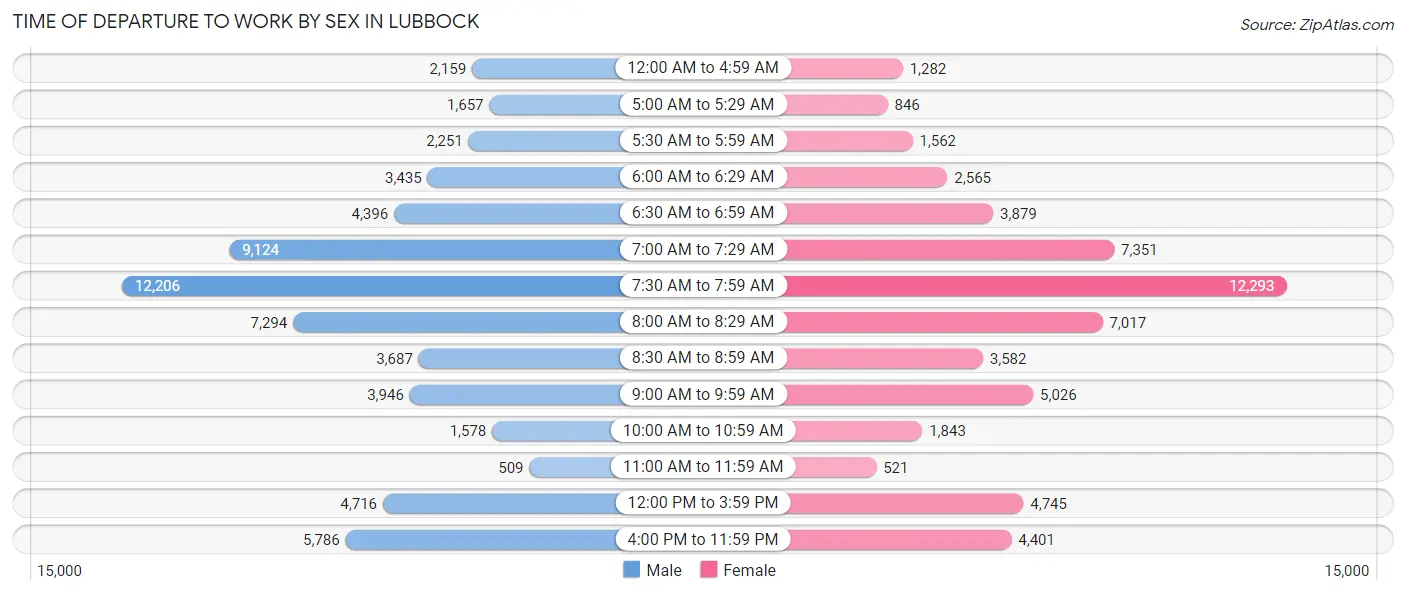
| Time of Departure | Male | Female |
| 12:00 AM to 4:59 AM | 2,159 (3.4%) | 1,282 (2.2%) |
| 5:00 AM to 5:29 AM | 1,657 (2.6%) | 846 (1.5%) |
| 5:30 AM to 5:59 AM | 2,251 (3.6%) | 1,562 (2.7%) |
| 6:00 AM to 6:29 AM | 3,435 (5.5%) | 2,565 (4.5%) |
| 6:30 AM to 6:59 AM | 4,396 (7.0%) | 3,879 (6.8%) |
| 7:00 AM to 7:29 AM | 9,124 (14.5%) | 7,351 (12.9%) |
| 7:30 AM to 7:59 AM | 12,206 (19.5%) | 12,293 (21.6%) |
| 8:00 AM to 8:29 AM | 7,294 (11.6%) | 7,017 (12.3%) |
| 8:30 AM to 8:59 AM | 3,687 (5.9%) | 3,582 (6.3%) |
| 9:00 AM to 9:59 AM | 3,946 (6.3%) | 5,026 (8.8%) |
| 10:00 AM to 10:59 AM | 1,578 (2.5%) | 1,843 (3.2%) |
| 11:00 AM to 11:59 AM | 509 (0.8%) | 521 (0.9%) |
| 12:00 PM to 3:59 PM | 4,716 (7.5%) | 4,745 (8.3%) |
| 4:00 PM to 11:59 PM | 5,786 (9.2%) | 4,401 (7.7%) |
| Total | 62,744 (100.0%) | 56,913 (100.0%) |
Housing Occupancy in Lubbock
Occupancy by Ownership in Lubbock
Of the total 102,894 dwellings in Lubbock, owner-occupied units account for 52,449 (51.0%), while renter-occupied units make up 50,445 (49.0%).
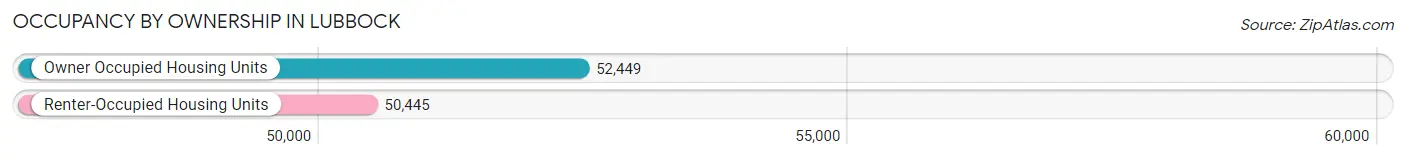
| Occupancy | # Housing Units | % Housing Units |
| Owner Occupied Housing Units | 52,449 | 51.0% |
| Renter-Occupied Housing Units | 50,445 | 49.0% |
| Total Occupied Housing Units | 102,894 | 100.0% |
Occupancy by Household Size in Lubbock
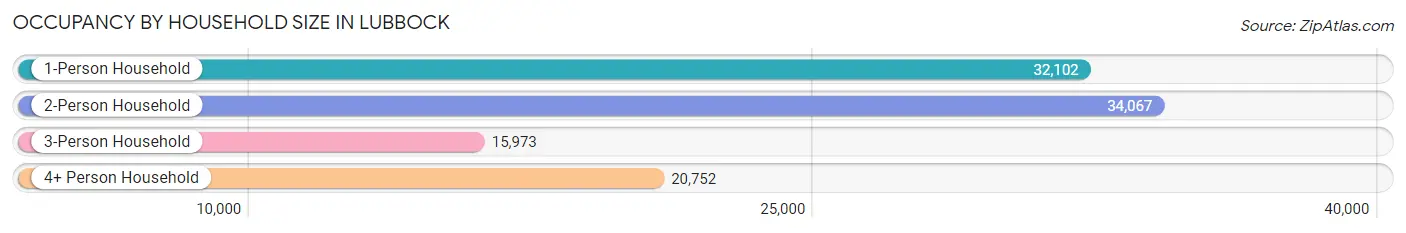
| Household Size | # Housing Units | % Housing Units |
| 1-Person Household | 32,102 | 31.2% |
| 2-Person Household | 34,067 | 33.1% |
| 3-Person Household | 15,973 | 15.5% |
| 4+ Person Household | 20,752 | 20.2% |
| Total Housing Units | 102,894 | 100.0% |
Occupancy by Ownership by Household Size in Lubbock
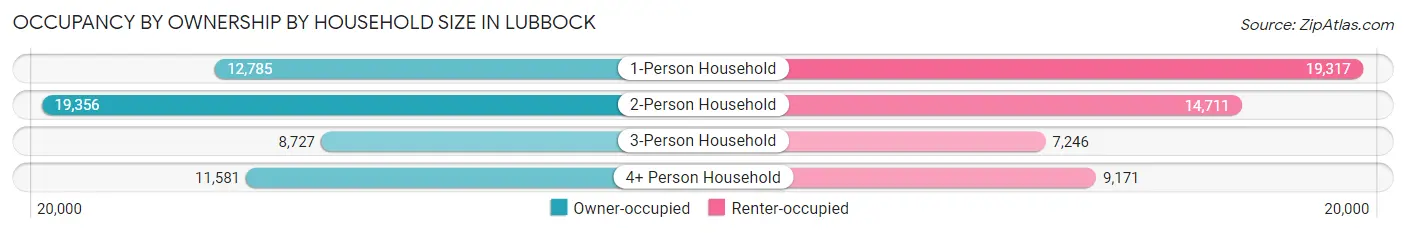
| Household Size | Owner-occupied | Renter-occupied |
| 1-Person Household | 12,785 (39.8%) | 19,317 (60.2%) |
| 2-Person Household | 19,356 (56.8%) | 14,711 (43.2%) |
| 3-Person Household | 8,727 (54.6%) | 7,246 (45.4%) |
| 4+ Person Household | 11,581 (55.8%) | 9,171 (44.2%) |
| Total Housing Units | 52,449 (51.0%) | 50,445 (49.0%) |
Occupancy by Educational Attainment in Lubbock
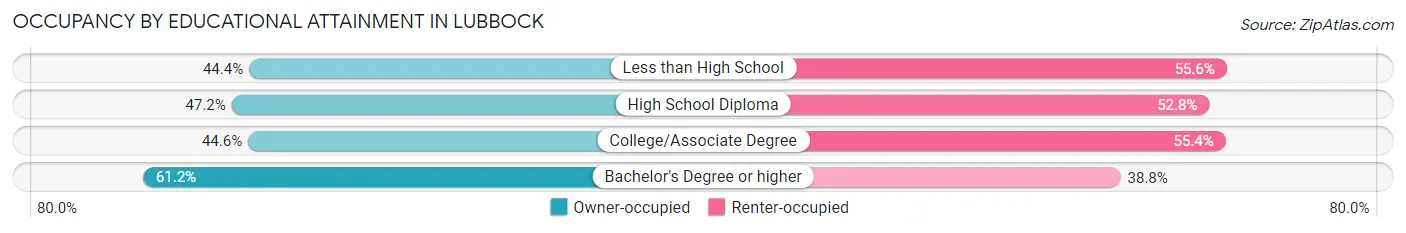
| Household Size | Owner-occupied | Renter-occupied |
| Less than High School | 4,261 (44.4%) | 5,334 (55.6%) |
| High School Diploma | 10,714 (47.2%) | 11,996 (52.8%) |
| College/Associate Degree | 15,372 (44.6%) | 19,121 (55.4%) |
| Bachelor's Degree or higher | 22,102 (61.2%) | 13,994 (38.8%) |
Occupancy by Age of Householder in Lubbock
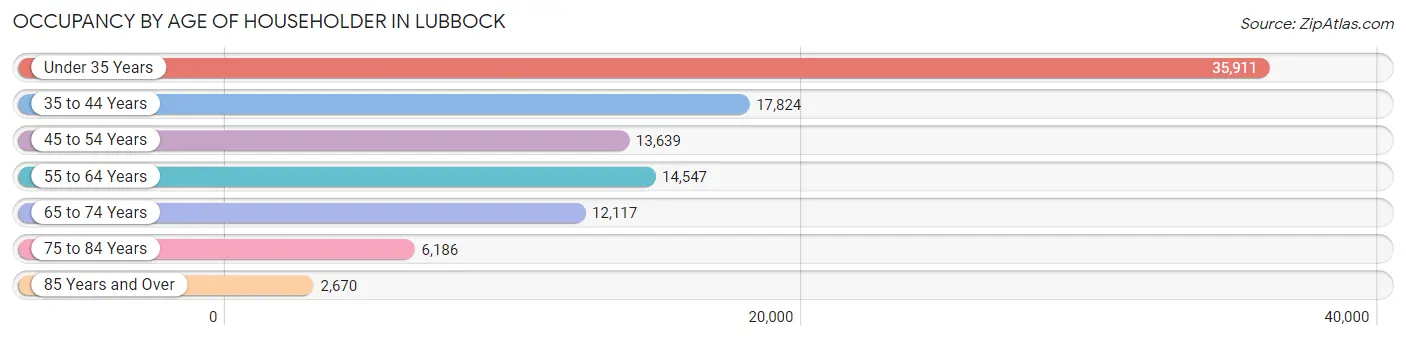
| Age Bracket | # Households | % Households |
| Under 35 Years | 35,911 | 34.9% |
| 35 to 44 Years | 17,824 | 17.3% |
| 45 to 54 Years | 13,639 | 13.3% |
| 55 to 64 Years | 14,547 | 14.1% |
| 65 to 74 Years | 12,117 | 11.8% |
| 75 to 84 Years | 6,186 | 6.0% |
| 85 Years and Over | 2,670 | 2.6% |
| Total | 102,894 | 100.0% |
Housing Finances in Lubbock
Median Income by Occupancy in Lubbock
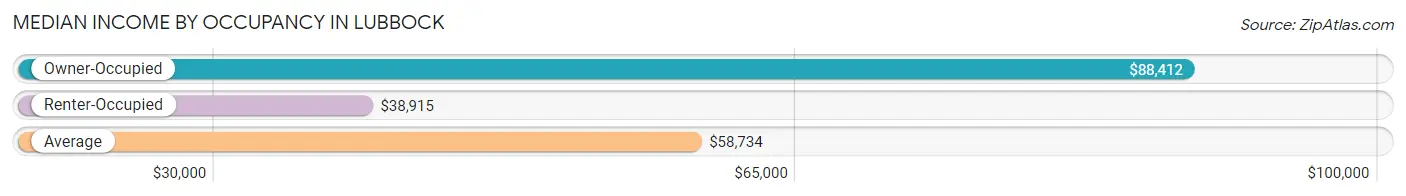
| Occupancy Type | # Households | Median Income |
| Owner-Occupied | 52,449 (51.0%) | $88,412 |
| Renter-Occupied | 50,445 (49.0%) | $38,915 |
| Average | 102,894 (100.0%) | $58,734 |
Occupancy by Householder Income Bracket in Lubbock
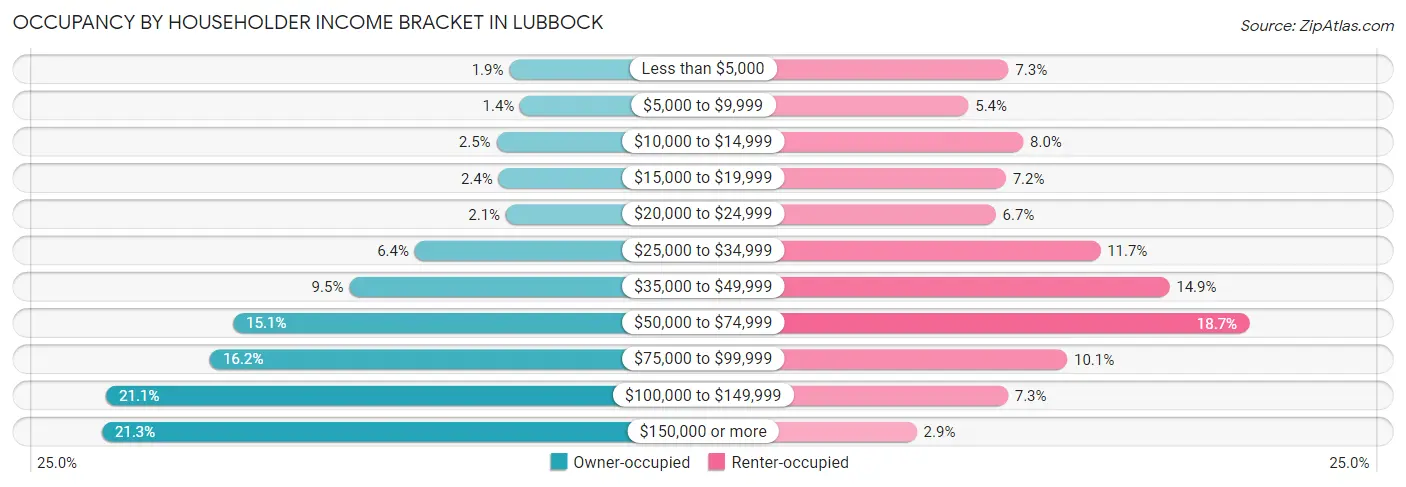
| Income Bracket | Owner-occupied | Renter-occupied |
| Less than $5,000 | 1,009 (1.9%) | 3,671 (7.3%) |
| $5,000 to $9,999 | 736 (1.4%) | 2,710 (5.4%) |
| $10,000 to $14,999 | 1,325 (2.5%) | 4,027 (8.0%) |
| $15,000 to $19,999 | 1,273 (2.4%) | 3,606 (7.1%) |
| $20,000 to $24,999 | 1,093 (2.1%) | 3,365 (6.7%) |
| $25,000 to $34,999 | 3,366 (6.4%) | 5,877 (11.7%) |
| $35,000 to $49,999 | 5,002 (9.5%) | 7,538 (14.9%) |
| $50,000 to $74,999 | 7,903 (15.1%) | 9,449 (18.7%) |
| $75,000 to $99,999 | 8,482 (16.2%) | 5,078 (10.1%) |
| $100,000 to $149,999 | 11,078 (21.1%) | 3,657 (7.2%) |
| $150,000 or more | 11,182 (21.3%) | 1,467 (2.9%) |
| Total | 52,449 (100.0%) | 50,445 (100.0%) |
Monthly Housing Cost Tiers in Lubbock
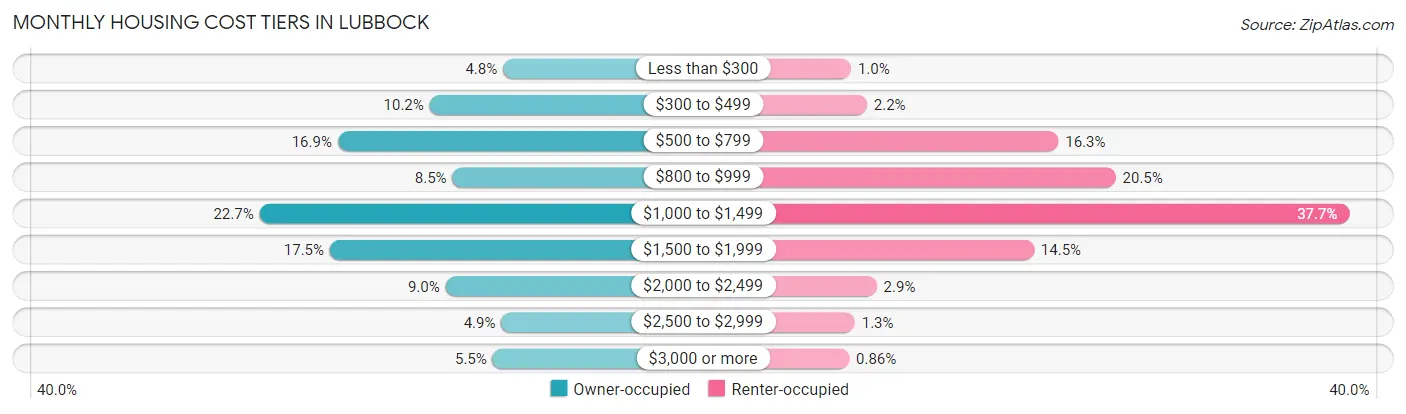
| Monthly Cost | Owner-occupied | Renter-occupied |
| Less than $300 | 2,497 (4.8%) | 502 (1.0%) |
| $300 to $499 | 5,332 (10.2%) | 1,096 (2.2%) |
| $500 to $799 | 8,883 (16.9%) | 8,207 (16.3%) |
| $800 to $999 | 4,453 (8.5%) | 10,335 (20.5%) |
| $1,000 to $1,499 | 11,904 (22.7%) | 19,011 (37.7%) |
| $1,500 to $1,999 | 9,190 (17.5%) | 7,298 (14.5%) |
| $2,000 to $2,499 | 4,721 (9.0%) | 1,460 (2.9%) |
| $2,500 to $2,999 | 2,567 (4.9%) | 646 (1.3%) |
| $3,000 or more | 2,902 (5.5%) | 435 (0.9%) |
| Total | 52,449 (100.0%) | 50,445 (100.0%) |
Physical Housing Characteristics in Lubbock
Housing Structures in Lubbock
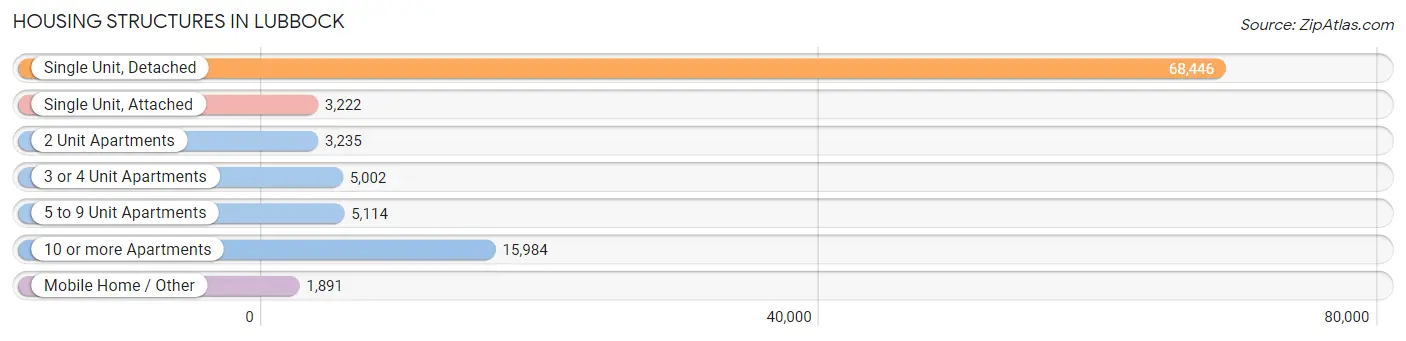
| Structure Type | # Housing Units | % Housing Units |
| Single Unit, Detached | 68,446 | 66.5% |
| Single Unit, Attached | 3,222 | 3.1% |
| 2 Unit Apartments | 3,235 | 3.1% |
| 3 or 4 Unit Apartments | 5,002 | 4.9% |
| 5 to 9 Unit Apartments | 5,114 | 5.0% |
| 10 or more Apartments | 15,984 | 15.5% |
| Mobile Home / Other | 1,891 | 1.8% |
| Total | 102,894 | 100.0% |
Housing Structures by Occupancy in Lubbock
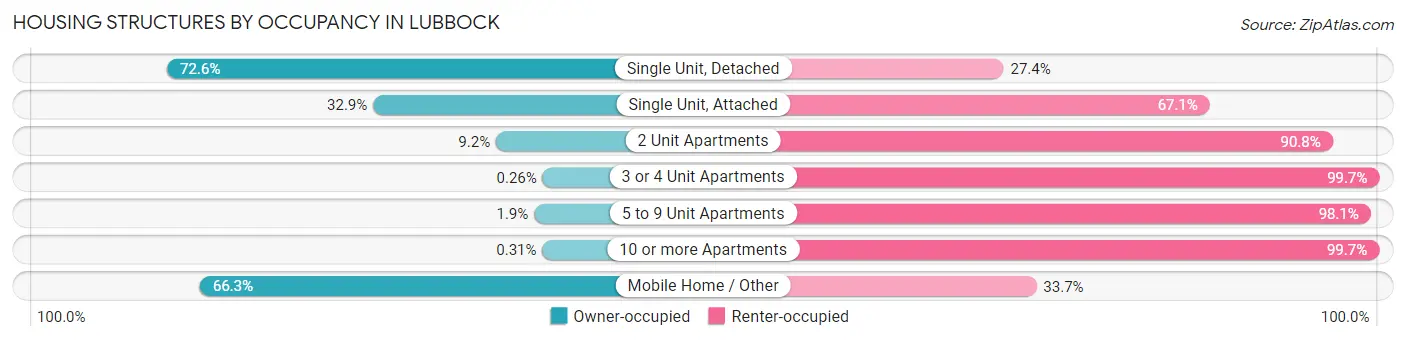
| Structure Type | Owner-occupied | Renter-occupied |
| Single Unit, Detached | 49,677 (72.6%) | 18,769 (27.4%) |
| Single Unit, Attached | 1,060 (32.9%) | 2,162 (67.1%) |
| 2 Unit Apartments | 299 (9.2%) | 2,936 (90.8%) |
| 3 or 4 Unit Apartments | 13 (0.3%) | 4,989 (99.7%) |
| 5 to 9 Unit Apartments | 97 (1.9%) | 5,017 (98.1%) |
| 10 or more Apartments | 50 (0.3%) | 15,934 (99.7%) |
| Mobile Home / Other | 1,253 (66.3%) | 638 (33.7%) |
| Total | 52,449 (51.0%) | 50,445 (49.0%) |
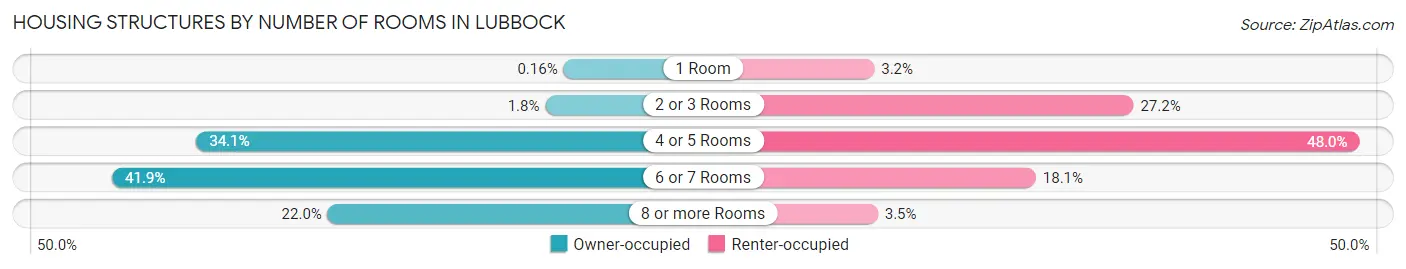
Housing Structures by Number of Rooms in Lubbock
| Number of Rooms | Owner-occupied | Renter-occupied |
| 1 Room | 86 (0.2%) | 1,603 (3.2%) |
| 2 or 3 Rooms | 963 (1.8%) | 13,698 (27.2%) |
| 4 or 5 Rooms | 17,894 (34.1%) | 24,234 (48.0%) |
| 6 or 7 Rooms | 21,981 (41.9%) | 9,143 (18.1%) |
| 8 or more Rooms | 11,525 (22.0%) | 1,767 (3.5%) |
| Total | 52,449 (100.0%) | 50,445 (100.0%) |
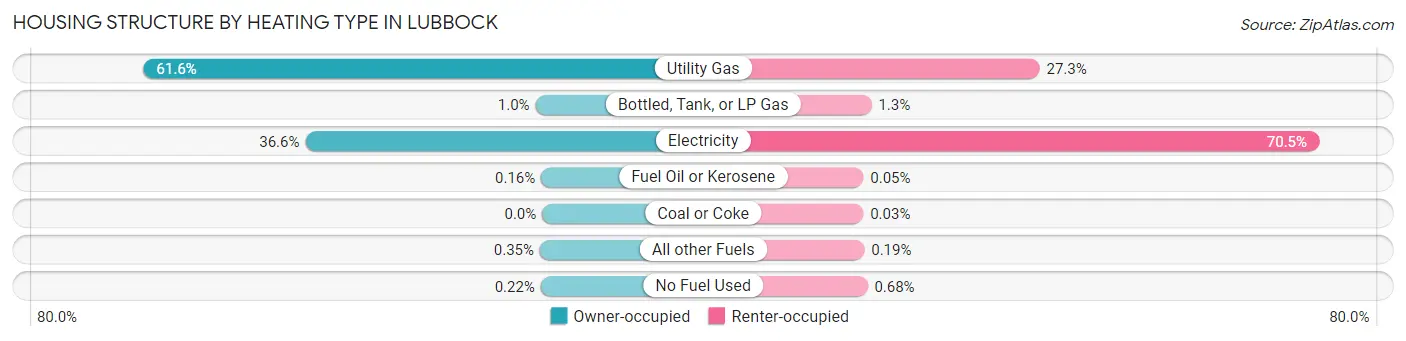
Housing Structure by Heating Type in Lubbock
| Heating Type | Owner-occupied | Renter-occupied |
| Utility Gas | 32,326 (61.6%) | 13,765 (27.3%) |
| Bottled, Tank, or LP Gas | 538 (1.0%) | 658 (1.3%) |
| Electricity | 19,204 (36.6%) | 35,543 (70.5%) |
| Fuel Oil or Kerosene | 82 (0.2%) | 26 (0.1%) |
| Coal or Coke | 0 (0.0%) | 16 (0.0%) |
| All other Fuels | 186 (0.4%) | 94 (0.2%) |
| No Fuel Used | 113 (0.2%) | 343 (0.7%) |
| Total | 52,449 (100.0%) | 50,445 (100.0%) |
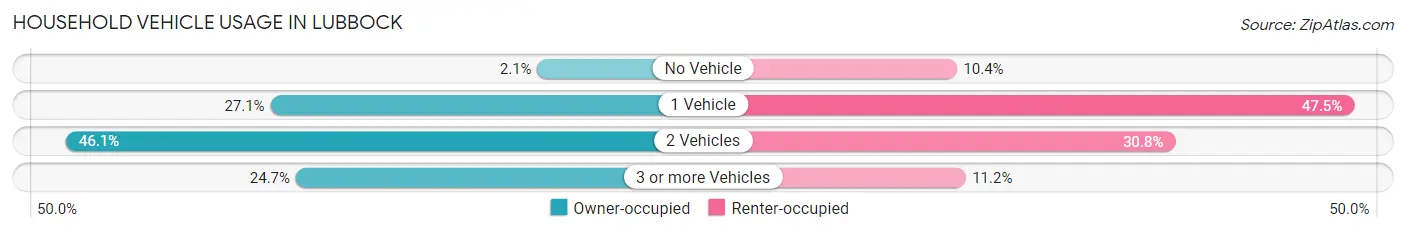
Household Vehicle Usage in Lubbock
| Vehicles per Household | Owner-occupied | Renter-occupied |
| No Vehicle | 1,118 (2.1%) | 5,253 (10.4%) |
| 1 Vehicle | 14,186 (27.1%) | 23,978 (47.5%) |
| 2 Vehicles | 24,198 (46.1%) | 15,551 (30.8%) |
| 3 or more Vehicles | 12,947 (24.7%) | 5,663 (11.2%) |
| Total | 52,449 (100.0%) | 50,445 (100.0%) |
Real Estate & Mortgages in Lubbock
Real Estate and Mortgage Overview in Lubbock
| Characteristic | Without Mortgage | With Mortgage |
| Housing Units | 22,565 | 29,884 |
| Median Property Value | $159,300 | $198,700 |
| Median Household Income | $65,921 | $7,901 |
| Monthly Housing Costs | $642 | $2,832 |
| Real Estate Taxes | $2,295 | $831 |
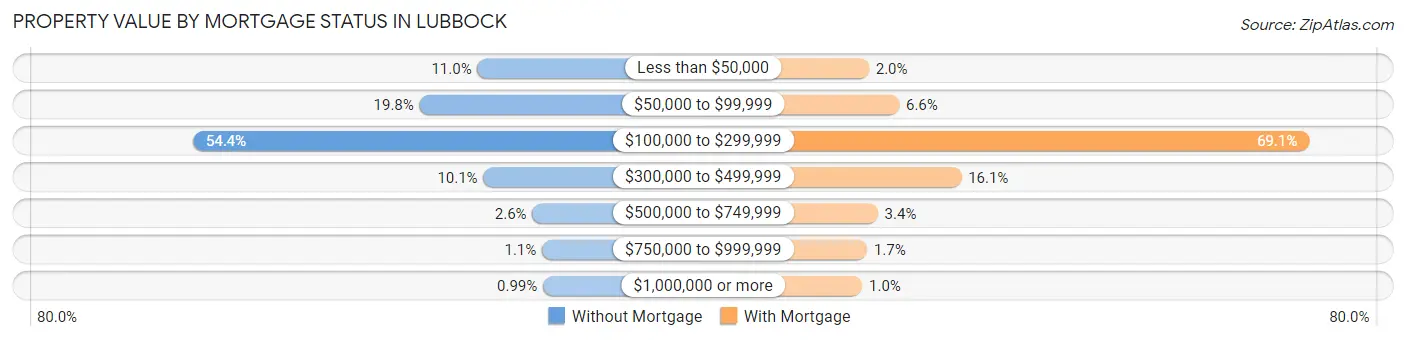
Property Value by Mortgage Status in Lubbock
| Property Value | Without Mortgage | With Mortgage |
| Less than $50,000 | 2,480 (11.0%) | 605 (2.0%) |
| $50,000 to $99,999 | 4,470 (19.8%) | 1,981 (6.6%) |
| $100,000 to $299,999 | 12,267 (54.4%) | 20,659 (69.1%) |
| $300,000 to $499,999 | 2,275 (10.1%) | 4,812 (16.1%) |
| $500,000 to $749,999 | 591 (2.6%) | 1,007 (3.4%) |
| $750,000 to $999,999 | 258 (1.1%) | 521 (1.7%) |
| $1,000,000 or more | 224 (1.0%) | 299 (1.0%) |
| Total | 22,565 (100.0%) | 29,884 (100.0%) |
Household Income by Mortgage Status in Lubbock
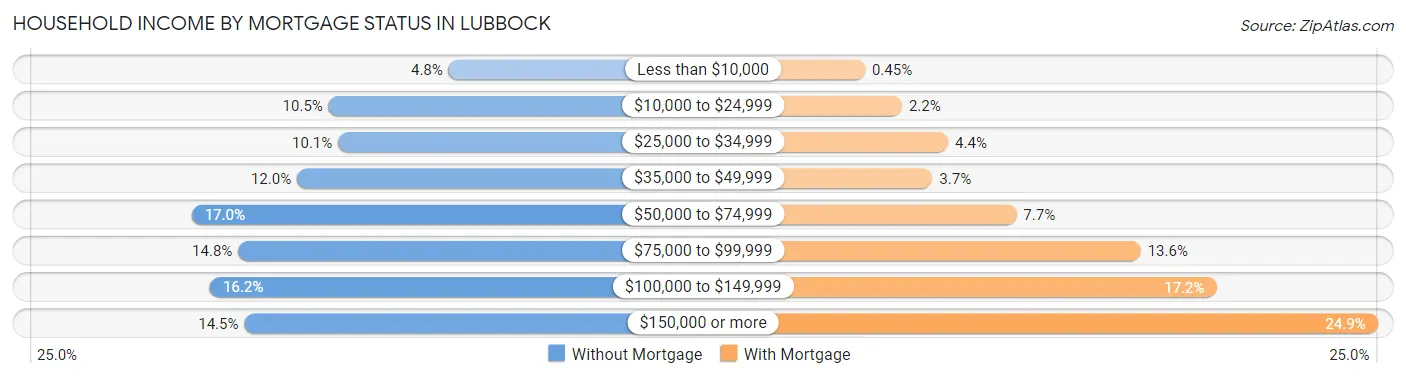
| Household Income | Without Mortgage | With Mortgage |
| Less than $10,000 | 1,085 (4.8%) | 133 (0.4%) |
| $10,000 to $24,999 | 2,373 (10.5%) | 660 (2.2%) |
| $25,000 to $34,999 | 2,273 (10.1%) | 1,318 (4.4%) |
| $35,000 to $49,999 | 2,714 (12.0%) | 1,093 (3.7%) |
| $50,000 to $74,999 | 3,844 (17.0%) | 2,288 (7.7%) |
| $75,000 to $99,999 | 3,347 (14.8%) | 4,059 (13.6%) |
| $100,000 to $149,999 | 3,648 (16.2%) | 5,135 (17.2%) |
| $150,000 or more | 3,281 (14.5%) | 7,430 (24.9%) |
| Total | 22,565 (100.0%) | 29,884 (100.0%) |
Property Value to Household Income Ratio in Lubbock
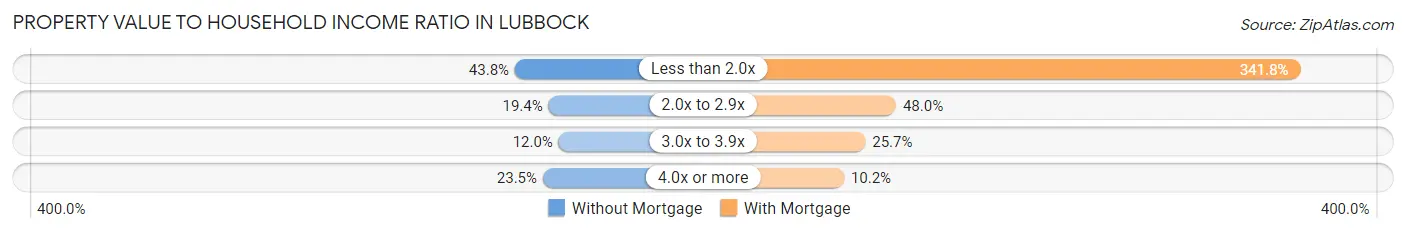
| Value-to-Income Ratio | Without Mortgage | With Mortgage |
| Less than 2.0x | 9,887 (43.8%) | 102,133 (341.8%) |
| 2.0x to 2.9x | 4,368 (19.4%) | 14,345 (48.0%) |
| 3.0x to 3.9x | 2,706 (12.0%) | 7,677 (25.7%) |
| 4.0x or more | 5,304 (23.5%) | 3,049 (10.2%) |
| Total | 22,565 (100.0%) | 29,884 (100.0%) |
Real Estate Taxes by Mortgage Status in Lubbock
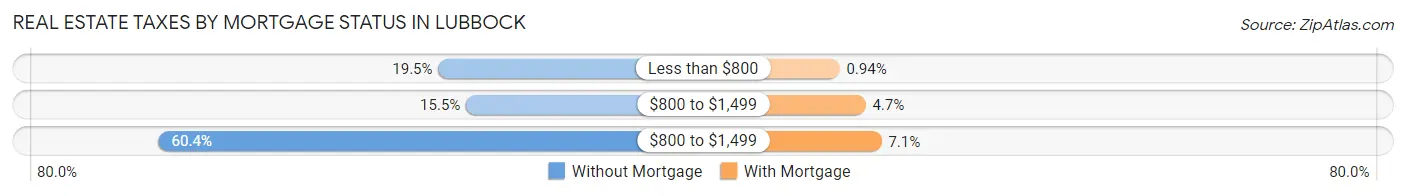
| Property Taxes | Without Mortgage | With Mortgage |
| Less than $800 | 4,409 (19.5%) | 280 (0.9%) |
| $800 to $1,499 | 3,492 (15.5%) | 1,416 (4.7%) |
| $800 to $1,499 | 13,632 (60.4%) | 2,117 (7.1%) |
| Total | 22,565 (100.0%) | 29,884 (100.0%) |
Health & Disability in Lubbock
Health Insurance Coverage by Age in Lubbock
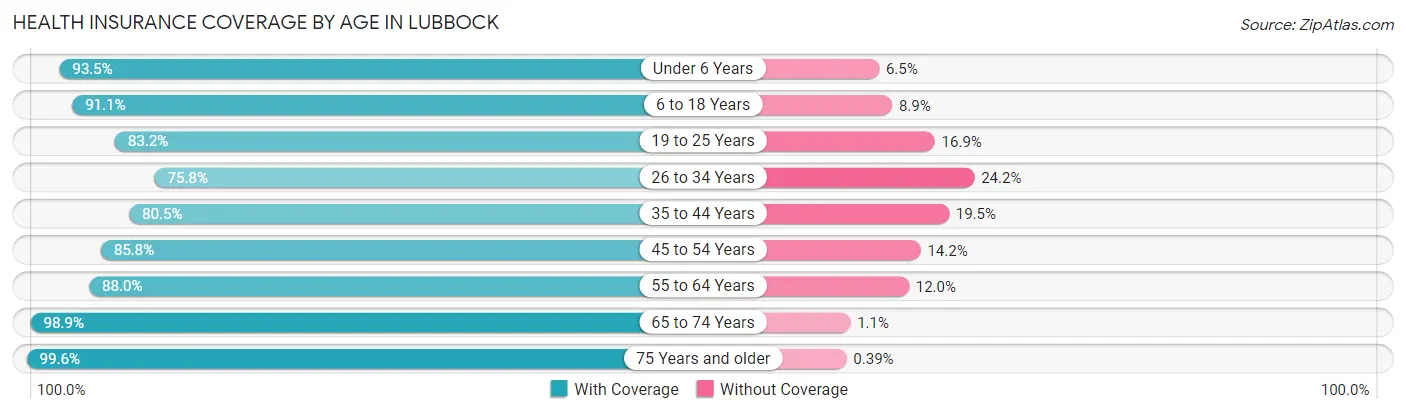
| Age Bracket | With Coverage | Without Coverage |
| Under 6 Years | 18,599 (93.5%) | 1,286 (6.5%) |
| 6 to 18 Years | 40,729 (91.1%) | 3,975 (8.9%) |
| 19 to 25 Years | 38,380 (83.2%) | 7,780 (16.9%) |
| 26 to 34 Years | 26,298 (75.8%) | 8,408 (24.2%) |
| 35 to 44 Years | 24,568 (80.5%) | 5,945 (19.5%) |
| 45 to 54 Years | 20,683 (85.8%) | 3,427 (14.2%) |
| 55 to 64 Years | 21,119 (88.0%) | 2,887 (12.0%) |
| 65 to 74 Years | 17,928 (98.9%) | 201 (1.1%) |
| 75 Years and older | 12,733 (99.6%) | 50 (0.4%) |
| Total | 221,037 (86.7%) | 33,959 (13.3%) |
Health Insurance Coverage by Citizenship Status in Lubbock
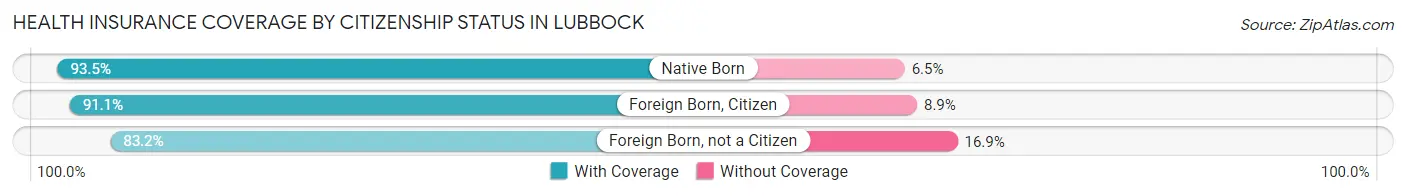
| Citizenship Status | With Coverage | Without Coverage |
| Native Born | 18,599 (93.5%) | 1,286 (6.5%) |
| Foreign Born, Citizen | 40,729 (91.1%) | 3,975 (8.9%) |
| Foreign Born, not a Citizen | 38,380 (83.2%) | 7,780 (16.9%) |
Health Insurance Coverage by Household Income in Lubbock
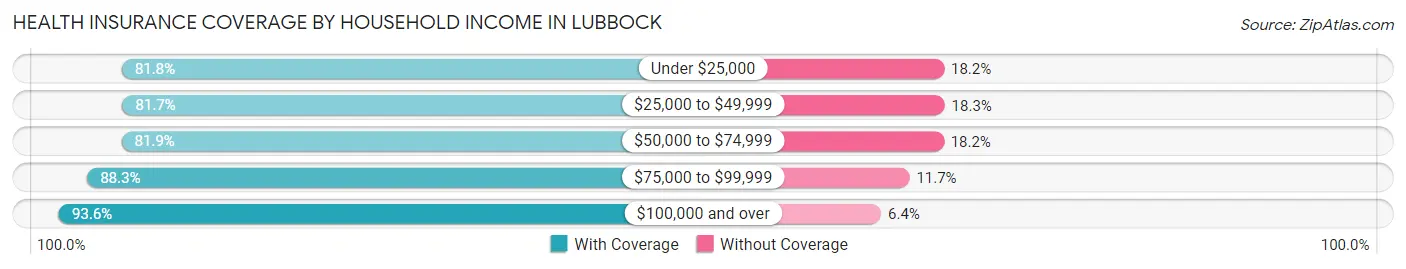
| Household Income | With Coverage | Without Coverage |
| Under $25,000 | 34,118 (81.8%) | 7,600 (18.2%) |
| $25,000 to $49,999 | 35,603 (81.7%) | 7,991 (18.3%) |
| $50,000 to $74,999 | 35,912 (81.9%) | 7,961 (18.1%) |
| $75,000 to $99,999 | 33,185 (88.3%) | 4,414 (11.7%) |
| $100,000 and over | 74,246 (93.6%) | 5,104 (6.4%) |
Public vs Private Health Insurance Coverage by Age in Lubbock
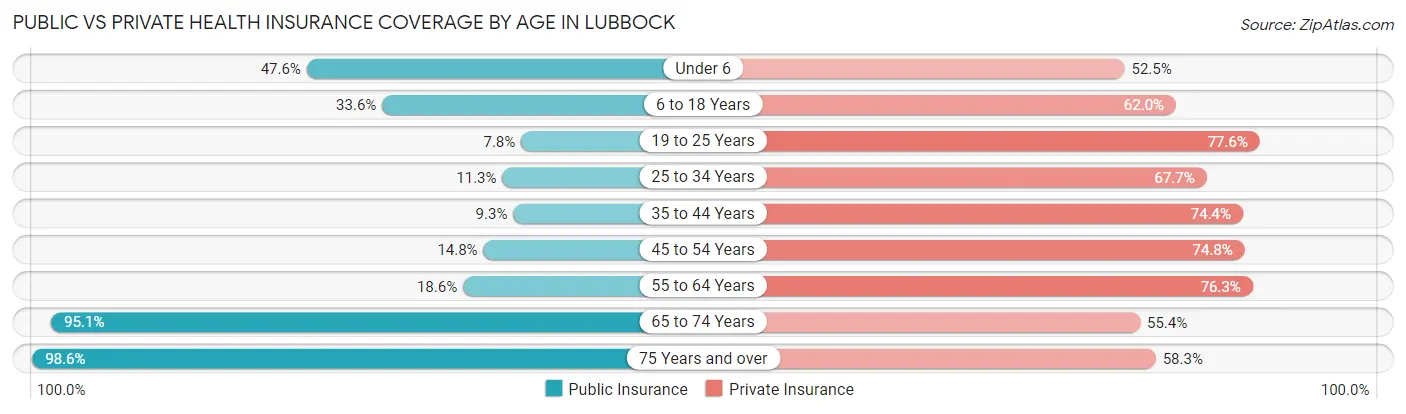
| Age Bracket | Public Insurance | Private Insurance |
| Under 6 | 9,473 (47.6%) | 10,438 (52.5%) |
| 6 to 18 Years | 15,032 (33.6%) | 27,721 (62.0%) |
| 19 to 25 Years | 3,619 (7.8%) | 35,808 (77.6%) |
| 25 to 34 Years | 3,930 (11.3%) | 23,495 (67.7%) |
| 35 to 44 Years | 2,837 (9.3%) | 22,714 (74.4%) |
| 45 to 54 Years | 3,576 (14.8%) | 18,028 (74.8%) |
| 55 to 64 Years | 4,472 (18.6%) | 18,308 (76.3%) |
| 65 to 74 Years | 17,239 (95.1%) | 10,036 (55.4%) |
| 75 Years and over | 12,602 (98.6%) | 7,449 (58.3%) |
| Total | 72,780 (28.5%) | 173,997 (68.2%) |
Disability Status by Sex by Age in Lubbock
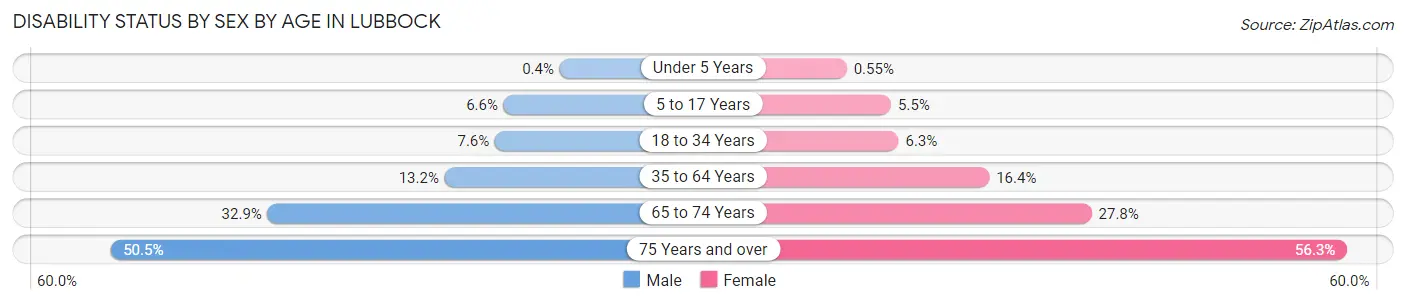
| Age Bracket | Male | Female |
| Under 5 Years | 33 (0.4%) | 46 (0.5%) |
| 5 to 17 Years | 1,408 (6.6%) | 1,145 (5.5%) |
| 18 to 34 Years | 3,323 (7.6%) | 2,721 (6.3%) |
| 35 to 64 Years | 5,085 (13.2%) | 6,590 (16.4%) |
| 65 to 74 Years | 2,748 (32.9%) | 2,722 (27.8%) |
| 75 Years and over | 2,562 (50.5%) | 4,337 (56.3%) |
Disability Class by Sex by Age in Lubbock
Disability Class: Hearing Difficulty
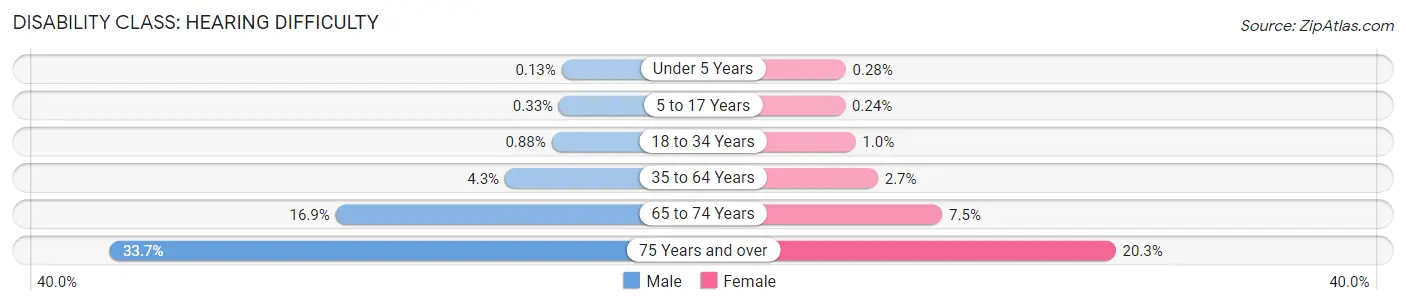
| Age Bracket | Male | Female |
| Under 5 Years | 11 (0.1%) | 23 (0.3%) |
| 5 to 17 Years | 71 (0.3%) | 51 (0.2%) |
| 18 to 34 Years | 386 (0.9%) | 434 (1.0%) |
| 35 to 64 Years | 1,670 (4.3%) | 1,071 (2.7%) |
| 65 to 74 Years | 1,411 (16.9%) | 729 (7.4%) |
| 75 Years and over | 1,709 (33.7%) | 1,567 (20.3%) |
Disability Class: Vision Difficulty
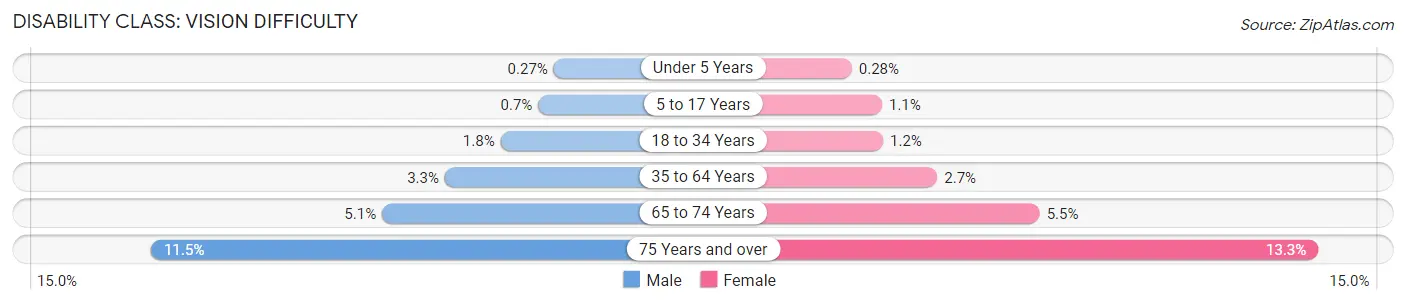
| Age Bracket | Male | Female |
| Under 5 Years | 22 (0.3%) | 23 (0.3%) |
| 5 to 17 Years | 149 (0.7%) | 234 (1.1%) |
| 18 to 34 Years | 764 (1.8%) | 495 (1.1%) |
| 35 to 64 Years | 1,270 (3.3%) | 1,067 (2.7%) |
| 65 to 74 Years | 421 (5.1%) | 539 (5.5%) |
| 75 Years and over | 583 (11.5%) | 1,022 (13.3%) |
Disability Class: Cognitive Difficulty
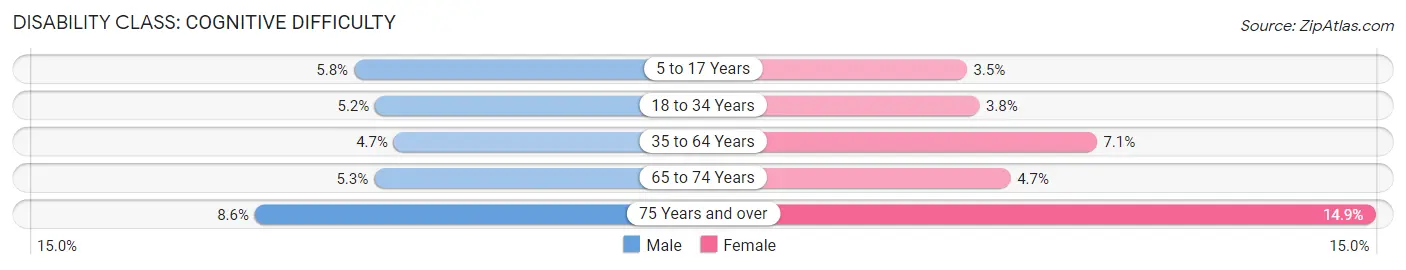
| Age Bracket | Male | Female |
| 5 to 17 Years | 1,239 (5.8%) | 723 (3.5%) |
| 18 to 34 Years | 2,288 (5.2%) | 1,645 (3.8%) |
| 35 to 64 Years | 1,817 (4.7%) | 2,843 (7.1%) |
| 65 to 74 Years | 440 (5.3%) | 459 (4.7%) |
| 75 Years and over | 436 (8.6%) | 1,144 (14.8%) |
Disability Class: Ambulatory Difficulty
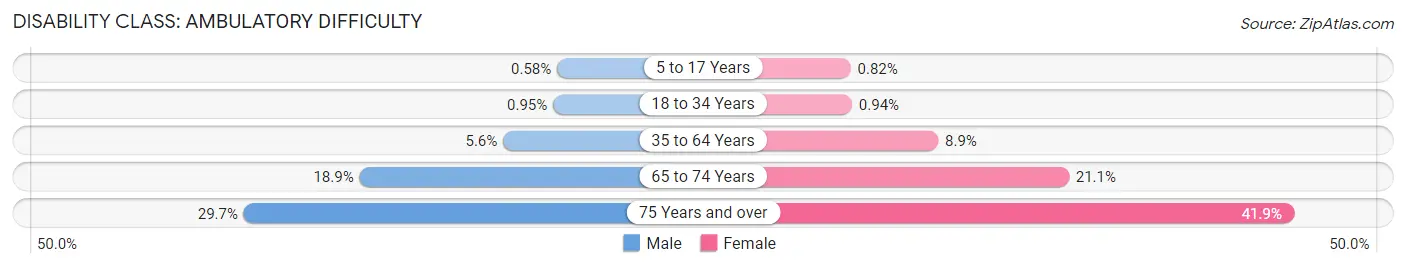
| Age Bracket | Male | Female |
| 5 to 17 Years | 124 (0.6%) | 172 (0.8%) |
| 18 to 34 Years | 414 (0.9%) | 405 (0.9%) |
| 35 to 64 Years | 2,153 (5.6%) | 3,587 (8.9%) |
| 65 to 74 Years | 1,579 (18.9%) | 2,062 (21.1%) |
| 75 Years and over | 1,506 (29.7%) | 3,232 (41.9%) |
Disability Class: Self-Care Difficulty
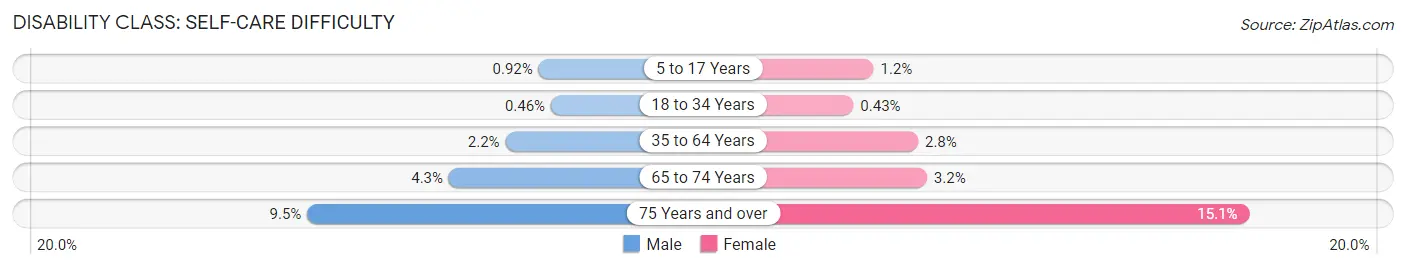
| Age Bracket | Male | Female |
| 5 to 17 Years | 195 (0.9%) | 247 (1.2%) |
| 18 to 34 Years | 201 (0.5%) | 187 (0.4%) |
| 35 to 64 Years | 826 (2.1%) | 1,137 (2.8%) |
| 65 to 74 Years | 355 (4.3%) | 309 (3.2%) |
| 75 Years and over | 483 (9.5%) | 1,166 (15.1%) |
Technology Access in Lubbock
Computing Device Access in Lubbock
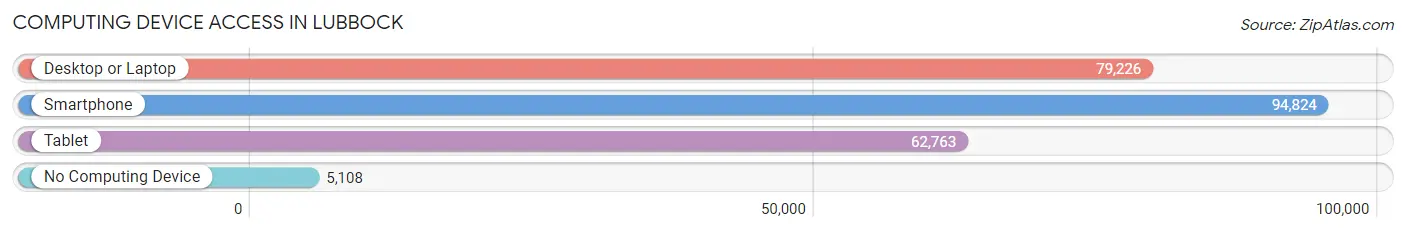
| Device Type | # Households | % Households |
| Desktop or Laptop | 79,226 | 77.0% |
| Smartphone | 94,824 | 92.2% |
| Tablet | 62,763 | 61.0% |
| No Computing Device | 5,108 | 5.0% |
| Total | 102,894 | 100.0% |
Internet Access in Lubbock
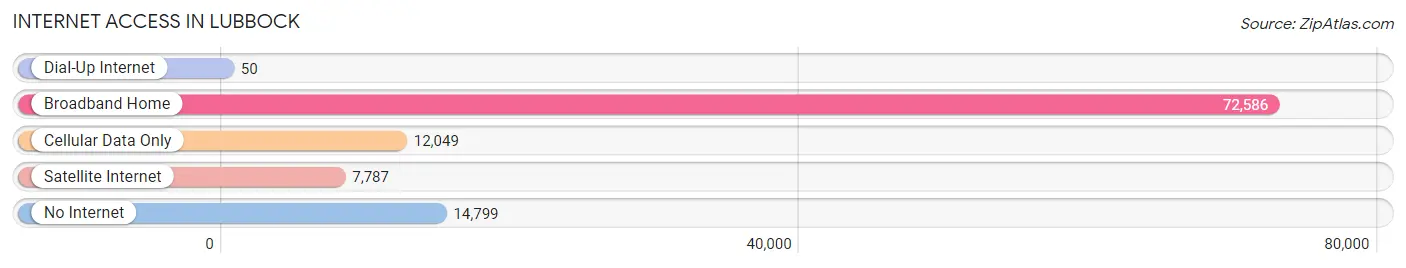
| Internet Type | # Households | % Households |
| Dial-Up Internet | 50 | 0.1% |
| Broadband Home | 72,586 | 70.5% |
| Cellular Data Only | 12,049 | 11.7% |
| Satellite Internet | 7,787 | 7.6% |
| No Internet | 14,799 | 14.4% |
| Total | 102,894 | 100.0% |
Lubbock Summary
Lubbock, Texas is a city located in the northwestern part of the state, in the South Plains region of the state. It is the county seat of Lubbock County and is the 11th largest city in Texas. The city is known for its agricultural and ranching heritage, as well as its vibrant music and art scene.
History
Lubbock was founded in 1876 by Thomas S. Lubbock, a former Texas Ranger and Confederate soldier. The city was named after him and was originally a small farming and ranching community. In the early 1900s, the city began to grow rapidly due to the discovery of oil and natural gas in the area. This led to an influx of people and businesses, and the city quickly became a major center for the oil and gas industry.
In the 1950s, Lubbock experienced a period of rapid growth and development. The city was home to several major universities, including Texas Tech University, which was founded in 1923. The city also became a major center for the cotton industry, and the city’s economy was largely based on cotton production.
In the 1960s, the city experienced a period of decline due to the decline of the cotton industry. However, the city was able to rebound in the 1970s and 1980s due to the growth of the oil and gas industry, as well as the growth of the city’s educational and medical institutions.
Geography
Lubbock is located in the northwestern part of the state, in the South Plains region of Texas. The city is situated on the Llano Estacado, a large plateau that covers much of the western part of the state. The city is located at the intersection of Interstate 27 and U.S. Highway 84, and is approximately 200 miles west of Dallas and 200 miles east of El Paso.
The city has a total area of 97.5 square miles, of which 97.3 square miles is land and 0.2 square miles is water. The city is located at an elevation of 3,400 feet above sea level. The city is located in a semi-arid climate, with hot summers and mild winters.
Economy
Lubbock’s economy is largely based on the oil and gas industry, as well as the educational and medical institutions in the city. The city is home to several major employers, including Texas Tech University, Covenant Health System, and the Lubbock Independent School District.
The city is also home to several major manufacturing companies, including Cargill, Inc., which produces food products, and Lubbock Fabricators, which produces metal products. The city is also home to several major retail stores, including Walmart, Target, and Best Buy.
Demographics
As of the 2010 census, the population of Lubbock was 229,573. The city has a population density of 2,346 people per square mile. The racial makeup of the city was 68.2% White, 8.3% African American, 0.7% Native American, 1.9% Asian, 0.1% Pacific Islander, 19.2% from other races, and 2.6% from two or more races. Hispanic or Latino of any race were 33.2% of the population.
The median income for a household in the city was $37,817, and the median income for a family was $45,919. The per capita income for the city was $20,945. About 17.2% of the population was below the poverty line.
Lubbock is a diverse city with a rich history and culture. The city is home to several major employers, educational and medical institutions, and is a major center for the oil and gas industry. The city has a population of over 229,000 people and is a major center for the cotton industry. The city is also home to several major retail stores, and is a vibrant center for music and art.
Common Questions
What is Per Capita Income in Lubbock?
Per Capita income in Lubbock is $33,259.
What is the Median Family Income in Lubbock?
Median Family Income in Lubbock is $78,682.
What is the Median Household income in Lubbock?
Median Household Income in Lubbock is $58,734.
What is Income or Wage Gap in Lubbock?
Income or Wage Gap in Lubbock is 31.2%.
Women in Lubbock earn 68.8 cents for every dollar earned by a man.
What is Family Income Deficit in Lubbock?
Family Income Deficit in Lubbock is $11,194.
Families that are below poverty line in Lubbock earn $11,194 less on average than the poverty threshold level.
What is Inequality or Gini Index in Lubbock?
Inequality or Gini Index in Lubbock is 0.49.
What is the Total Population of Lubbock?
Total Population of Lubbock is 258,190.
What is the Total Male Population of Lubbock?
Total Male Population of Lubbock is 127,237.
What is the Total Female Population of Lubbock?
Total Female Population of Lubbock is 130,953.
What is the Ratio of Males per 100 Females in Lubbock?
There are 97.16 Males per 100 Females in Lubbock.
What is the Ratio of Females per 100 Males in Lubbock?
There are 102.92 Females per 100 Males in Lubbock.
What is the Median Population Age in Lubbock?
Median Population Age in Lubbock is 30.0 Years.
What is the Average Family Size in Lubbock
Average Family Size in Lubbock is 3.1 People.
What is the Average Household Size in Lubbock
Average Household Size in Lubbock is 2.4 People.
How Large is the Labor Force in Lubbock?
There are 135,629 People in the Labor Forcein in Lubbock.
What is the Percentage of People in the Labor Force in Lubbock?
65.8% of People are in the Labor Force in Lubbock.
What is the Unemployment Rate in Lubbock?
Unemployment Rate in Lubbock is 4.6%.