Waxahachie, TX Map & Demographics
Waxahachie Map
Waxahachie Overview
$33,996
PER CAPITA INCOME
$89,620
AVG FAMILY INCOME
$80,044
AVG HOUSEHOLD INCOME
24.9%
WAGE / INCOME GAP [ % ]
75.1¢/ $1
WAGE / INCOME GAP [ $ ]
$9,517
FAMILY INCOME DEFICIT
0.39
INEQUALITY / GINI INDEX
41,801
TOTAL POPULATION
20,199
MALE POPULATION
21,602
FEMALE POPULATION
93.51
MALES / 100 FEMALES
106.95
FEMALES / 100 MALES
31.9
MEDIAN AGE
3.3
AVG FAMILY SIZE
2.8
AVG HOUSEHOLD SIZE
21,930
LABOR FORCE [ PEOPLE ]
68.3%
PERCENT IN LABOR FORCE
3.1%
UNEMPLOYMENT RATE
Income in Waxahachie
Income Overview in Waxahachie
Per Capita Income in Waxahachie is $33,996, while median incomes of families and households are $89,620 and $80,044 respectively.
| Characteristic | Number | Measure |
| Per Capita Income | 41,801 | $33,996 |
| Median Family Income | 10,496 | $89,620 |
| Mean Family Income | 10,496 | $104,277 |
| Median Household Income | 14,439 | $80,044 |
| Mean Household Income | 14,439 | $94,549 |
| Income Deficit | 10,496 | $9,517 |
| Wage / Income Gap (%) | 41,801 | 24.91% |
| Wage / Income Gap ($) | 41,801 | 75.09¢ per $1 |
| Gini / Inequality Index | 41,801 | 0.39 |
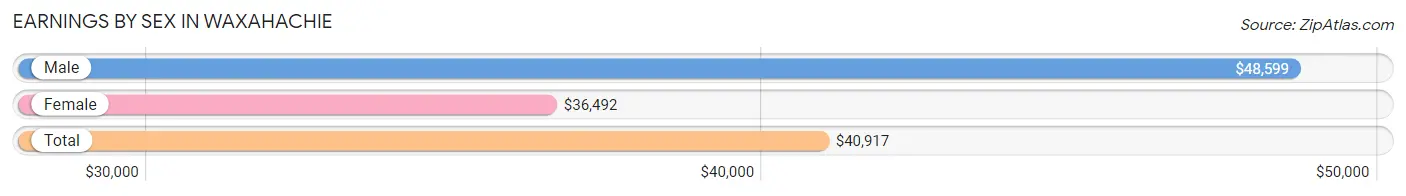
Earnings by Sex in Waxahachie
Average Earnings in Waxahachie are $40,917, $48,599 for men and $36,492 for women, a difference of 24.9%.
| Sex | Number | Average Earnings |
| Male | 11,978 (51.6%) | $48,599 |
| Female | 11,236 (48.4%) | $36,492 |
| Total | 23,214 (100.0%) | $40,917 |
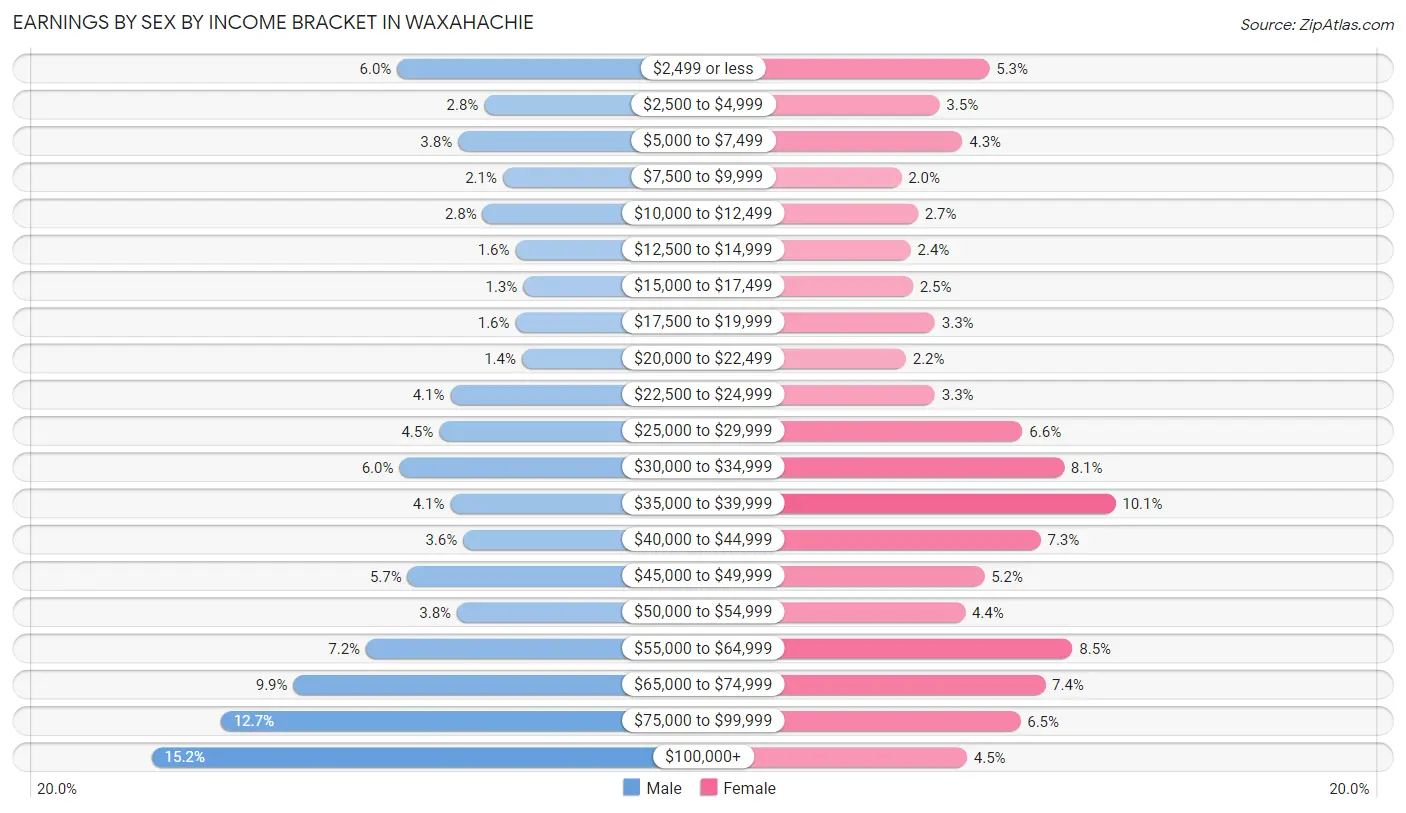
Earnings by Sex by Income Bracket in Waxahachie
The most common earnings brackets in Waxahachie are $100,000+ for men (1,826 | 15.2%) and $35,000 to $39,999 for women (1,130 | 10.1%).
| Income | Male | Female |
| $2,499 or less | 723 (6.0%) | 600 (5.3%) |
| $2,500 to $4,999 | 333 (2.8%) | 390 (3.5%) |
| $5,000 to $7,499 | 450 (3.8%) | 486 (4.3%) |
| $7,500 to $9,999 | 249 (2.1%) | 229 (2.0%) |
| $10,000 to $12,499 | 340 (2.8%) | 299 (2.7%) |
| $12,500 to $14,999 | 193 (1.6%) | 268 (2.4%) |
| $15,000 to $17,499 | 158 (1.3%) | 278 (2.5%) |
| $17,500 to $19,999 | 193 (1.6%) | 371 (3.3%) |
| $20,000 to $22,499 | 164 (1.4%) | 248 (2.2%) |
| $22,500 to $24,999 | 485 (4.1%) | 371 (3.3%) |
| $25,000 to $29,999 | 536 (4.5%) | 739 (6.6%) |
| $30,000 to $34,999 | 714 (6.0%) | 913 (8.1%) |
| $35,000 to $39,999 | 485 (4.1%) | 1,130 (10.1%) |
| $40,000 to $44,999 | 428 (3.6%) | 816 (7.3%) |
| $45,000 to $49,999 | 677 (5.7%) | 579 (5.1%) |
| $50,000 to $54,999 | 455 (3.8%) | 498 (4.4%) |
| $55,000 to $64,999 | 864 (7.2%) | 950 (8.5%) |
| $65,000 to $74,999 | 1,190 (9.9%) | 835 (7.4%) |
| $75,000 to $99,999 | 1,515 (12.7%) | 730 (6.5%) |
| $100,000+ | 1,826 (15.2%) | 506 (4.5%) |
| Total | 11,978 (100.0%) | 11,236 (100.0%) |
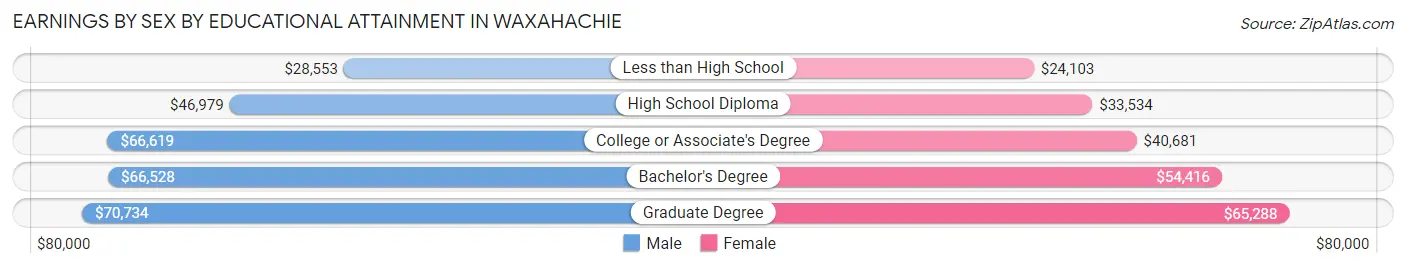
Earnings by Sex by Educational Attainment in Waxahachie
Average earnings in Waxahachie are $59,528 for men and $40,692 for women, a difference of 31.6%. Men with an educational attainment of graduate degree enjoy the highest average annual earnings of $70,734, while those with less than high school education earn the least with $28,553. Women with an educational attainment of graduate degree earn the most with the average annual earnings of $65,288, while those with less than high school education have the smallest earnings of $24,103.
| Educational Attainment | Male Income | Female Income |
| Less than High School | $28,553 | $24,103 |
| High School Diploma | $46,979 | $33,534 |
| College or Associate's Degree | $66,619 | $40,681 |
| Bachelor's Degree | $66,528 | $54,416 |
| Graduate Degree | $70,734 | $65,288 |
| Total | $59,528 | $40,692 |
Family Income in Waxahachie
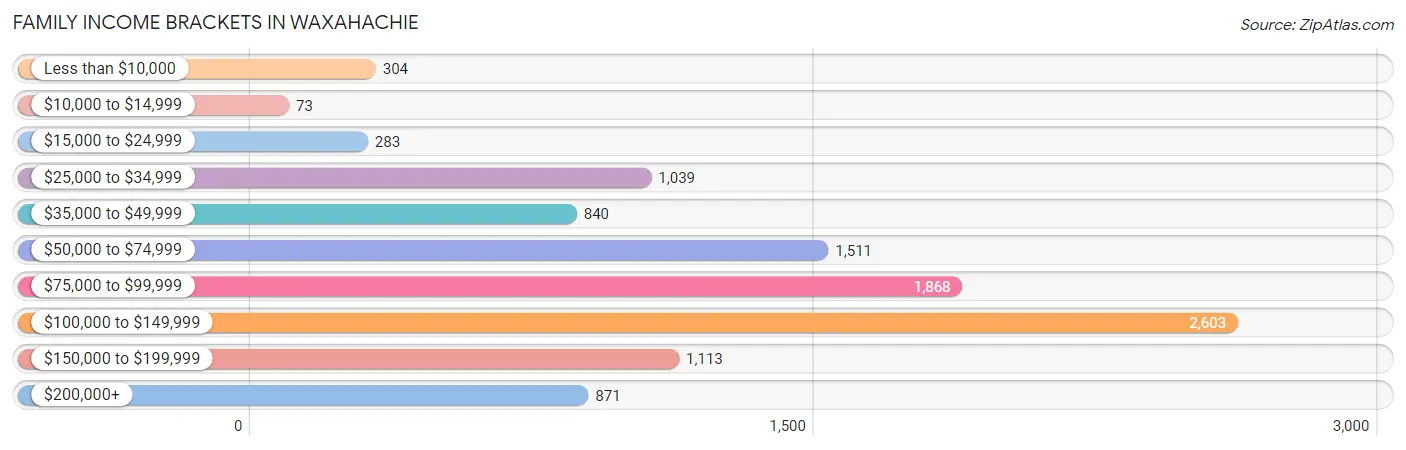
Family Income Brackets in Waxahachie
According to the Waxahachie family income data, there are 2,603 families falling into the $100,000 to $149,999 income range, which is the most common income bracket and makes up 24.8% of all families. Conversely, the $10,000 to $14,999 income bracket is the least frequent group with only 73 families (0.7%) belonging to this category.
| Income Bracket | # Families | % Families |
| Less than $10,000 | 304 | 2.9% |
| $10,000 to $14,999 | 73 | 0.7% |
| $15,000 to $24,999 | 283 | 2.7% |
| $25,000 to $34,999 | 1,039 | 9.9% |
| $35,000 to $49,999 | 840 | 8.0% |
| $50,000 to $74,999 | 1,511 | 14.4% |
| $75,000 to $99,999 | 1,868 | 17.8% |
| $100,000 to $149,999 | 2,603 | 24.8% |
| $150,000 to $199,999 | 1,113 | 10.6% |
| $200,000+ | 871 | 8.3% |
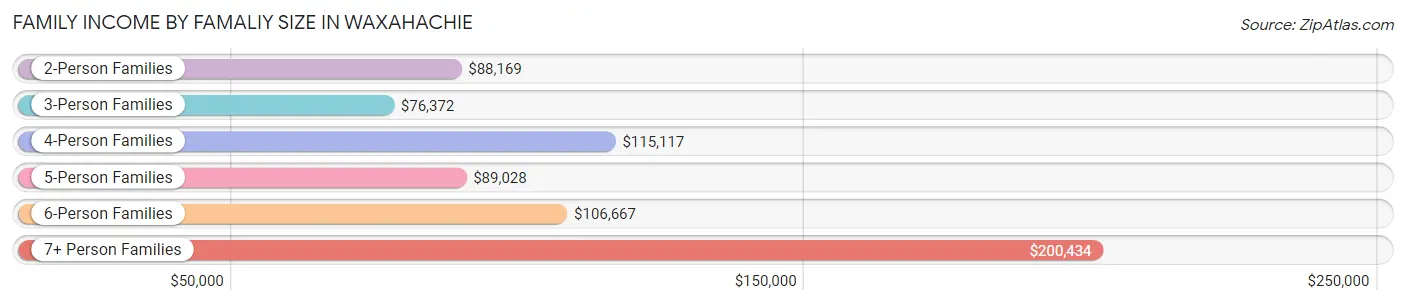
Family Income by Famaliy Size in Waxahachie
7+ person families (235 | 2.2%) account for the highest median family income in Waxahachie with $200,434 per family, while 2-person families (4,376 | 41.7%) have the highest median income of $44,084 per family member.
| Income Bracket | # Families | Median Income |
| 2-Person Families | 4,376 (41.7%) | $88,169 |
| 3-Person Families | 2,369 (22.6%) | $76,372 |
| 4-Person Families | 2,377 (22.7%) | $115,117 |
| 5-Person Families | 775 (7.4%) | $89,028 |
| 6-Person Families | 364 (3.5%) | $106,667 |
| 7+ Person Families | 235 (2.2%) | $200,434 |
| Total | 10,496 (100.0%) | $89,620 |
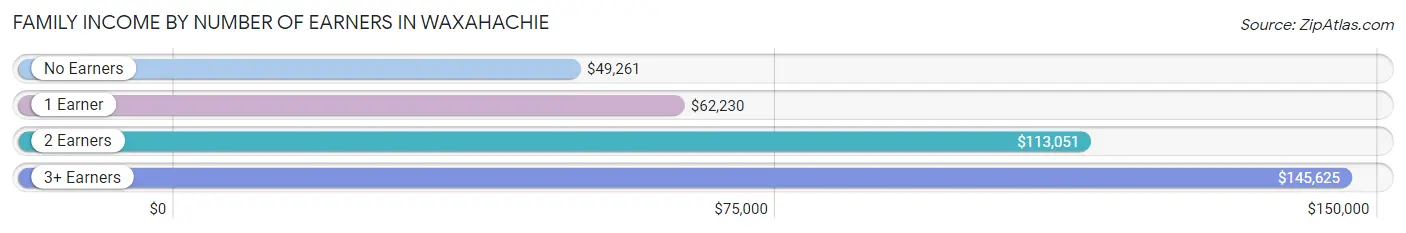
Family Income by Number of Earners in Waxahachie
The median family income in Waxahachie is $89,620, with families comprising 3+ earners (1,418) having the highest median family income of $145,625, while families with no earners (1,013) have the lowest median family income of $49,261, accounting for 13.5% and 9.7% of families, respectively.
| Number of Earners | # Families | Median Income |
| No Earners | 1,013 (9.7%) | $49,261 |
| 1 Earner | 3,093 (29.5%) | $62,230 |
| 2 Earners | 4,972 (47.4%) | $113,051 |
| 3+ Earners | 1,418 (13.5%) | $145,625 |
| Total | 10,496 (100.0%) | $89,620 |
Household Income in Waxahachie
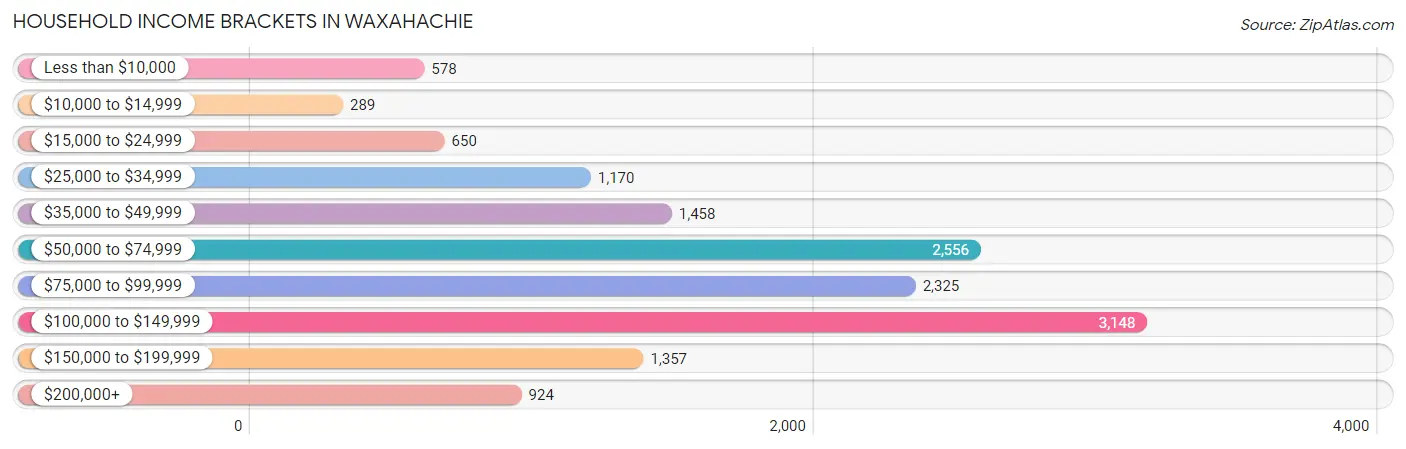
Household Income Brackets in Waxahachie
With 3,148 households falling in the category, the $100,000 to $149,999 income range is the most frequent in Waxahachie, accounting for 21.8% of all households. In contrast, only 289 households (2.0%) fall into the $10,000 to $14,999 income bracket, making it the least populous group.
| Income Bracket | # Households | % Households |
| Less than $10,000 | 578 | 4.0% |
| $10,000 to $14,999 | 289 | 2.0% |
| $15,000 to $24,999 | 650 | 4.5% |
| $25,000 to $34,999 | 1,170 | 8.1% |
| $35,000 to $49,999 | 1,458 | 10.1% |
| $50,000 to $74,999 | 2,556 | 17.7% |
| $75,000 to $99,999 | 2,325 | 16.1% |
| $100,000 to $149,999 | 3,148 | 21.8% |
| $150,000 to $199,999 | 1,357 | 9.4% |
| $200,000+ | 924 | 6.4% |
Household Income by Householder Age in Waxahachie
The median household income in Waxahachie is $80,044, with the highest median household income of $97,965 found in the 45 to 64 years age bracket for the primary householder. A total of 4,322 households (29.9%) fall into this category. Meanwhile, the 15 to 24 years age bracket for the primary householder has the lowest median household income of $54,224, with 560 households (3.9%) in this group.
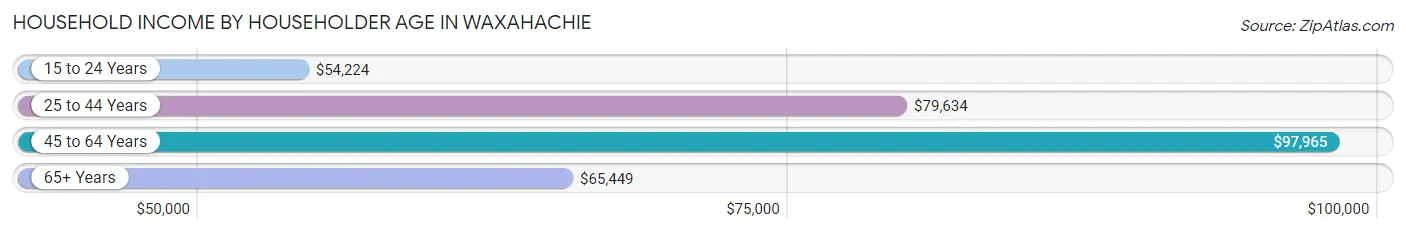
| Income Bracket | # Households | Median Income |
| 15 to 24 Years | 560 (3.9%) | $54,224 |
| 25 to 44 Years | 6,289 (43.6%) | $79,634 |
| 45 to 64 Years | 4,322 (29.9%) | $97,965 |
| 65+ Years | 3,268 (22.6%) | $65,449 |
| Total | 14,439 (100.0%) | $80,044 |
Poverty in Waxahachie
Income Below Poverty by Sex and Age in Waxahachie
With 8.9% poverty level for males and 9.6% for females among the residents of Waxahachie, 15 year old males and 5 year old females are the most vulnerable to poverty, with 72 males (27.0%) and 81 females (26.7%) in their respective age groups living below the poverty level.
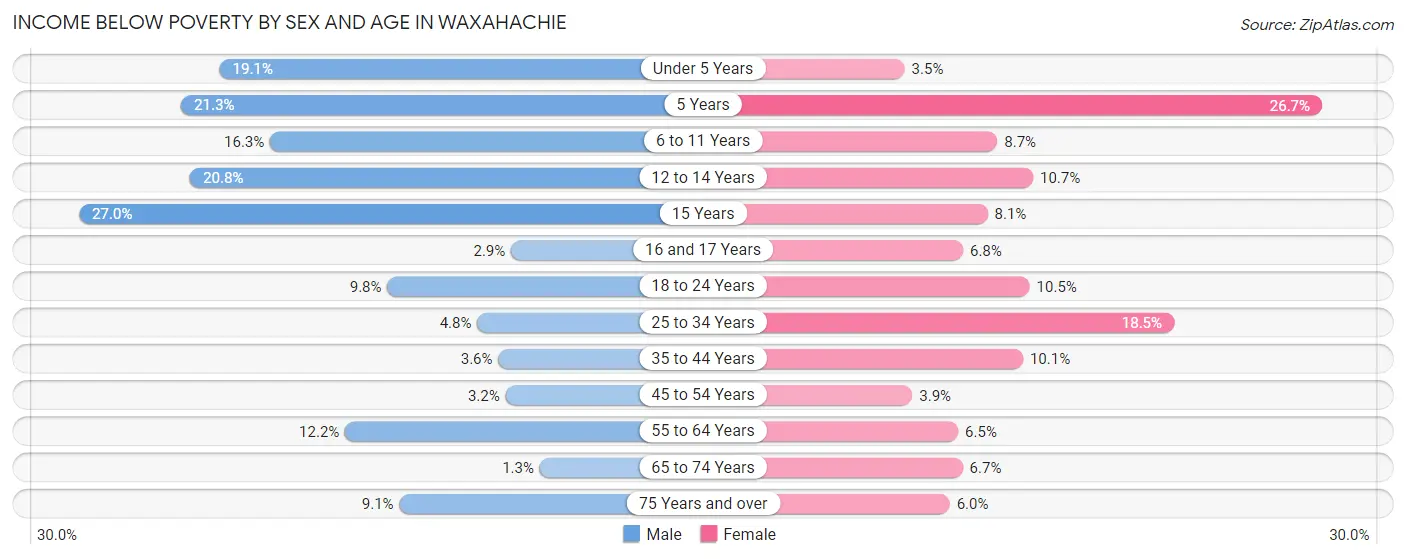
| Age Bracket | Male | Female |
| Under 5 Years | 339 (19.1%) | 50 (3.5%) |
| 5 Years | 63 (21.3%) | 81 (26.7%) |
| 6 to 11 Years | 256 (16.3%) | 158 (8.7%) |
| 12 to 14 Years | 134 (20.8%) | 109 (10.6%) |
| 15 Years | 72 (27.0%) | 31 (8.1%) |
| 16 and 17 Years | 14 (2.9%) | 63 (6.8%) |
| 18 to 24 Years | 207 (9.8%) | 188 (10.5%) |
| 25 to 34 Years | 168 (4.8%) | 650 (18.5%) |
| 35 to 44 Years | 93 (3.6%) | 286 (10.1%) |
| 45 to 54 Years | 63 (3.2%) | 89 (3.9%) |
| 55 to 64 Years | 240 (12.1%) | 115 (6.5%) |
| 65 to 74 Years | 20 (1.3%) | 114 (6.7%) |
| 75 Years and over | 65 (9.1%) | 77 (6.0%) |
| Total | 1,734 (8.9%) | 2,011 (9.6%) |
Income Above Poverty by Sex and Age in Waxahachie
According to the poverty statistics in Waxahachie, males aged 65 to 74 years and females aged under 5 years are the age groups that are most secure financially, with 98.7% of males and 96.5% of females in these age groups living above the poverty line.
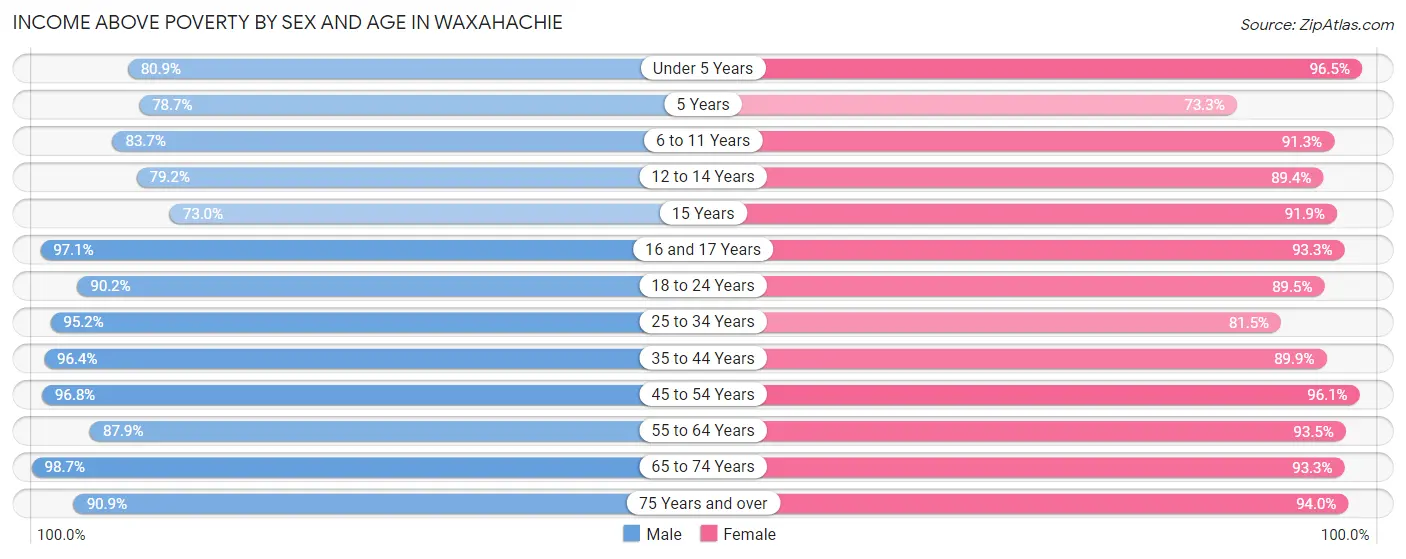
| Age Bracket | Male | Female |
| Under 5 Years | 1,432 (80.9%) | 1,379 (96.5%) |
| 5 Years | 233 (78.7%) | 222 (73.3%) |
| 6 to 11 Years | 1,312 (83.7%) | 1,667 (91.3%) |
| 12 to 14 Years | 511 (79.2%) | 914 (89.3%) |
| 15 Years | 195 (73.0%) | 351 (91.9%) |
| 16 and 17 Years | 467 (97.1%) | 870 (93.2%) |
| 18 to 24 Years | 1,905 (90.2%) | 1,609 (89.5%) |
| 25 to 34 Years | 3,341 (95.2%) | 2,865 (81.5%) |
| 35 to 44 Years | 2,473 (96.4%) | 2,549 (89.9%) |
| 45 to 54 Years | 1,891 (96.8%) | 2,175 (96.1%) |
| 55 to 64 Years | 1,736 (87.8%) | 1,659 (93.5%) |
| 65 to 74 Years | 1,509 (98.7%) | 1,580 (93.3%) |
| 75 Years and over | 647 (90.9%) | 1,205 (94.0%) |
| Total | 17,652 (91.1%) | 19,045 (90.4%) |
Income Below Poverty Among Married-Couple Families in Waxahachie
The poverty statistics for married-couple families in Waxahachie show that 2.6% or 188 of the total 7,351 families live below the poverty line. Families with 3 or 4 children have the highest poverty rate of 9.2%, comprising of 63 families. On the other hand, families with 5 or more children have the lowest poverty rate of 0.0%, which includes 0 families.
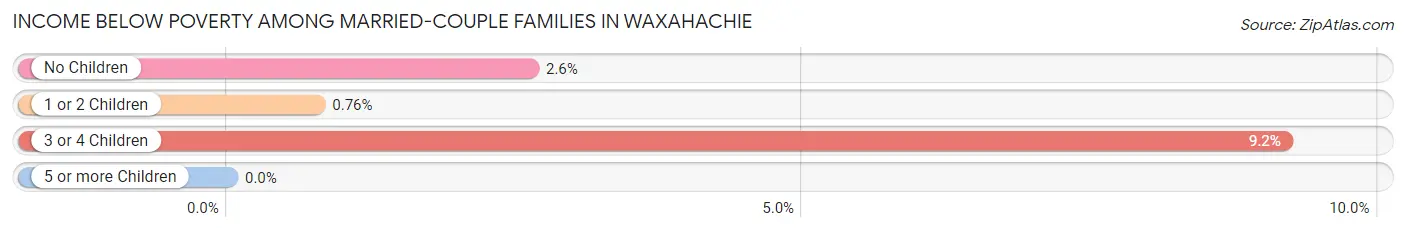
| Children | Above Poverty | Below Poverty |
| No Children | 3,906 (97.4%) | 105 (2.6%) |
| 1 or 2 Children | 2,614 (99.2%) | 20 (0.8%) |
| 3 or 4 Children | 623 (90.8%) | 63 (9.2%) |
| 5 or more Children | 20 (100.0%) | 0 (0.0%) |
| Total | 7,163 (97.4%) | 188 (2.6%) |
Income Below Poverty Among Single-Parent Households in Waxahachie
According to the poverty data in Waxahachie, 9.7% or 73 single-father households and 20.9% or 500 single-mother households are living below the poverty line. Among single-father households, those with no children have the highest poverty rate, with 58 households (16.8%) experiencing poverty. Likewise, among single-mother households, those with 5 or more children have the highest poverty rate, with 15 households (100.0%) falling below the poverty line.
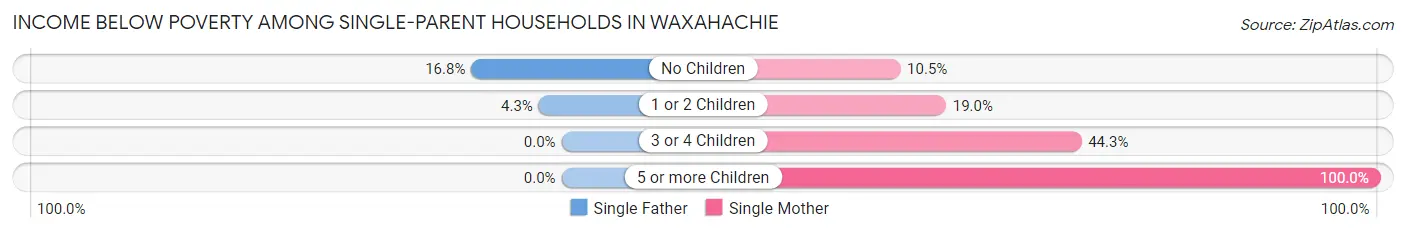
| Children | Single Father | Single Mother |
| No Children | 58 (16.8%) | 65 (10.5%) |
| 1 or 2 Children | 15 (4.3%) | 270 (19.0%) |
| 3 or 4 Children | 0 (0.0%) | 150 (44.3%) |
| 5 or more Children | 0 (0.0%) | 15 (100.0%) |
| Total | 73 (9.7%) | 500 (20.9%) |
Income Below Poverty Among Married-Couple vs Single-Parent Households in Waxahachie
The poverty data for Waxahachie shows that 188 of the married-couple family households (2.6%) and 573 of the single-parent households (18.2%) are living below the poverty level. Within the married-couple family households, those with 3 or 4 children have the highest poverty rate, with 63 households (9.2%) falling below the poverty line. Among the single-parent households, those with 5 or more children have the highest poverty rate, with 15 household (100.0%) living below poverty.
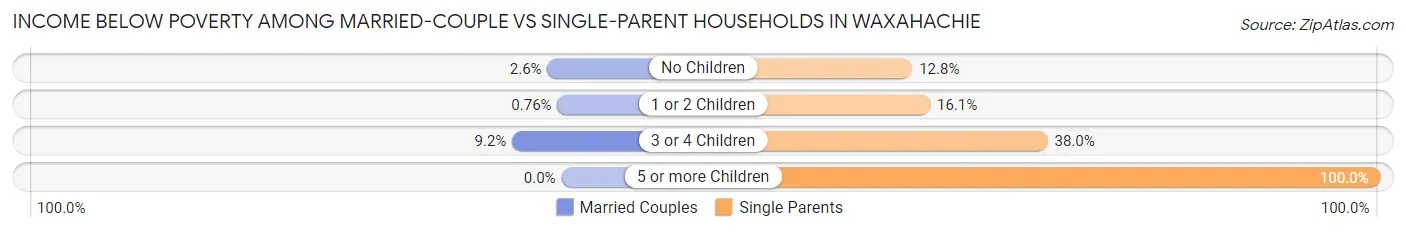
| Children | Married-Couple Families | Single-Parent Households |
| No Children | 105 (2.6%) | 123 (12.8%) |
| 1 or 2 Children | 20 (0.8%) | 285 (16.1%) |
| 3 or 4 Children | 63 (9.2%) | 150 (38.0%) |
| 5 or more Children | 0 (0.0%) | 15 (100.0%) |
| Total | 188 (2.6%) | 573 (18.2%) |
Race in Waxahachie
The most populous races in Waxahachie are White / Caucasian (28,190 | 67.4%), Hispanic or Latino (10,004 | 23.9%), and Black / African American (7,112 | 17.0%).
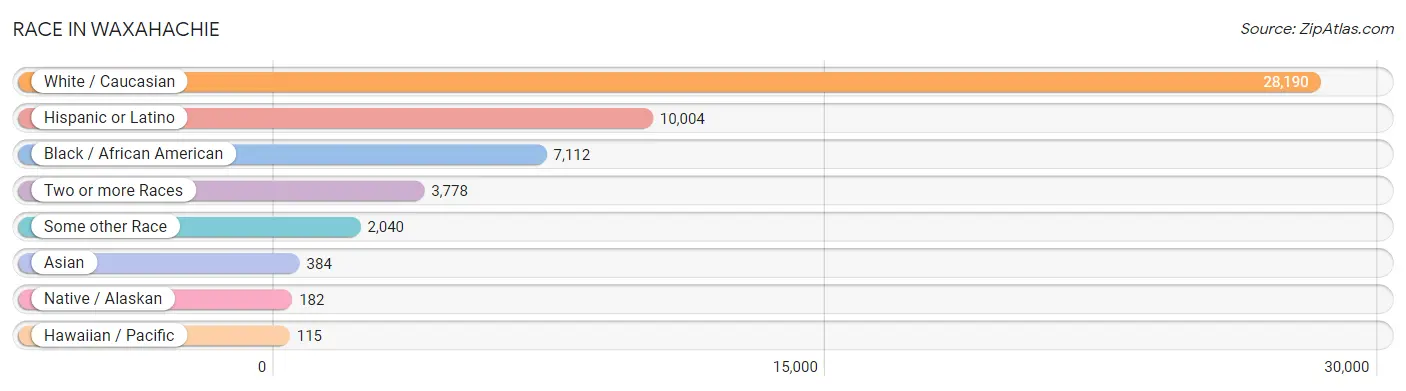
| Race | # Population | % Population |
| Asian | 384 | 0.9% |
| Black / African American | 7,112 | 17.0% |
| Hawaiian / Pacific | 115 | 0.3% |
| Hispanic or Latino | 10,004 | 23.9% |
| Native / Alaskan | 182 | 0.4% |
| White / Caucasian | 28,190 | 67.4% |
| Two or more Races | 3,778 | 9.0% |
| Some other Race | 2,040 | 4.9% |
| Total | 41,801 | 100.0% |
Ancestry in Waxahachie
The most populous ancestries reported in Waxahachie are Mexican (8,580 | 20.5%), English (4,314 | 10.3%), German (3,868 | 9.2%), Irish (3,286 | 7.9%), and American (2,798 | 6.7%), together accounting for 54.6% of all Waxahachie residents.
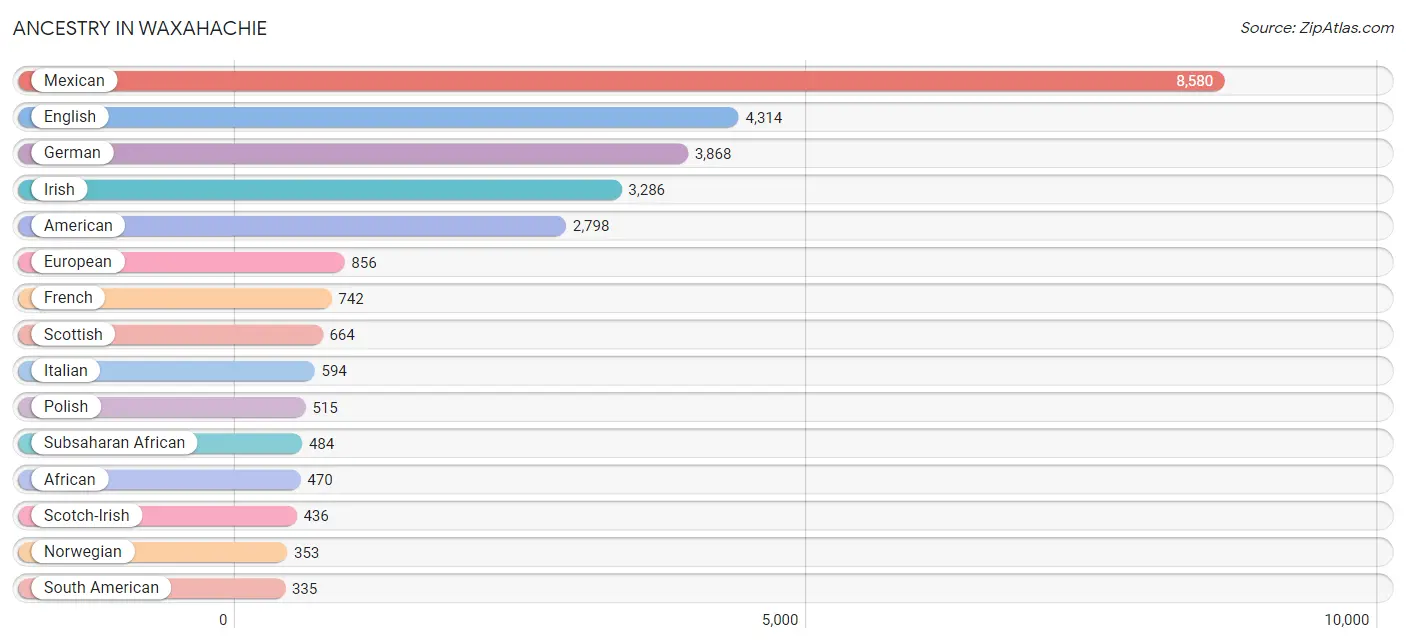
| Ancestry | # Population | % Population |
| African | 470 | 1.1% |
| American | 2,798 | 6.7% |
| Apache | 14 | 0.0% |
| Arab | 23 | 0.1% |
| Belizean | 39 | 0.1% |
| Bhutanese | 92 | 0.2% |
| Brazilian | 157 | 0.4% |
| British | 318 | 0.8% |
| British West Indian | 19 | 0.1% |
| Central American | 323 | 0.8% |
| Central American Indian | 100 | 0.2% |
| Cherokee | 165 | 0.4% |
| Chickasaw | 28 | 0.1% |
| Choctaw | 19 | 0.1% |
| Colombian | 135 | 0.3% |
| Comanche | 41 | 0.1% |
| Costa Rican | 10 | 0.0% |
| Cree | 28 | 0.1% |
| Cuban | 217 | 0.5% |
| Czech | 267 | 0.6% |
| Czechoslovakian | 85 | 0.2% |
| Danish | 53 | 0.1% |
| Dominican | 32 | 0.1% |
| Dutch | 202 | 0.5% |
| Eastern European | 13 | 0.0% |
| Ecuadorian | 174 | 0.4% |
| English | 4,314 | 10.3% |
| European | 856 | 2.1% |
| Filipino | 52 | 0.1% |
| French | 742 | 1.8% |
| French Canadian | 16 | 0.0% |
| German | 3,868 | 9.2% |
| Greek | 165 | 0.4% |
| Guatemalan | 3 | 0.0% |
| Haitian | 21 | 0.1% |
| Honduran | 67 | 0.2% |
| Hungarian | 38 | 0.1% |
| Indian (Asian) | 28 | 0.1% |
| Irish | 3,286 | 7.9% |
| Italian | 594 | 1.4% |
| Jamaican | 161 | 0.4% |
| Japanese | 175 | 0.4% |
| Korean | 200 | 0.5% |
| Laotian | 63 | 0.2% |
| Lebanese | 15 | 0.0% |
| Marshallese | 6 | 0.0% |
| Mexican | 8,580 | 20.5% |
| Mexican American Indian | 80 | 0.2% |
| Native Hawaiian | 109 | 0.3% |
| Northern European | 47 | 0.1% |
| Norwegian | 353 | 0.8% |
| Peruvian | 7 | 0.0% |
| Polish | 515 | 1.2% |
| Portuguese | 49 | 0.1% |
| Puerto Rican | 240 | 0.6% |
| Russian | 32 | 0.1% |
| Salvadoran | 243 | 0.6% |
| Scandinavian | 171 | 0.4% |
| Scotch-Irish | 436 | 1.0% |
| Scottish | 664 | 1.6% |
| Serbian | 12 | 0.0% |
| South African | 14 | 0.0% |
| South American | 335 | 0.8% |
| Spaniard | 260 | 0.6% |
| Spanish | 17 | 0.0% |
| Subsaharan African | 484 | 1.2% |
| Swedish | 213 | 0.5% |
| Thai | 32 | 0.1% |
| Venezuelan | 19 | 0.1% |
| Welsh | 204 | 0.5% |
| West Indian | 135 | 0.3% |
| Yugoslavian | 13 | 0.0% | View All 72 Rows |
Immigrants in Waxahachie
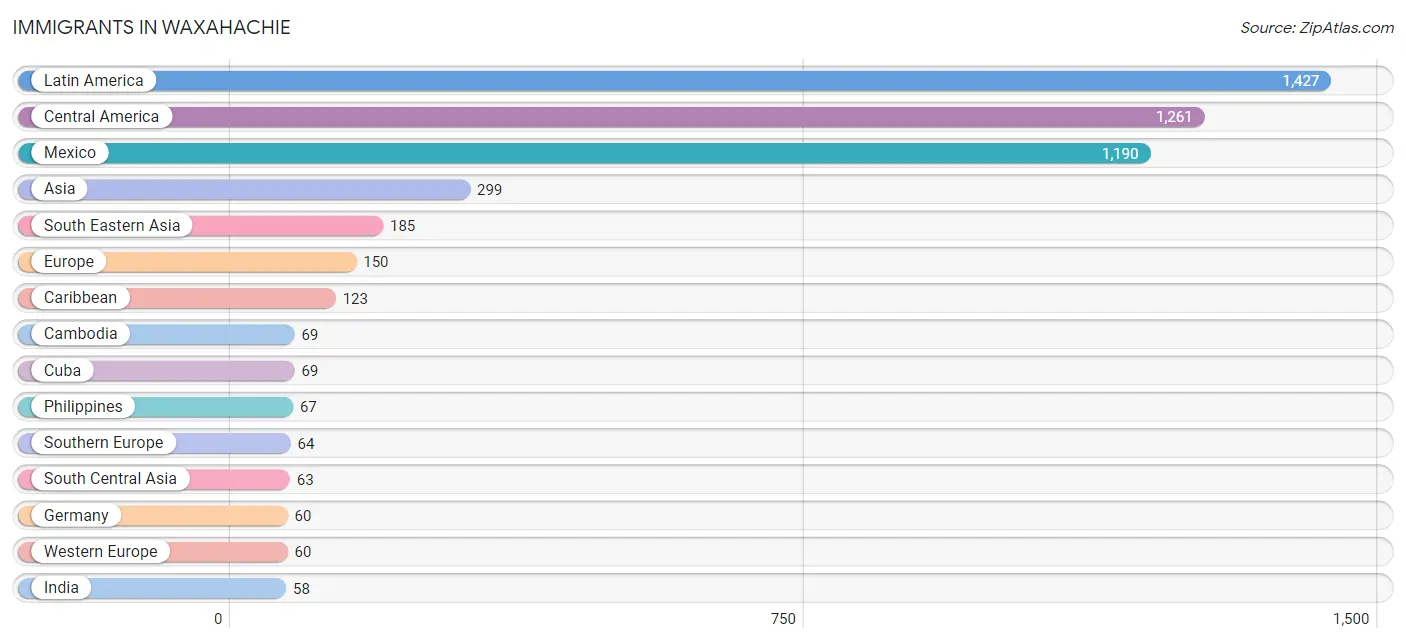
The most numerous immigrant groups reported in Waxahachie came from Latin America (1,427 | 3.4%), Central America (1,261 | 3.0%), Mexico (1,190 | 2.9%), Asia (299 | 0.7%), and South Eastern Asia (185 | 0.4%), together accounting for 10.4% of all Waxahachie residents.
| Immigration Origin | # Population | % Population |
| Africa | 14 | 0.0% |
| Asia | 299 | 0.7% |
| Belize | 39 | 0.1% |
| Cambodia | 69 | 0.2% |
| Canada | 9 | 0.0% |
| Caribbean | 123 | 0.3% |
| Central America | 1,261 | 3.0% |
| China | 28 | 0.1% |
| Colombia | 24 | 0.1% |
| Cuba | 69 | 0.2% |
| Eastern Asia | 28 | 0.1% |
| Eastern Europe | 8 | 0.0% |
| El Salvador | 32 | 0.1% |
| England | 18 | 0.0% |
| Europe | 150 | 0.4% |
| Germany | 60 | 0.1% |
| Greece | 53 | 0.1% |
| Haiti | 21 | 0.1% |
| India | 58 | 0.1% |
| Indonesia | 16 | 0.0% |
| Iran | 5 | 0.0% |
| Latin America | 1,427 | 3.4% |
| Lebanon | 15 | 0.0% |
| Mexico | 1,190 | 2.9% |
| Micronesia | 6 | 0.0% |
| Northern Europe | 18 | 0.0% |
| Oceania | 31 | 0.1% |
| Philippines | 67 | 0.2% |
| Portugal | 11 | 0.0% |
| South Africa | 14 | 0.0% |
| South America | 43 | 0.1% |
| South Central Asia | 63 | 0.2% |
| South Eastern Asia | 185 | 0.4% |
| Southern Europe | 64 | 0.2% |
| Taiwan | 28 | 0.1% |
| Thailand | 33 | 0.1% |
| Trinidad and Tobago | 33 | 0.1% |
| Ukraine | 8 | 0.0% |
| Venezuela | 19 | 0.1% |
| Western Asia | 23 | 0.1% |
| Western Europe | 60 | 0.1% | View All 41 Rows |
Sex and Age in Waxahachie
Sex and Age in Waxahachie
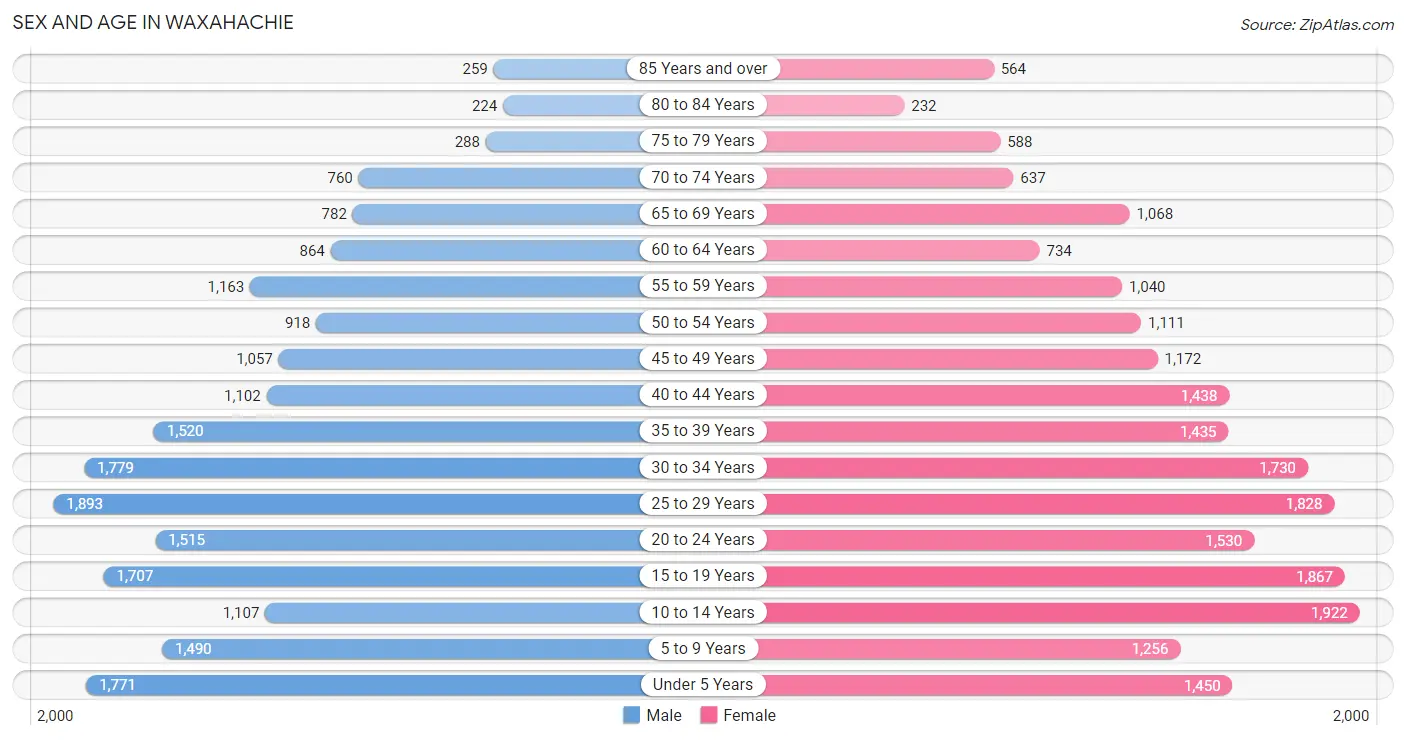
The most populous age groups in Waxahachie are 25 to 29 Years (1,893 | 9.4%) for men and 10 to 14 Years (1,922 | 8.9%) for women.
| Age Bracket | Male | Female |
| Under 5 Years | 1,771 (8.8%) | 1,450 (6.7%) |
| 5 to 9 Years | 1,490 (7.4%) | 1,256 (5.8%) |
| 10 to 14 Years | 1,107 (5.5%) | 1,922 (8.9%) |
| 15 to 19 Years | 1,707 (8.5%) | 1,867 (8.6%) |
| 20 to 24 Years | 1,515 (7.5%) | 1,530 (7.1%) |
| 25 to 29 Years | 1,893 (9.4%) | 1,828 (8.5%) |
| 30 to 34 Years | 1,779 (8.8%) | 1,730 (8.0%) |
| 35 to 39 Years | 1,520 (7.5%) | 1,435 (6.6%) |
| 40 to 44 Years | 1,102 (5.5%) | 1,438 (6.7%) |
| 45 to 49 Years | 1,057 (5.2%) | 1,172 (5.4%) |
| 50 to 54 Years | 918 (4.5%) | 1,111 (5.1%) |
| 55 to 59 Years | 1,163 (5.8%) | 1,040 (4.8%) |
| 60 to 64 Years | 864 (4.3%) | 734 (3.4%) |
| 65 to 69 Years | 782 (3.9%) | 1,068 (4.9%) |
| 70 to 74 Years | 760 (3.8%) | 637 (2.9%) |
| 75 to 79 Years | 288 (1.4%) | 588 (2.7%) |
| 80 to 84 Years | 224 (1.1%) | 232 (1.1%) |
| 85 Years and over | 259 (1.3%) | 564 (2.6%) |
| Total | 20,199 (100.0%) | 21,602 (100.0%) |
Families and Households in Waxahachie
Median Family Size in Waxahachie
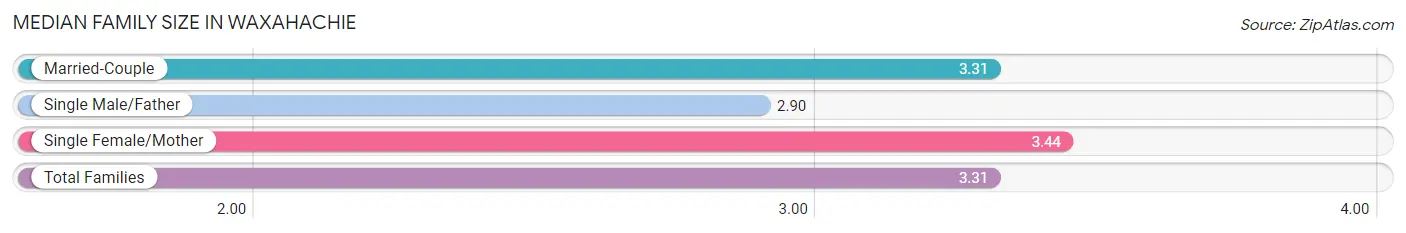
The median family size in Waxahachie is 3.31 persons per family, with single female/mother families (2,391 | 22.8%) accounting for the largest median family size of 3.44 persons per family. On the other hand, single male/father families (754 | 7.2%) represent the smallest median family size with 2.90 persons per family.
| Family Type | # Families | Family Size |
| Married-Couple | 7,351 (70.0%) | 3.31 |
| Single Male/Father | 754 (7.2%) | 2.90 |
| Single Female/Mother | 2,391 (22.8%) | 3.44 |
| Total Families | 10,496 (100.0%) | 3.31 |
Median Household Size in Waxahachie
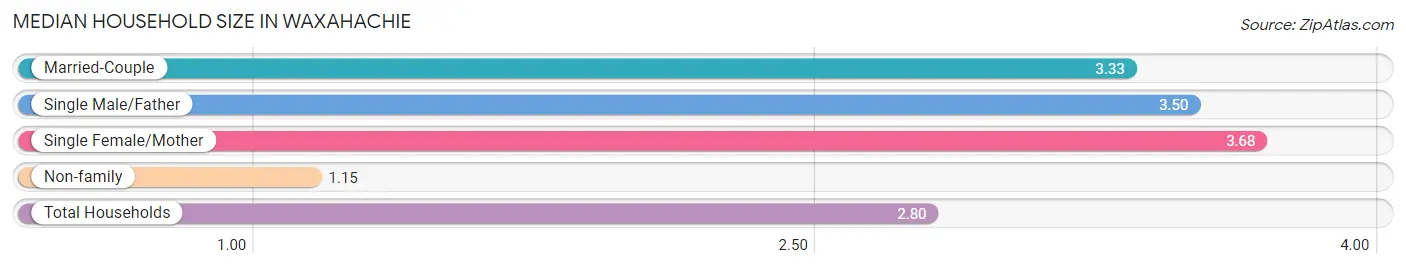
The median household size in Waxahachie is 2.80 persons per household, with single female/mother households (2,391 | 16.6%) accounting for the largest median household size of 3.68 persons per household. non-family households (3,943 | 27.3%) represent the smallest median household size with 1.15 persons per household.
| Household Type | # Households | Household Size |
| Married-Couple | 7,351 (50.9%) | 3.33 |
| Single Male/Father | 754 (5.2%) | 3.50 |
| Single Female/Mother | 2,391 (16.6%) | 3.68 |
| Non-family | 3,943 (27.3%) | 1.15 |
| Total Households | 14,439 (100.0%) | 2.80 |
Household Size by Marriage Status in Waxahachie
Out of a total of 14,439 households in Waxahachie, 10,496 (72.7%) are family households, while 3,943 (27.3%) are nonfamily households. The most numerous type of family households are 2-person households, comprising 4,074, and the most common type of nonfamily households are 1-person households, comprising 3,528.
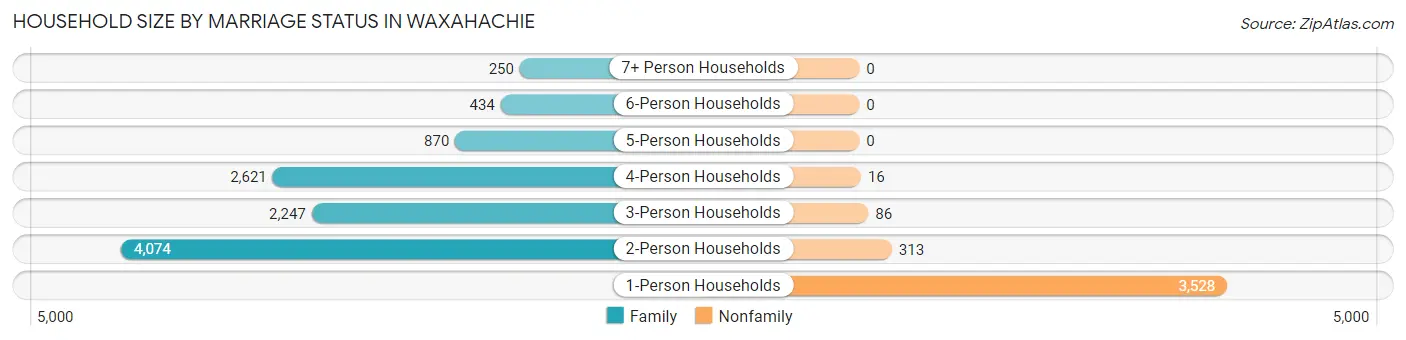
| Household Size | Family Households | Nonfamily Households |
| 1-Person Households | - | 3,528 (24.4%) |
| 2-Person Households | 4,074 (28.2%) | 313 (2.2%) |
| 3-Person Households | 2,247 (15.6%) | 86 (0.6%) |
| 4-Person Households | 2,621 (18.1%) | 16 (0.1%) |
| 5-Person Households | 870 (6.0%) | 0 (0.0%) |
| 6-Person Households | 434 (3.0%) | 0 (0.0%) |
| 7+ Person Households | 250 (1.7%) | 0 (0.0%) |
| Total | 10,496 (72.7%) | 3,943 (27.3%) |
Female Fertility in Waxahachie
Fertility by Age in Waxahachie
Average fertility rate in Waxahachie is 59.0 births per 1,000 women. Women in the age bracket of 20 to 34 years have the highest fertility rate with 110.0 births per 1,000 women. Women in the age bracket of 20 to 34 years acount for 85.5% of all women with births.
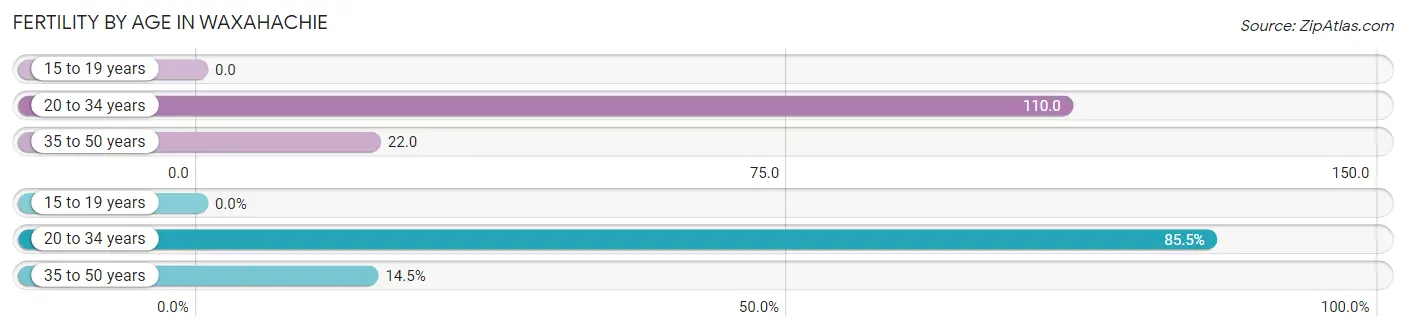
| Age Bracket | Women with Births | Births / 1,000 Women |
| 15 to 19 years | 0 (0.0%) | 0.0 |
| 20 to 34 years | 562 (85.5%) | 110.0 |
| 35 to 50 years | 95 (14.5%) | 22.0 |
| Total | 657 (100.0%) | 59.0 |
Fertility by Age by Marriage Status in Waxahachie
64.7% of women with births (657) in Waxahachie are married. The highest percentage of unmarried women with births falls into 20 to 34 years age bracket with 36.1% of them unmarried at the time of birth, while the lowest percentage of unmarried women with births belong to 35 to 50 years age bracket with 30.5% of them unmarried.
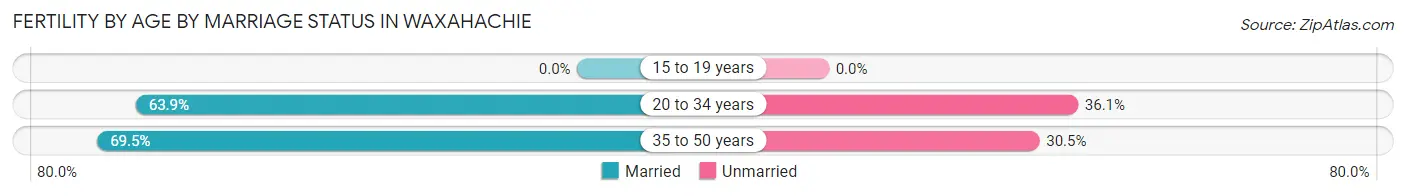
| Age Bracket | Married | Unmarried |
| 15 to 19 years | 0 (0.0%) | 0 (0.0%) |
| 20 to 34 years | 359 (63.9%) | 203 (36.1%) |
| 35 to 50 years | 66 (69.5%) | 29 (30.5%) |
| Total | 425 (64.7%) | 232 (35.3%) |
Fertility by Education in Waxahachie
Average fertility rate in Waxahachie is 59.0 births per 1,000 women. Women with the education attainment of high school diploma have the highest fertility rate of 117.0 births per 1,000 women, while women with the education attainment of graduate degree have the lowest fertility at 14.0 births per 1,000 women. Women with the education attainment of high school diploma represent 40.9% of all women with births.
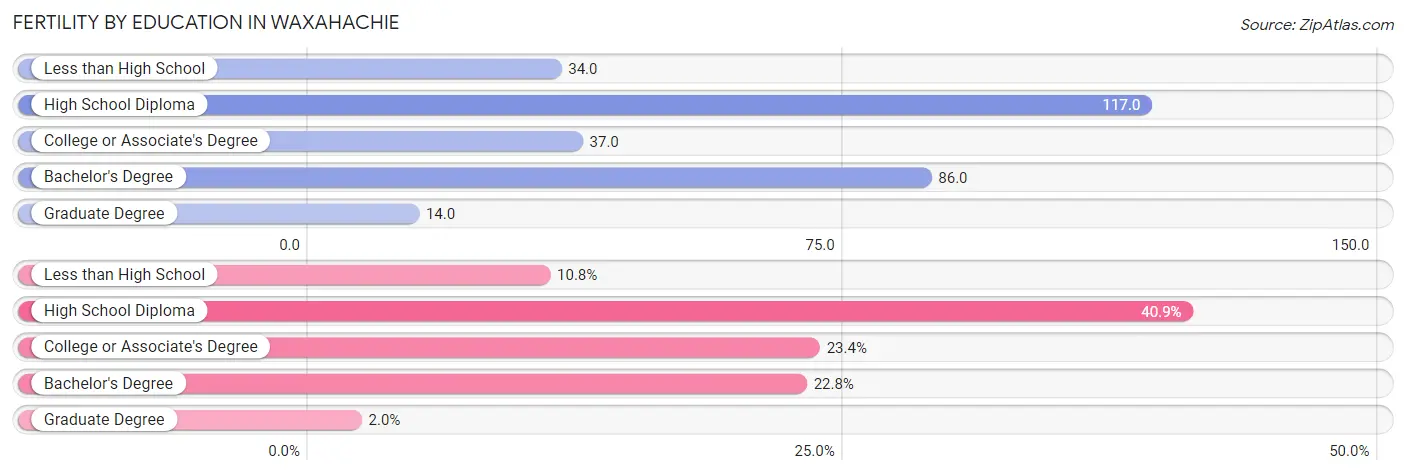
| Educational Attainment | Women with Births | Births / 1,000 Women |
| Less than High School | 71 (10.8%) | 34.0 |
| High School Diploma | 269 (40.9%) | 117.0 |
| College or Associate's Degree | 154 (23.4%) | 37.0 |
| Bachelor's Degree | 150 (22.8%) | 86.0 |
| Graduate Degree | 13 (2.0%) | 14.0 |
| Total | 657 (100.0%) | 59.0 |
Fertility by Education by Marriage Status in Waxahachie
35.3% of women with births in Waxahachie are unmarried. Women with the educational attainment of bachelor's degree are most likely to be married with 100.0% of them married at childbirth, while women with the educational attainment of less than high school are least likely to be married with 87.3% of them unmarried at childbirth.
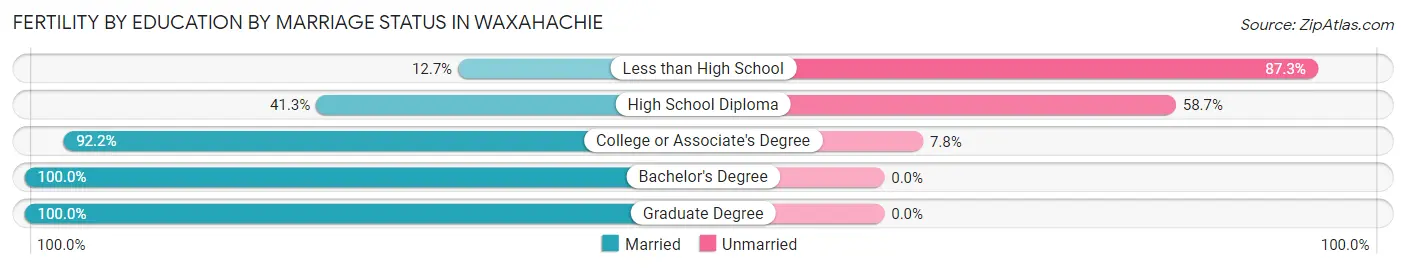
| Educational Attainment | Married | Unmarried |
| Less than High School | 9 (12.7%) | 62 (87.3%) |
| High School Diploma | 111 (41.3%) | 158 (58.7%) |
| College or Associate's Degree | 142 (92.2%) | 12 (7.8%) |
| Bachelor's Degree | 150 (100.0%) | 0 (0.0%) |
| Graduate Degree | 13 (100.0%) | 0 (0.0%) |
| Total | 425 (64.7%) | 232 (35.3%) |
Employment Characteristics in Waxahachie
Employment by Class of Employer in Waxahachie
Among the 21,017 employed individuals in Waxahachie, private company employees (14,971 | 71.2%), local government employees (1,871 | 8.9%), and not-for-profit organizations (1,688 | 8.0%) make up the most common classes of employment.
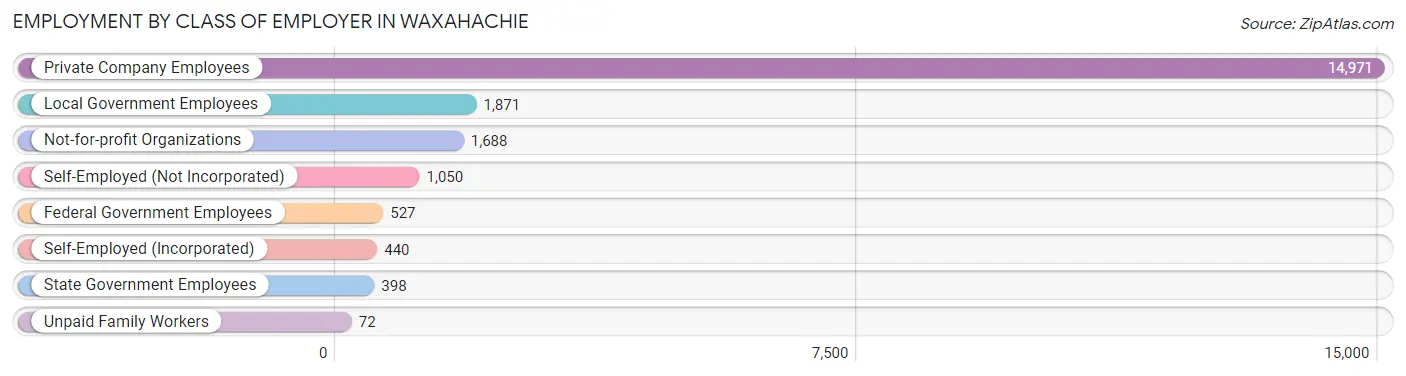
| Employer Class | # Employees | % Employees |
| Private Company Employees | 14,971 | 71.2% |
| Self-Employed (Incorporated) | 440 | 2.1% |
| Self-Employed (Not Incorporated) | 1,050 | 5.0% |
| Not-for-profit Organizations | 1,688 | 8.0% |
| Local Government Employees | 1,871 | 8.9% |
| State Government Employees | 398 | 1.9% |
| Federal Government Employees | 527 | 2.5% |
| Unpaid Family Workers | 72 | 0.3% |
| Total | 21,017 | 100.0% |
Employment Status by Age in Waxahachie
According to the labor force statistics for Waxahachie, out of the total population over 16 years of age (32,109), 68.3% or 21,930 individuals are in the labor force, with 3.1% or 680 of them unemployed. The age group with the highest labor force participation rate is 35 to 44 years, with 90.2% or 4,956 individuals in the labor force. Within the labor force, the 16 to 19 years age range has the highest percentage of unemployed individuals, with 18.7% or 225 of them being unemployed.
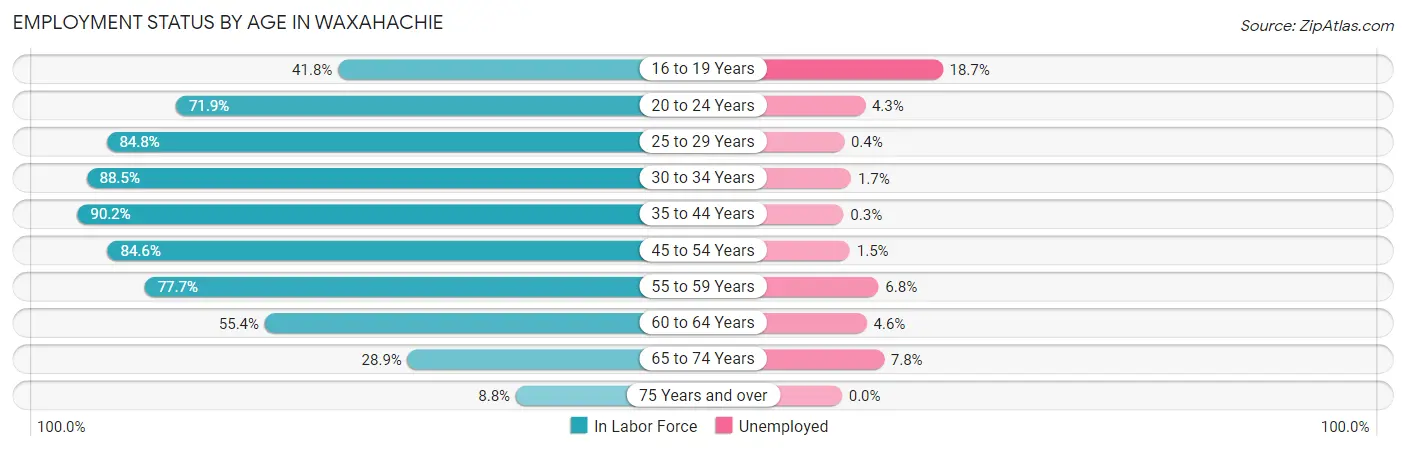
| Age Bracket | In Labor Force | Unemployed |
| 16 to 19 Years | 1,203 (41.8%) | 225 (18.7%) |
| 20 to 24 Years | 2,189 (71.9%) | 94 (4.3%) |
| 25 to 29 Years | 3,155 (84.8%) | 13 (0.4%) |
| 30 to 34 Years | 3,105 (88.5%) | 53 (1.7%) |
| 35 to 44 Years | 4,956 (90.2%) | 15 (0.3%) |
| 45 to 54 Years | 3,602 (84.6%) | 54 (1.5%) |
| 55 to 59 Years | 1,712 (77.7%) | 116 (6.8%) |
| 60 to 64 Years | 885 (55.4%) | 41 (4.6%) |
| 65 to 74 Years | 938 (28.9%) | 73 (7.8%) |
| 75 Years and over | 190 (8.8%) | 0 (0.0%) |
| Total | 21,930 (68.3%) | 680 (3.1%) |
Employment Status by Educational Attainment in Waxahachie
According to labor force statistics for Waxahachie, 83.8% of individuals (17,417) out of the total population between 25 and 64 years of age (20,784) are in the labor force, with 1.7% or 296 of them being unemployed. The group with the highest labor force participation rate are those with the educational attainment of bachelor's degree or higher, with 90.9% or 5,089 individuals in the labor force. Within the labor force, individuals with high school diploma education have the highest percentage of unemployment, with 3.0% or 129 of them being unemployed.
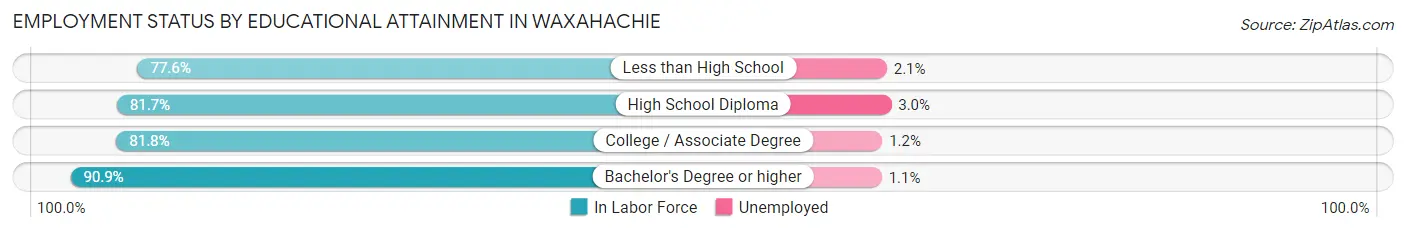
| Educational Attainment | In Labor Force | Unemployed |
| Less than High School | 1,640 (77.6%) | 44 (2.1%) |
| High School Diploma | 4,292 (81.7%) | 158 (3.0%) |
| College / Associate Degree | 6,395 (81.8%) | 94 (1.2%) |
| Bachelor's Degree or higher | 5,089 (90.9%) | 62 (1.1%) |
| Total | 17,417 (83.8%) | 353 (1.7%) |
Employment Occupations by Sex in Waxahachie
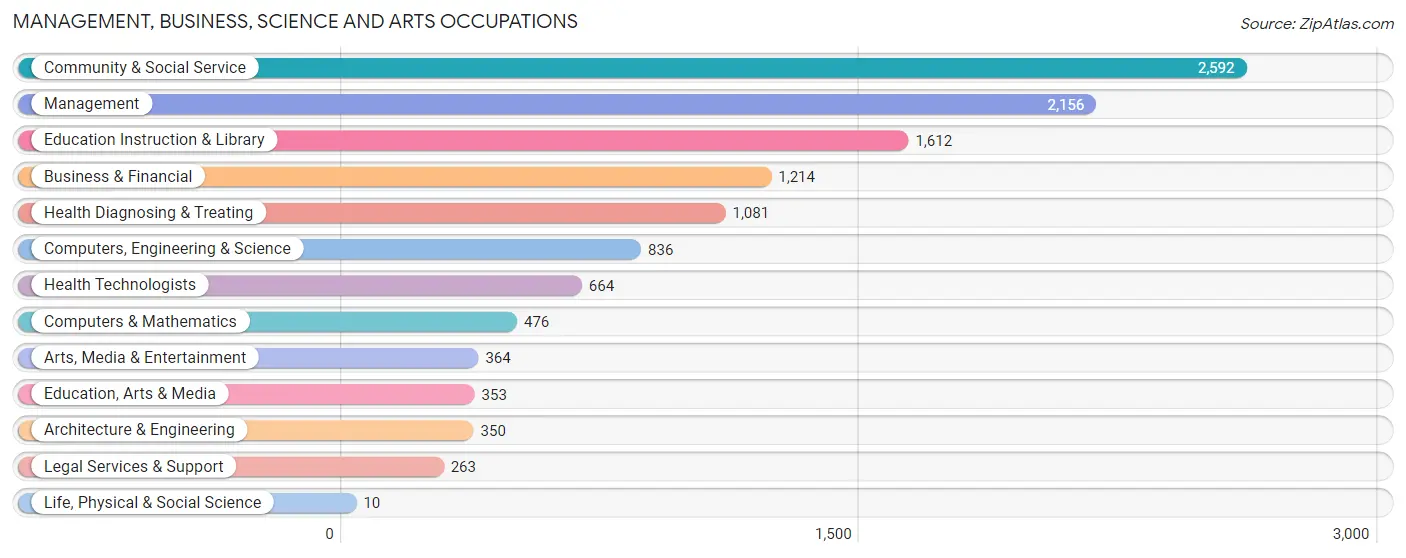
Management, Business, Science and Arts Occupations
The most common Management, Business, Science and Arts occupations in Waxahachie are Community & Social Service (2,592 | 12.2%), Management (2,156 | 10.2%), Education Instruction & Library (1,612 | 7.6%), Business & Financial (1,214 | 5.7%), and Health Diagnosing & Treating (1,081 | 5.1%).
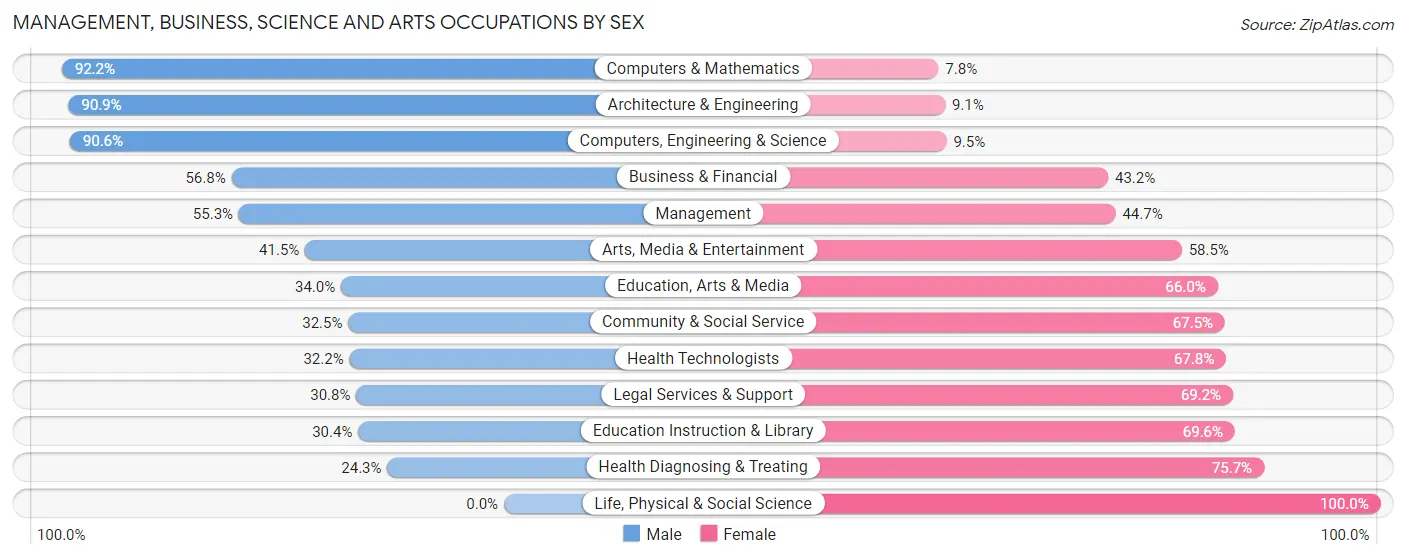
Management, Business, Science and Arts Occupations by Sex
Within the Management, Business, Science and Arts occupations in Waxahachie, the most male-oriented occupations are Computers & Mathematics (92.2%), Architecture & Engineering (90.9%), and Computers, Engineering & Science (90.5%), while the most female-oriented occupations are Life, Physical & Social Science (100.0%), Health Diagnosing & Treating (75.7%), and Education Instruction & Library (69.6%).
| Occupation | Male | Female |
| Management | 1,192 (55.3%) | 964 (44.7%) |
| Business & Financial | 690 (56.8%) | 524 (43.2%) |
| Computers, Engineering & Science | 757 (90.5%) | 79 (9.5%) |
| Computers & Mathematics | 439 (92.2%) | 37 (7.8%) |
| Architecture & Engineering | 318 (90.9%) | 32 (9.1%) |
| Life, Physical & Social Science | 0 (0.0%) | 10 (100.0%) |
| Community & Social Service | 842 (32.5%) | 1,750 (67.5%) |
| Education, Arts & Media | 120 (34.0%) | 233 (66.0%) |
| Legal Services & Support | 81 (30.8%) | 182 (69.2%) |
| Education Instruction & Library | 490 (30.4%) | 1,122 (69.6%) |
| Arts, Media & Entertainment | 151 (41.5%) | 213 (58.5%) |
| Health Diagnosing & Treating | 263 (24.3%) | 818 (75.7%) |
| Health Technologists | 214 (32.2%) | 450 (67.8%) |
| Total (Category) | 3,744 (47.5%) | 4,135 (52.5%) |
| Total (Overall) | 10,945 (51.5%) | 10,292 (48.5%) |
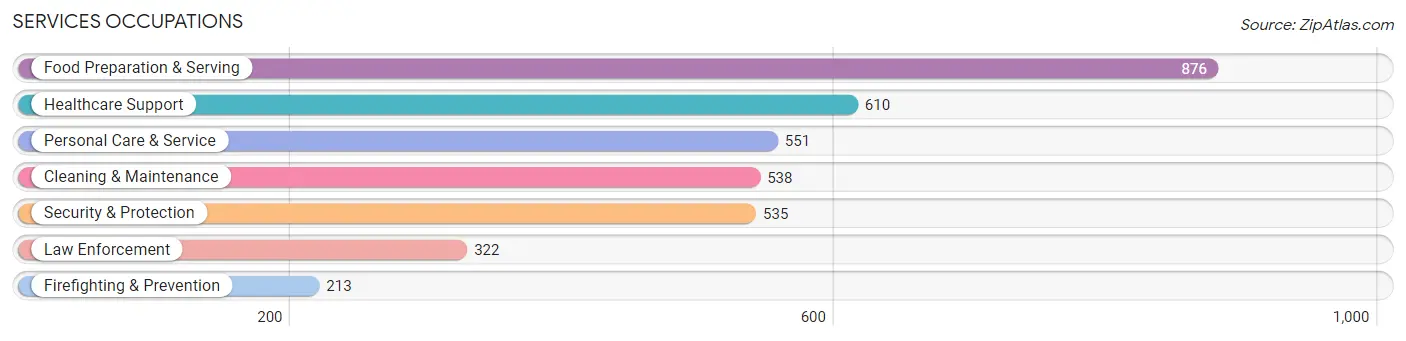
Services Occupations
The most common Services occupations in Waxahachie are Food Preparation & Serving (876 | 4.1%), Healthcare Support (610 | 2.9%), Personal Care & Service (551 | 2.6%), Cleaning & Maintenance (538 | 2.5%), and Security & Protection (535 | 2.5%).
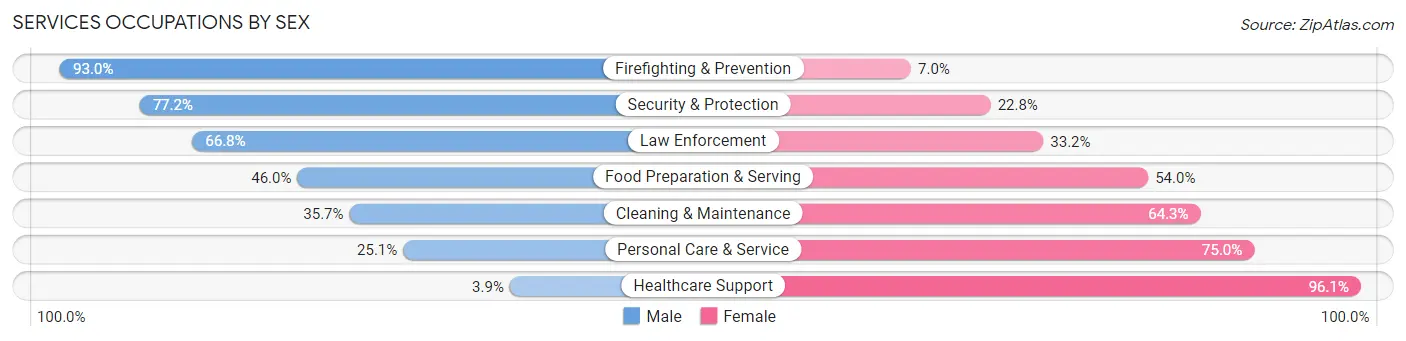
Services Occupations by Sex
Within the Services occupations in Waxahachie, the most male-oriented occupations are Firefighting & Prevention (93.0%), Security & Protection (77.2%), and Law Enforcement (66.8%), while the most female-oriented occupations are Healthcare Support (96.1%), Personal Care & Service (75.0%), and Cleaning & Maintenance (64.3%).
| Occupation | Male | Female |
| Healthcare Support | 24 (3.9%) | 586 (96.1%) |
| Security & Protection | 413 (77.2%) | 122 (22.8%) |
| Firefighting & Prevention | 198 (93.0%) | 15 (7.0%) |
| Law Enforcement | 215 (66.8%) | 107 (33.2%) |
| Food Preparation & Serving | 403 (46.0%) | 473 (54.0%) |
| Cleaning & Maintenance | 192 (35.7%) | 346 (64.3%) |
| Personal Care & Service | 138 (25.1%) | 413 (75.0%) |
| Total (Category) | 1,170 (37.6%) | 1,940 (62.4%) |
| Total (Overall) | 10,945 (51.5%) | 10,292 (48.5%) |
Sales and Office Occupations
The most common Sales and Office occupations in Waxahachie are Office & Administration (2,599 | 12.2%), and Sales & Related (2,274 | 10.7%).

Sales and Office Occupations by Sex
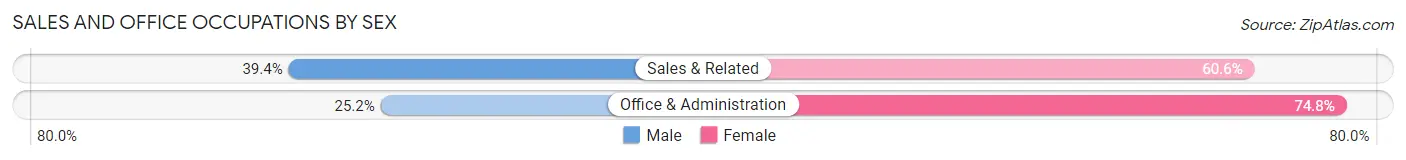
| Occupation | Male | Female |
| Sales & Related | 896 (39.4%) | 1,378 (60.6%) |
| Office & Administration | 656 (25.2%) | 1,943 (74.8%) |
| Total (Category) | 1,552 (31.9%) | 3,321 (68.1%) |
| Total (Overall) | 10,945 (51.5%) | 10,292 (48.5%) |
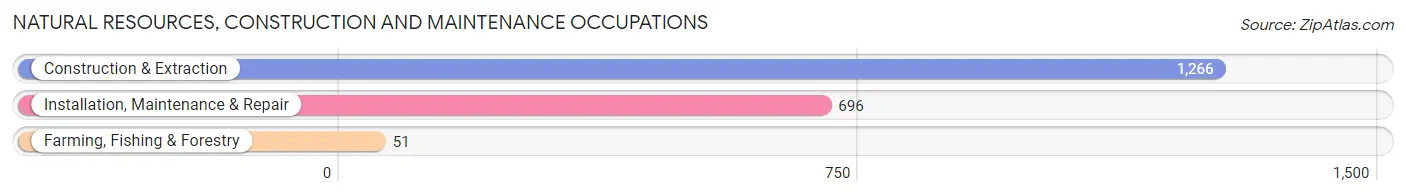
Natural Resources, Construction and Maintenance Occupations
The most common Natural Resources, Construction and Maintenance occupations in Waxahachie are Construction & Extraction (1,266 | 6.0%), Installation, Maintenance & Repair (696 | 3.3%), and Farming, Fishing & Forestry (51 | 0.2%).
Natural Resources, Construction and Maintenance Occupations by Sex
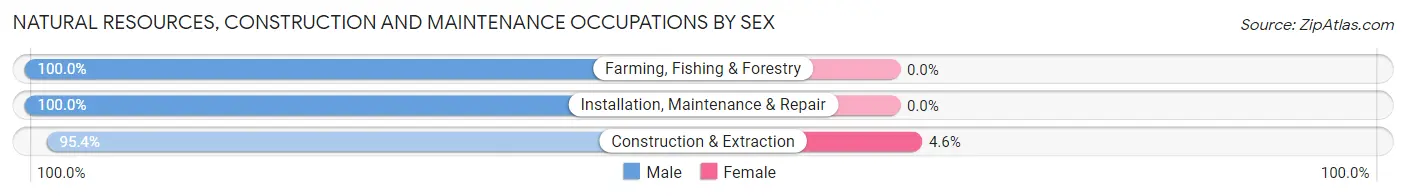
| Occupation | Male | Female |
| Farming, Fishing & Forestry | 51 (100.0%) | 0 (0.0%) |
| Construction & Extraction | 1,208 (95.4%) | 58 (4.6%) |
| Installation, Maintenance & Repair | 696 (100.0%) | 0 (0.0%) |
| Total (Category) | 1,955 (97.1%) | 58 (2.9%) |
| Total (Overall) | 10,945 (51.5%) | 10,292 (48.5%) |
Production, Transportation and Moving Occupations
The most common Production, Transportation and Moving occupations in Waxahachie are Production (1,211 | 5.7%), Material Moving (1,184 | 5.6%), and Transportation (967 | 4.5%).
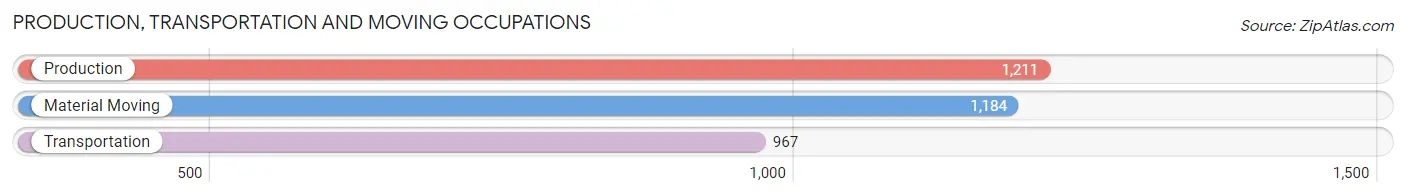
Production, Transportation and Moving Occupations by Sex
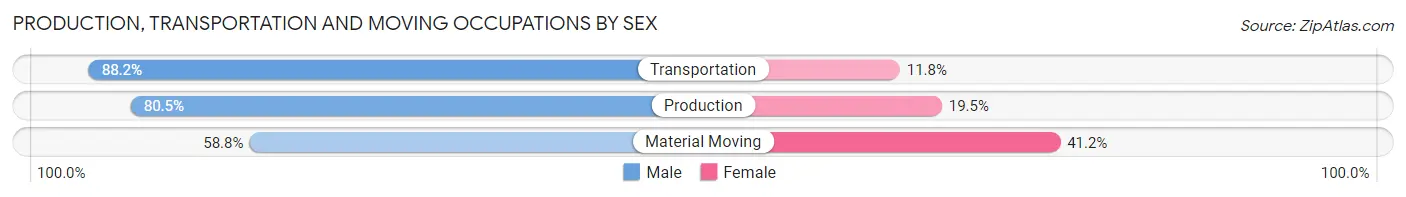
| Occupation | Male | Female |
| Production | 975 (80.5%) | 236 (19.5%) |
| Transportation | 853 (88.2%) | 114 (11.8%) |
| Material Moving | 696 (58.8%) | 488 (41.2%) |
| Total (Category) | 2,524 (75.1%) | 838 (24.9%) |
| Total (Overall) | 10,945 (51.5%) | 10,292 (48.5%) |
Employment Industries by Sex in Waxahachie
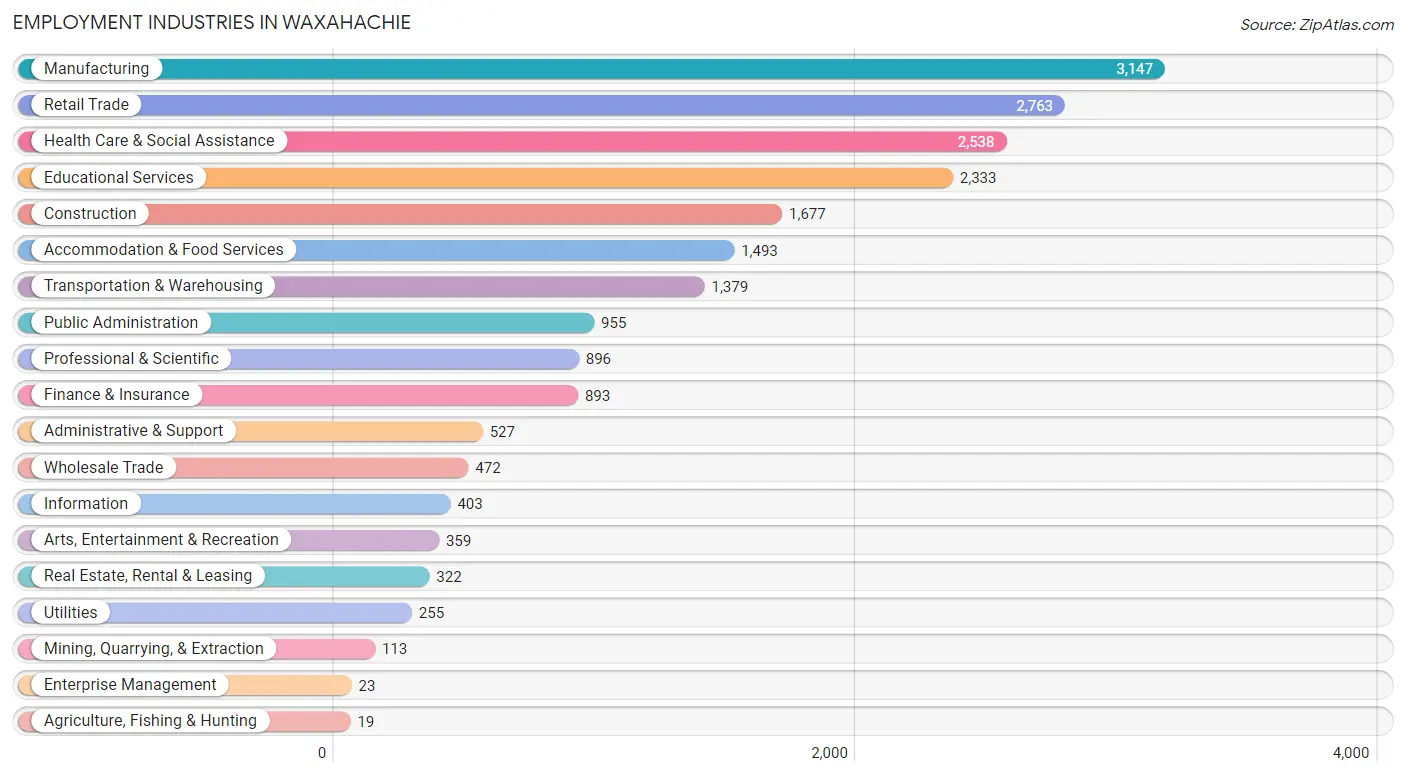
Employment Industries in Waxahachie
The major employment industries in Waxahachie include Manufacturing (3,147 | 14.8%), Retail Trade (2,763 | 13.0%), Health Care & Social Assistance (2,538 | 11.9%), Educational Services (2,333 | 11.0%), and Construction (1,677 | 7.9%).
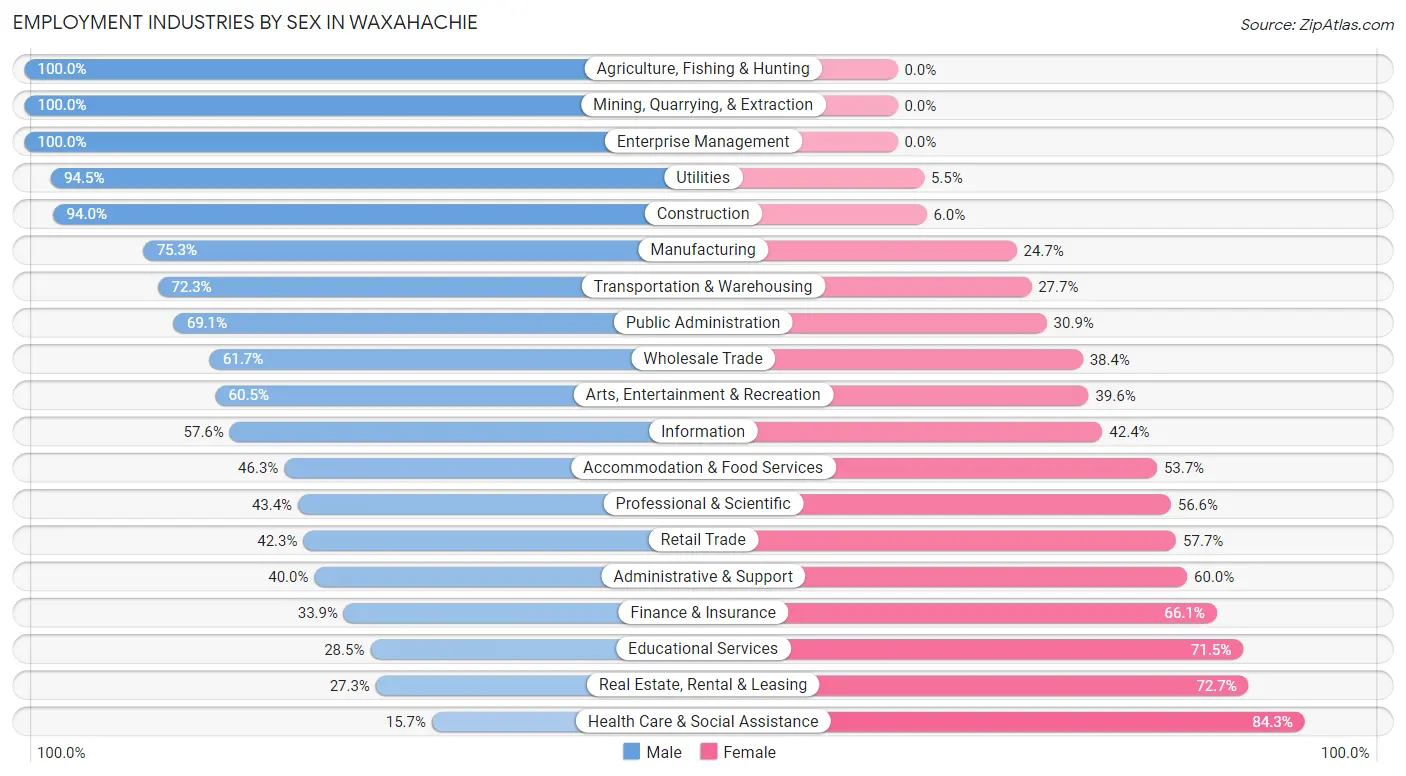
Employment Industries by Sex in Waxahachie
The Waxahachie industries that see more men than women are Agriculture, Fishing & Hunting (100.0%), Mining, Quarrying, & Extraction (100.0%), and Enterprise Management (100.0%), whereas the industries that tend to have a higher number of women are Health Care & Social Assistance (84.3%), Real Estate, Rental & Leasing (72.7%), and Educational Services (71.5%).
| Industry | Male | Female |
| Agriculture, Fishing & Hunting | 19 (100.0%) | 0 (0.0%) |
| Mining, Quarrying, & Extraction | 113 (100.0%) | 0 (0.0%) |
| Construction | 1,576 (94.0%) | 101 (6.0%) |
| Manufacturing | 2,371 (75.3%) | 776 (24.7%) |
| Wholesale Trade | 291 (61.7%) | 181 (38.4%) |
| Retail Trade | 1,169 (42.3%) | 1,594 (57.7%) |
| Transportation & Warehousing | 997 (72.3%) | 382 (27.7%) |
| Utilities | 241 (94.5%) | 14 (5.5%) |
| Information | 232 (57.6%) | 171 (42.4%) |
| Finance & Insurance | 303 (33.9%) | 590 (66.1%) |
| Real Estate, Rental & Leasing | 88 (27.3%) | 234 (72.7%) |
| Professional & Scientific | 389 (43.4%) | 507 (56.6%) |
| Enterprise Management | 23 (100.0%) | 0 (0.0%) |
| Administrative & Support | 211 (40.0%) | 316 (60.0%) |
| Educational Services | 664 (28.5%) | 1,669 (71.5%) |
| Health Care & Social Assistance | 399 (15.7%) | 2,139 (84.3%) |
| Arts, Entertainment & Recreation | 217 (60.5%) | 142 (39.6%) |
| Accommodation & Food Services | 691 (46.3%) | 802 (53.7%) |
| Public Administration | 660 (69.1%) | 295 (30.9%) |
| Total | 10,945 (51.5%) | 10,292 (48.5%) |
Education in Waxahachie
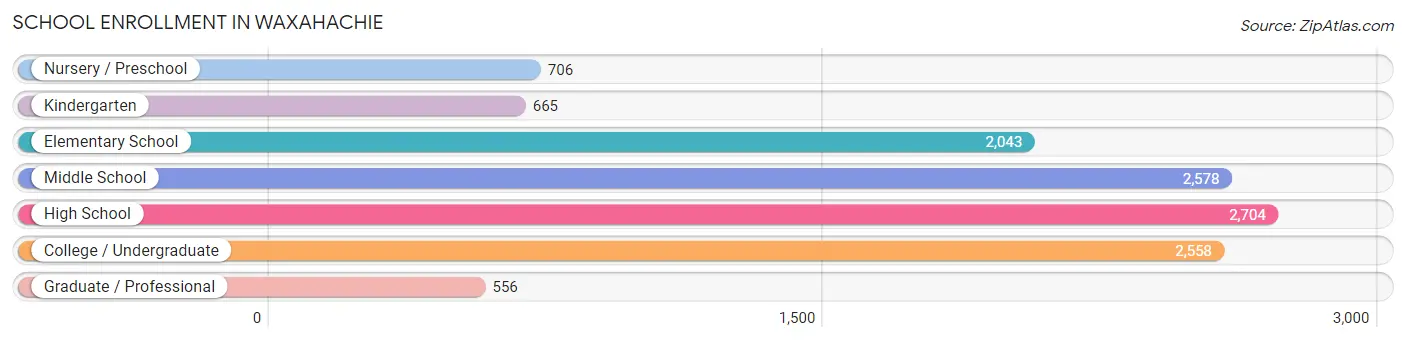
School Enrollment in Waxahachie
The most common levels of schooling among the 11,810 students in Waxahachie are high school (2,704 | 22.9%), middle school (2,578 | 21.8%), and college / undergraduate (2,558 | 21.7%).
| School Level | # Students | % Students |
| Nursery / Preschool | 706 | 6.0% |
| Kindergarten | 665 | 5.6% |
| Elementary School | 2,043 | 17.3% |
| Middle School | 2,578 | 21.8% |
| High School | 2,704 | 22.9% |
| College / Undergraduate | 2,558 | 21.7% |
| Graduate / Professional | 556 | 4.7% |
| Total | 11,810 | 100.0% |
School Enrollment by Age by Funding Source in Waxahachie
Out of a total of 11,810 students who are enrolled in schools in Waxahachie, 1,996 (16.9%) attend a private institution, while the remaining 9,814 (83.1%) are enrolled in public schools. The age group of 20 to 24 year olds has the highest likelihood of being enrolled in private schools, with 539 (53.6% in the age bracket) enrolled. Conversely, the age group of 10 to 14 year olds has the lowest likelihood of being enrolled in a private school, with 2,893 (96.4% in the age bracket) attending a public institution.
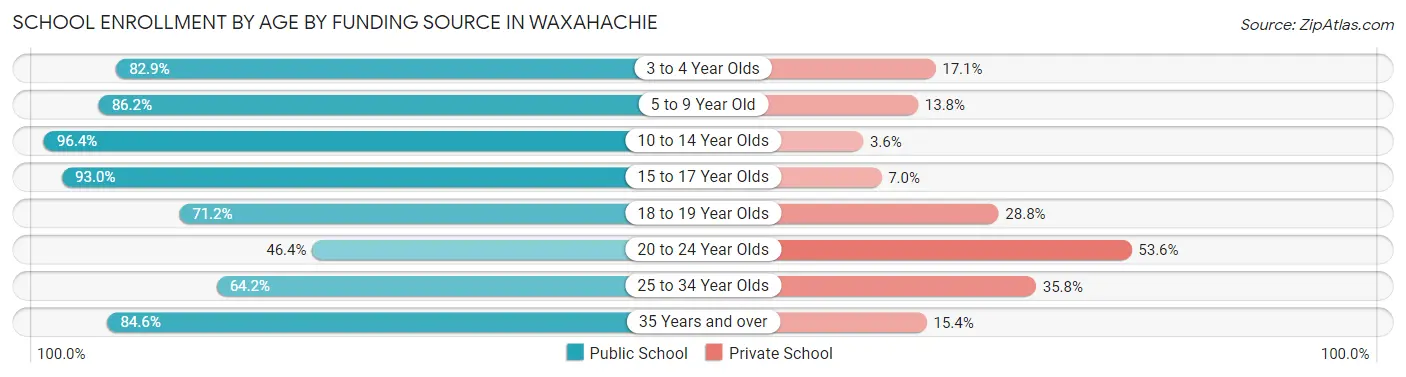
| Age Bracket | Public School | Private School |
| 3 to 4 Year Olds | 408 (82.9%) | 84 (17.1%) |
| 5 to 9 Year Old | 2,238 (86.2%) | 359 (13.8%) |
| 10 to 14 Year Olds | 2,893 (96.4%) | 108 (3.6%) |
| 15 to 17 Year Olds | 1,955 (93.0%) | 147 (7.0%) |
| 18 to 19 Year Olds | 662 (71.2%) | 268 (28.8%) |
| 20 to 24 Year Olds | 467 (46.4%) | 539 (53.6%) |
| 25 to 34 Year Olds | 714 (64.2%) | 398 (35.8%) |
| 35 Years and over | 482 (84.6%) | 88 (15.4%) |
| Total | 9,814 (83.1%) | 1,996 (16.9%) |
Educational Attainment by Field of Study in Waxahachie
Business (1,762 | 23.1%), education (1,393 | 18.3%), liberal arts & history (814 | 10.7%), science & technology (542 | 7.1%), and social sciences (450 | 5.9%) are the most common fields of study among 7,624 individuals in Waxahachie who have obtained a bachelor's degree or higher.
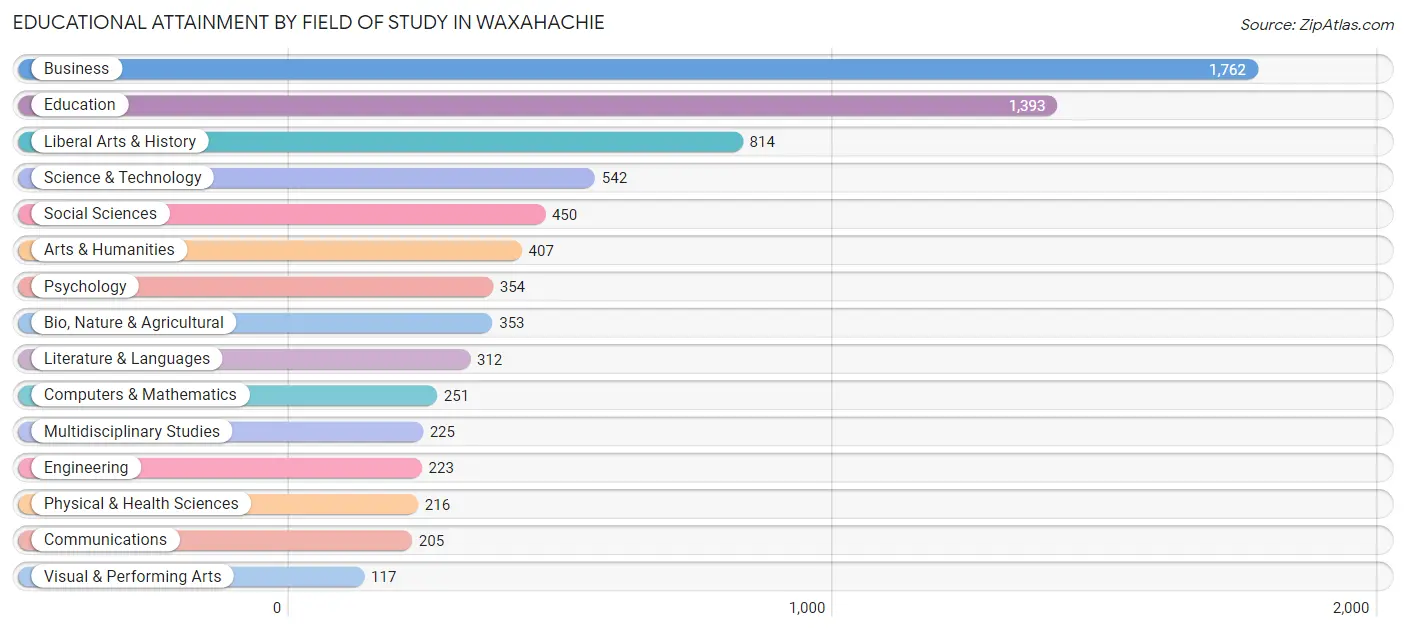
| Field of Study | # Graduates | % Graduates |
| Computers & Mathematics | 251 | 3.3% |
| Bio, Nature & Agricultural | 353 | 4.6% |
| Physical & Health Sciences | 216 | 2.8% |
| Psychology | 354 | 4.6% |
| Social Sciences | 450 | 5.9% |
| Engineering | 223 | 2.9% |
| Multidisciplinary Studies | 225 | 2.9% |
| Science & Technology | 542 | 7.1% |
| Business | 1,762 | 23.1% |
| Education | 1,393 | 18.3% |
| Literature & Languages | 312 | 4.1% |
| Liberal Arts & History | 814 | 10.7% |
| Visual & Performing Arts | 117 | 1.5% |
| Communications | 205 | 2.7% |
| Arts & Humanities | 407 | 5.3% |
| Total | 7,624 | 100.0% |
Transportation & Commute in Waxahachie
Vehicle Availability by Sex in Waxahachie
The most prevalent vehicle ownership categories in Waxahachie are males with 2 vehicles (5,716, accounting for 53.4%) and females with 2 vehicles (4,639, making up 57.4%).
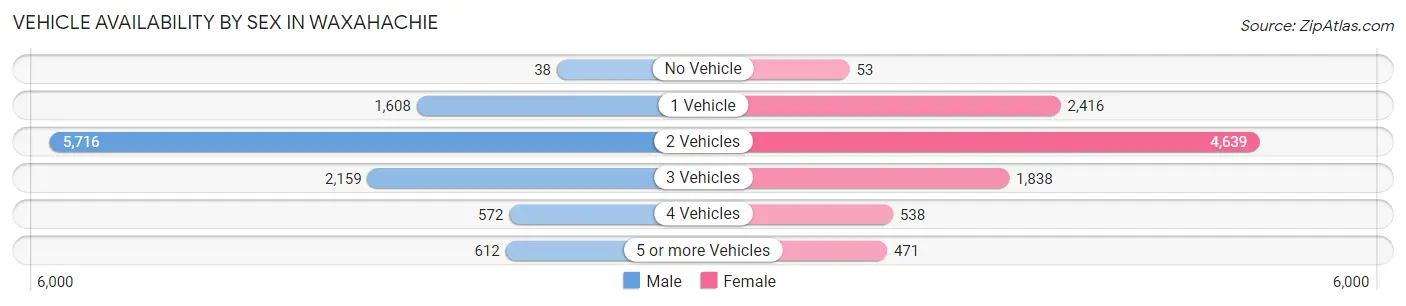
| Vehicles Available | Male | Female |
| No Vehicle | 38 (0.4%) | 53 (0.5%) |
| 1 Vehicle | 1,608 (15.0%) | 2,416 (24.3%) |
| 2 Vehicles | 5,716 (53.4%) | 4,639 (46.6%) |
| 3 Vehicles | 2,159 (20.2%) | 1,838 (18.5%) |
| 4 Vehicles | 572 (5.3%) | 538 (5.4%) |
| 5 or more Vehicles | 612 (5.7%) | 471 (4.7%) |
| Total | 10,705 (100.0%) | 9,955 (100.0%) |
Commute Time in Waxahachie
The most frequently occuring commute durations in Waxahachie are 10 to 14 minutes (2,979 commuters, 15.1%), 5 to 9 minutes (2,922 commuters, 14.8%), and 15 to 19 minutes (2,674 commuters, 13.6%).
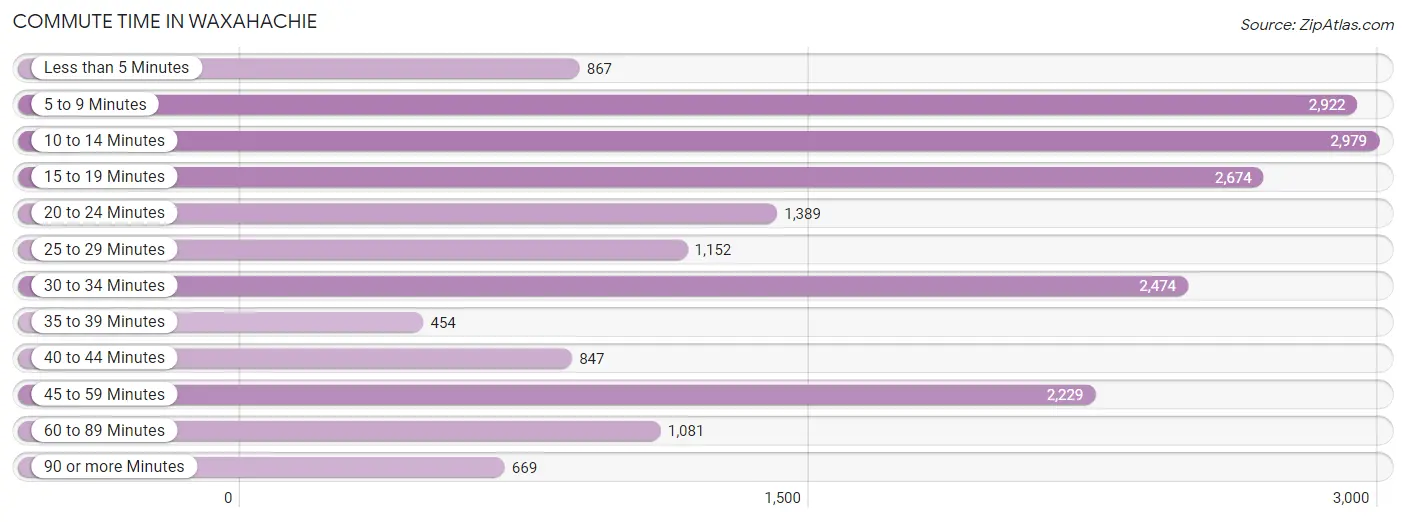
| Commute Time | # Commuters | % Commuters |
| Less than 5 Minutes | 867 | 4.4% |
| 5 to 9 Minutes | 2,922 | 14.8% |
| 10 to 14 Minutes | 2,979 | 15.1% |
| 15 to 19 Minutes | 2,674 | 13.6% |
| 20 to 24 Minutes | 1,389 | 7.0% |
| 25 to 29 Minutes | 1,152 | 5.8% |
| 30 to 34 Minutes | 2,474 | 12.5% |
| 35 to 39 Minutes | 454 | 2.3% |
| 40 to 44 Minutes | 847 | 4.3% |
| 45 to 59 Minutes | 2,229 | 11.3% |
| 60 to 89 Minutes | 1,081 | 5.5% |
| 90 or more Minutes | 669 | 3.4% |
Commute Time by Sex in Waxahachie
The most common commute times in Waxahachie are 10 to 14 minutes (1,534 commuters, 14.8%) for males and 5 to 9 minutes (1,541 commuters, 16.5%) for females.
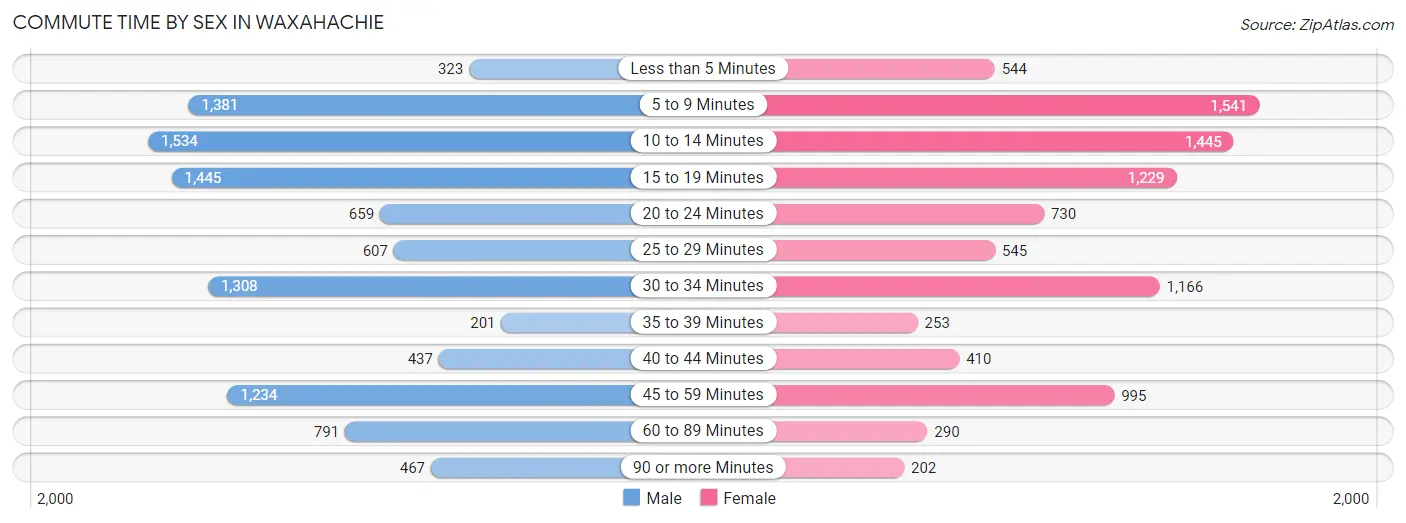
| Commute Time | Male | Female |
| Less than 5 Minutes | 323 (3.1%) | 544 (5.8%) |
| 5 to 9 Minutes | 1,381 (13.3%) | 1,541 (16.5%) |
| 10 to 14 Minutes | 1,534 (14.8%) | 1,445 (15.4%) |
| 15 to 19 Minutes | 1,445 (13.9%) | 1,229 (13.1%) |
| 20 to 24 Minutes | 659 (6.3%) | 730 (7.8%) |
| 25 to 29 Minutes | 607 (5.8%) | 545 (5.8%) |
| 30 to 34 Minutes | 1,308 (12.6%) | 1,166 (12.5%) |
| 35 to 39 Minutes | 201 (1.9%) | 253 (2.7%) |
| 40 to 44 Minutes | 437 (4.2%) | 410 (4.4%) |
| 45 to 59 Minutes | 1,234 (11.9%) | 995 (10.6%) |
| 60 to 89 Minutes | 791 (7.6%) | 290 (3.1%) |
| 90 or more Minutes | 467 (4.5%) | 202 (2.2%) |
Time of Departure to Work by Sex in Waxahachie
The most frequent times of departure to work in Waxahachie are 7:00 AM to 7:29 AM (1,865, 18.0%) for males and 7:30 AM to 7:59 AM (1,577, 16.9%) for females.
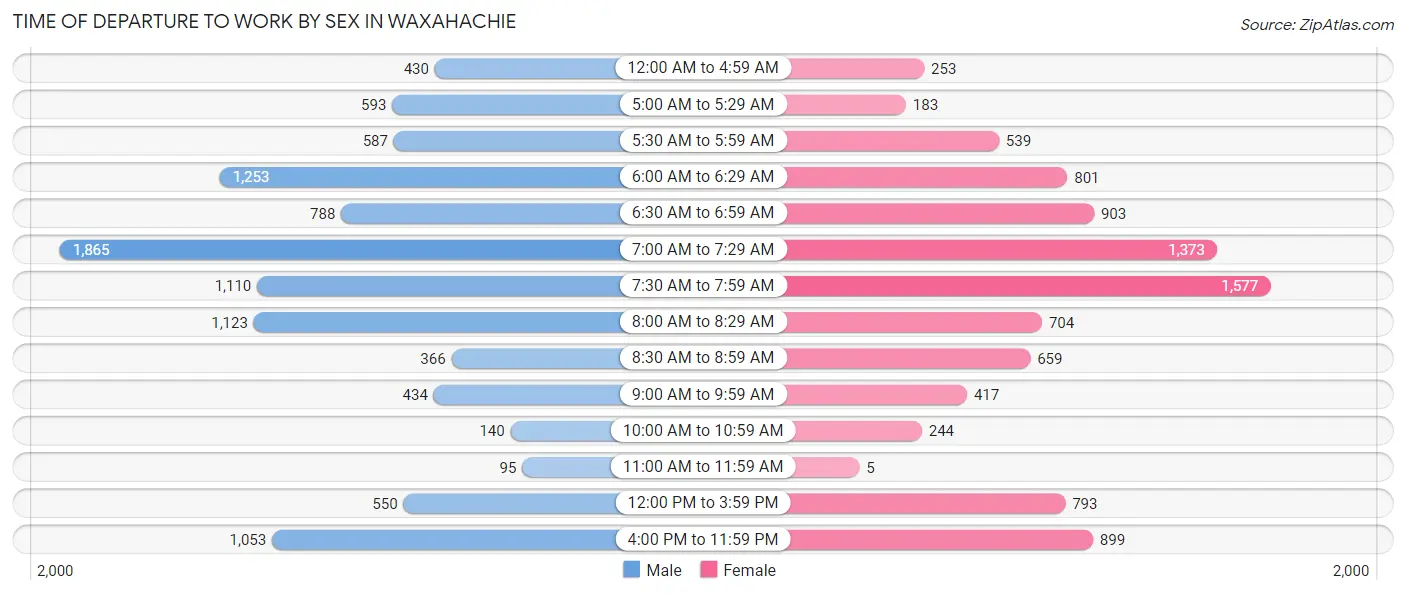
| Time of Departure | Male | Female |
| 12:00 AM to 4:59 AM | 430 (4.1%) | 253 (2.7%) |
| 5:00 AM to 5:29 AM | 593 (5.7%) | 183 (2.0%) |
| 5:30 AM to 5:59 AM | 587 (5.7%) | 539 (5.8%) |
| 6:00 AM to 6:29 AM | 1,253 (12.1%) | 801 (8.6%) |
| 6:30 AM to 6:59 AM | 788 (7.6%) | 903 (9.7%) |
| 7:00 AM to 7:29 AM | 1,865 (18.0%) | 1,373 (14.7%) |
| 7:30 AM to 7:59 AM | 1,110 (10.7%) | 1,577 (16.9%) |
| 8:00 AM to 8:29 AM | 1,123 (10.8%) | 704 (7.5%) |
| 8:30 AM to 8:59 AM | 366 (3.5%) | 659 (7.0%) |
| 9:00 AM to 9:59 AM | 434 (4.2%) | 417 (4.5%) |
| 10:00 AM to 10:59 AM | 140 (1.3%) | 244 (2.6%) |
| 11:00 AM to 11:59 AM | 95 (0.9%) | 5 (0.1%) |
| 12:00 PM to 3:59 PM | 550 (5.3%) | 793 (8.5%) |
| 4:00 PM to 11:59 PM | 1,053 (10.1%) | 899 (9.6%) |
| Total | 10,387 (100.0%) | 9,350 (100.0%) |
Housing Occupancy in Waxahachie
Occupancy by Ownership in Waxahachie
Of the total 14,439 dwellings in Waxahachie, owner-occupied units account for 8,696 (60.2%), while renter-occupied units make up 5,743 (39.8%).
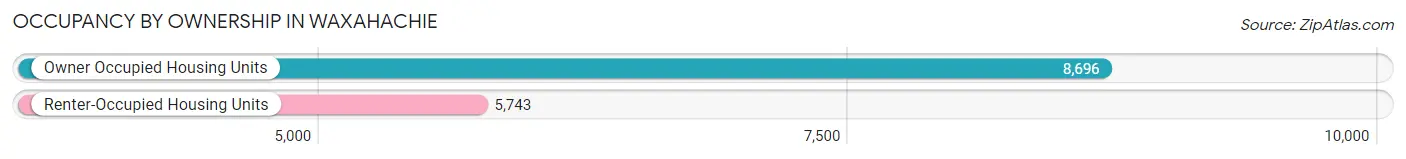
| Occupancy | # Housing Units | % Housing Units |
| Owner Occupied Housing Units | 8,696 | 60.2% |
| Renter-Occupied Housing Units | 5,743 | 39.8% |
| Total Occupied Housing Units | 14,439 | 100.0% |
Occupancy by Household Size in Waxahachie
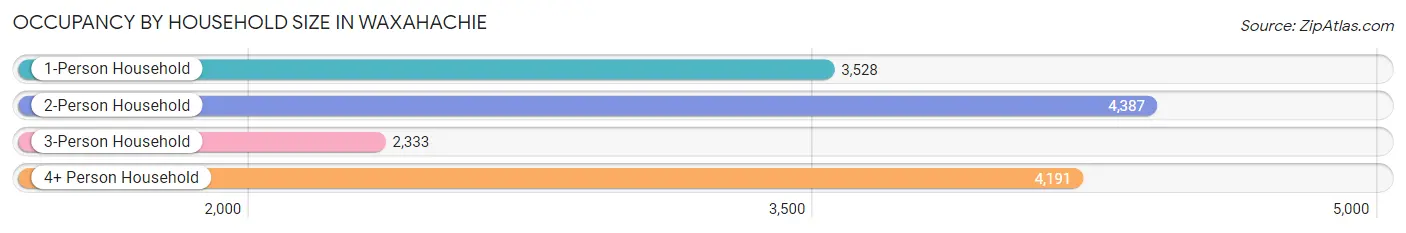
| Household Size | # Housing Units | % Housing Units |
| 1-Person Household | 3,528 | 24.4% |
| 2-Person Household | 4,387 | 30.4% |
| 3-Person Household | 2,333 | 16.2% |
| 4+ Person Household | 4,191 | 29.0% |
| Total Housing Units | 14,439 | 100.0% |
Occupancy by Ownership by Household Size in Waxahachie
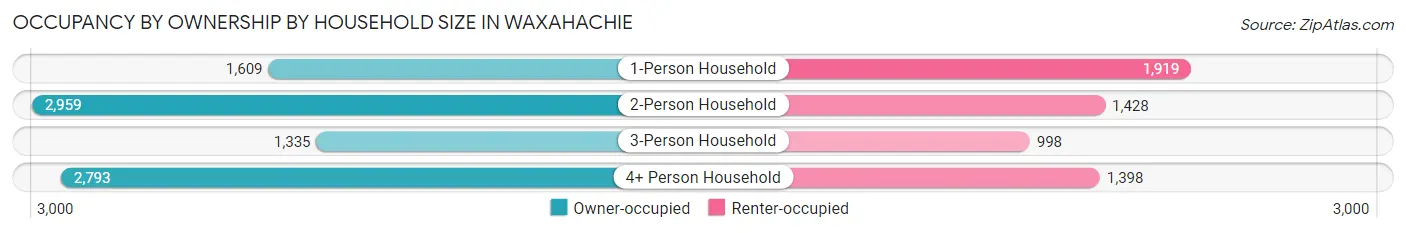
| Household Size | Owner-occupied | Renter-occupied |
| 1-Person Household | 1,609 (45.6%) | 1,919 (54.4%) |
| 2-Person Household | 2,959 (67.4%) | 1,428 (32.6%) |
| 3-Person Household | 1,335 (57.2%) | 998 (42.8%) |
| 4+ Person Household | 2,793 (66.6%) | 1,398 (33.4%) |
| Total Housing Units | 8,696 (60.2%) | 5,743 (39.8%) |
Occupancy by Educational Attainment in Waxahachie
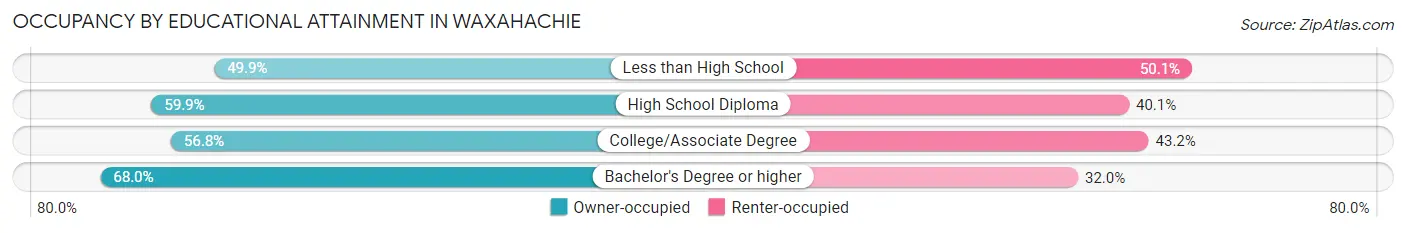
| Household Size | Owner-occupied | Renter-occupied |
| Less than High School | 659 (49.9%) | 661 (50.1%) |
| High School Diploma | 2,011 (59.9%) | 1,347 (40.1%) |
| College/Associate Degree | 3,094 (56.8%) | 2,354 (43.2%) |
| Bachelor's Degree or higher | 2,932 (68.0%) | 1,381 (32.0%) |
Occupancy by Age of Householder in Waxahachie
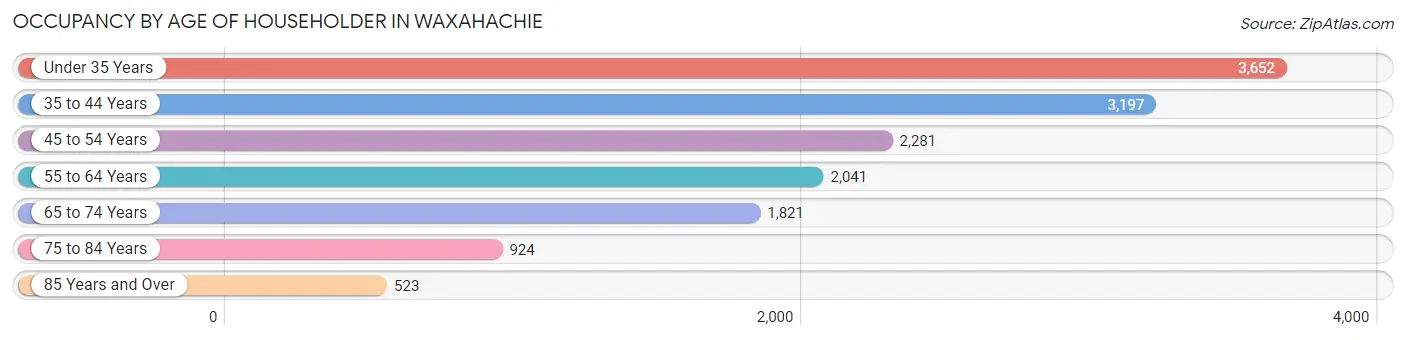
| Age Bracket | # Households | % Households |
| Under 35 Years | 3,652 | 25.3% |
| 35 to 44 Years | 3,197 | 22.1% |
| 45 to 54 Years | 2,281 | 15.8% |
| 55 to 64 Years | 2,041 | 14.1% |
| 65 to 74 Years | 1,821 | 12.6% |
| 75 to 84 Years | 924 | 6.4% |
| 85 Years and Over | 523 | 3.6% |
| Total | 14,439 | 100.0% |
Housing Finances in Waxahachie
Median Income by Occupancy in Waxahachie
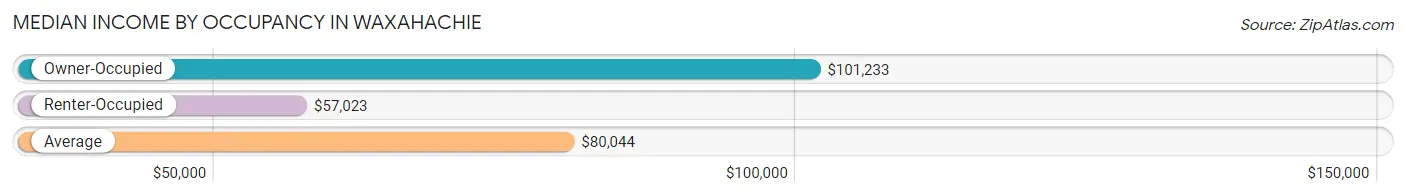
| Occupancy Type | # Households | Median Income |
| Owner-Occupied | 8,696 (60.2%) | $101,233 |
| Renter-Occupied | 5,743 (39.8%) | $57,023 |
| Average | 14,439 (100.0%) | $80,044 |
Occupancy by Householder Income Bracket in Waxahachie
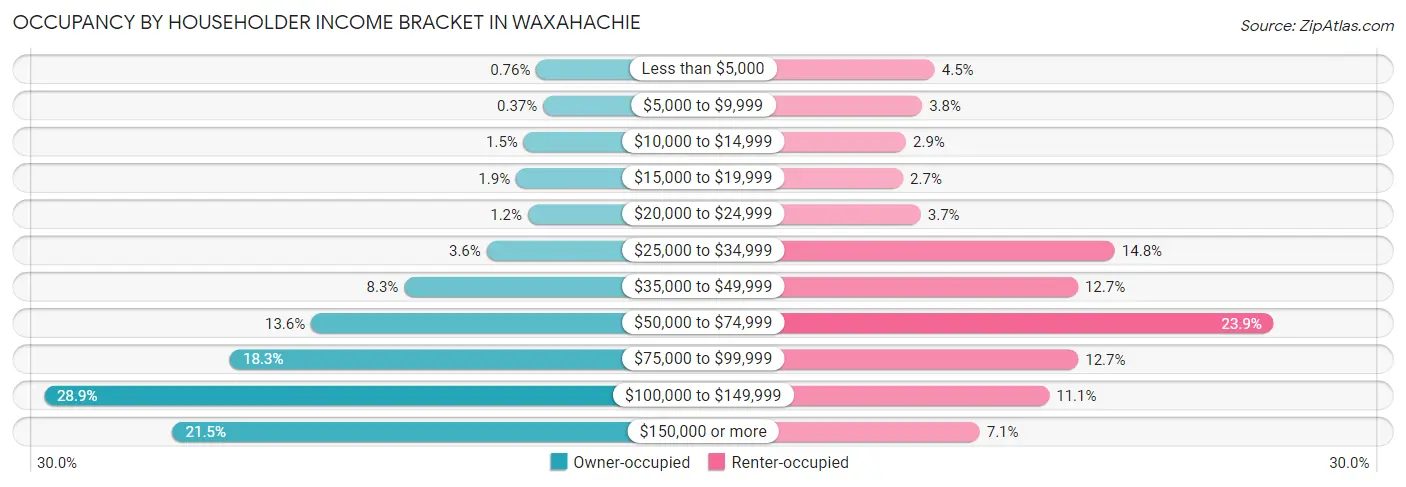
| Income Bracket | Owner-occupied | Renter-occupied |
| Less than $5,000 | 66 (0.8%) | 260 (4.5%) |
| $5,000 to $9,999 | 32 (0.4%) | 219 (3.8%) |
| $10,000 to $14,999 | 129 (1.5%) | 166 (2.9%) |
| $15,000 to $19,999 | 167 (1.9%) | 156 (2.7%) |
| $20,000 to $24,999 | 108 (1.2%) | 214 (3.7%) |
| $25,000 to $34,999 | 313 (3.6%) | 851 (14.8%) |
| $35,000 to $49,999 | 723 (8.3%) | 730 (12.7%) |
| $50,000 to $74,999 | 1,185 (13.6%) | 1,372 (23.9%) |
| $75,000 to $99,999 | 1,588 (18.3%) | 731 (12.7%) |
| $100,000 to $149,999 | 2,512 (28.9%) | 636 (11.1%) |
| $150,000 or more | 1,873 (21.5%) | 408 (7.1%) |
| Total | 8,696 (100.0%) | 5,743 (100.0%) |
Monthly Housing Cost Tiers in Waxahachie
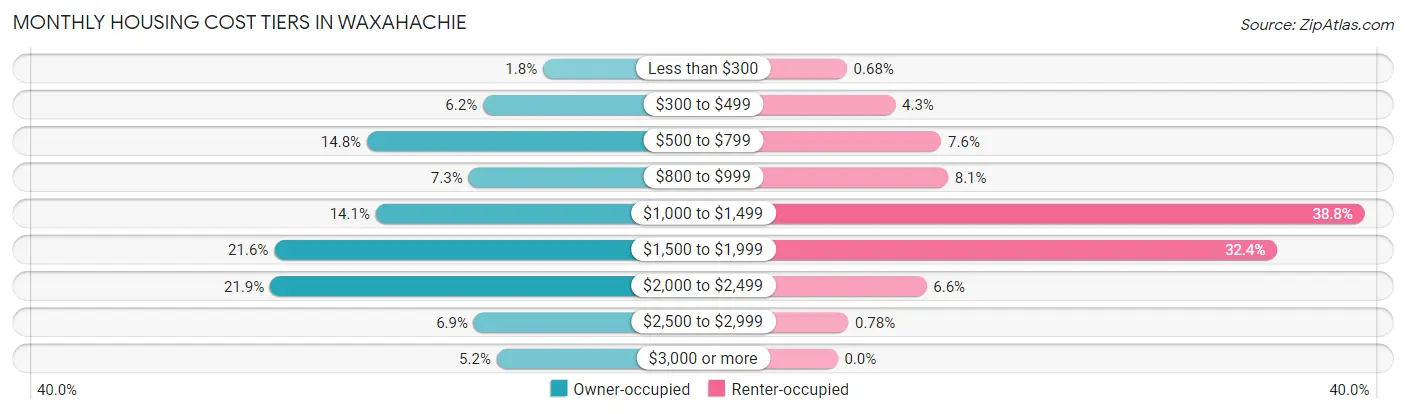
| Monthly Cost | Owner-occupied | Renter-occupied |
| Less than $300 | 158 (1.8%) | 39 (0.7%) |
| $300 to $499 | 543 (6.2%) | 244 (4.3%) |
| $500 to $799 | 1,286 (14.8%) | 439 (7.6%) |
| $800 to $999 | 636 (7.3%) | 467 (8.1%) |
| $1,000 to $1,499 | 1,230 (14.1%) | 2,230 (38.8%) |
| $1,500 to $1,999 | 1,880 (21.6%) | 1,860 (32.4%) |
| $2,000 to $2,499 | 1,906 (21.9%) | 376 (6.6%) |
| $2,500 to $2,999 | 602 (6.9%) | 45 (0.8%) |
| $3,000 or more | 455 (5.2%) | 0 (0.0%) |
| Total | 8,696 (100.0%) | 5,743 (100.0%) |
Physical Housing Characteristics in Waxahachie
Housing Structures in Waxahachie
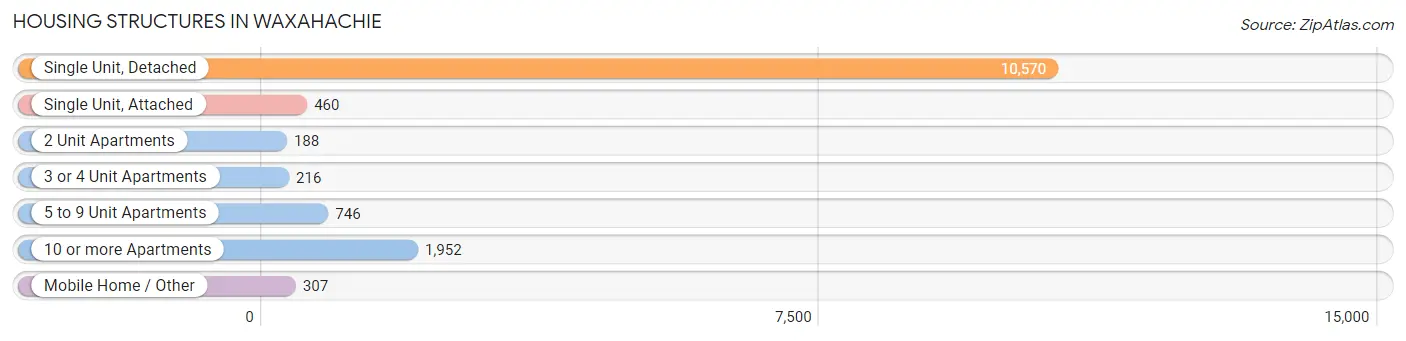
| Structure Type | # Housing Units | % Housing Units |
| Single Unit, Detached | 10,570 | 73.2% |
| Single Unit, Attached | 460 | 3.2% |
| 2 Unit Apartments | 188 | 1.3% |
| 3 or 4 Unit Apartments | 216 | 1.5% |
| 5 to 9 Unit Apartments | 746 | 5.2% |
| 10 or more Apartments | 1,952 | 13.5% |
| Mobile Home / Other | 307 | 2.1% |
| Total | 14,439 | 100.0% |
Housing Structures by Occupancy in Waxahachie
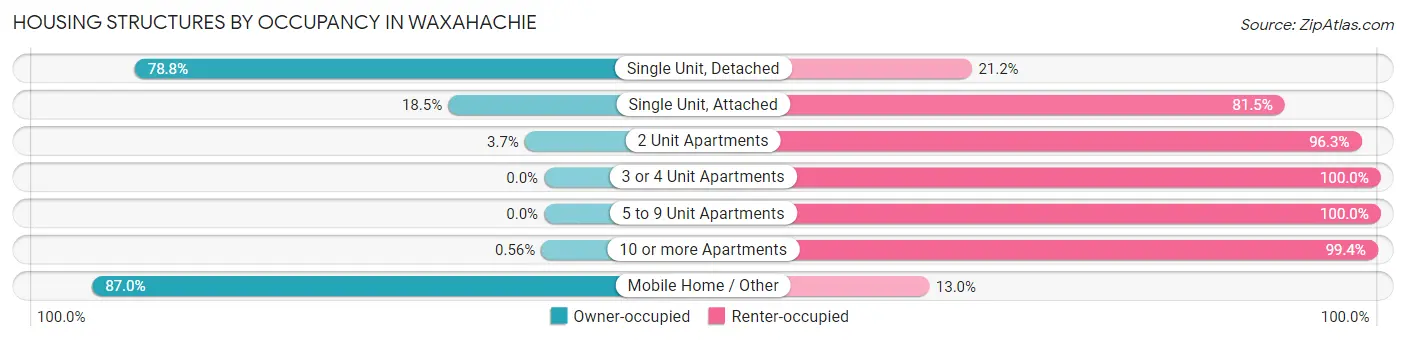
| Structure Type | Owner-occupied | Renter-occupied |
| Single Unit, Detached | 8,326 (78.8%) | 2,244 (21.2%) |
| Single Unit, Attached | 85 (18.5%) | 375 (81.5%) |
| 2 Unit Apartments | 7 (3.7%) | 181 (96.3%) |
| 3 or 4 Unit Apartments | 0 (0.0%) | 216 (100.0%) |
| 5 to 9 Unit Apartments | 0 (0.0%) | 746 (100.0%) |
| 10 or more Apartments | 11 (0.6%) | 1,941 (99.4%) |
| Mobile Home / Other | 267 (87.0%) | 40 (13.0%) |
| Total | 8,696 (60.2%) | 5,743 (39.8%) |
Housing Structures by Number of Rooms in Waxahachie
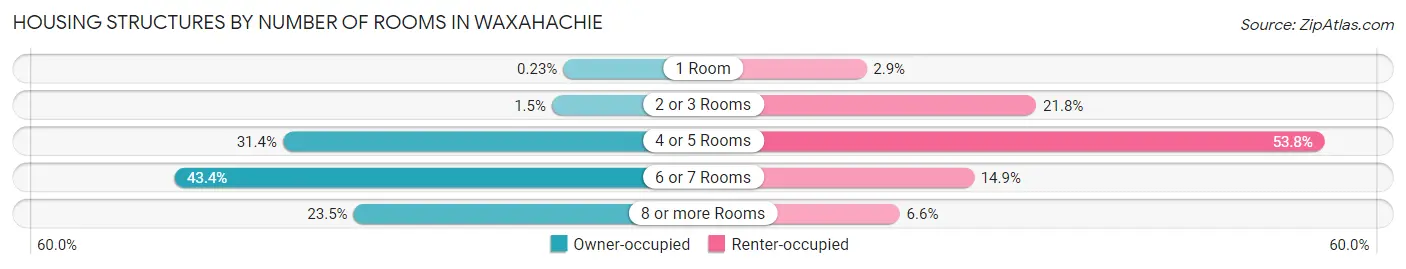
| Number of Rooms | Owner-occupied | Renter-occupied |
| 1 Room | 20 (0.2%) | 168 (2.9%) |
| 2 or 3 Rooms | 130 (1.5%) | 1,251 (21.8%) |
| 4 or 5 Rooms | 2,726 (31.4%) | 3,090 (53.8%) |
| 6 or 7 Rooms | 3,776 (43.4%) | 853 (14.8%) |
| 8 or more Rooms | 2,044 (23.5%) | 381 (6.6%) |
| Total | 8,696 (100.0%) | 5,743 (100.0%) |
Housing Structure by Heating Type in Waxahachie
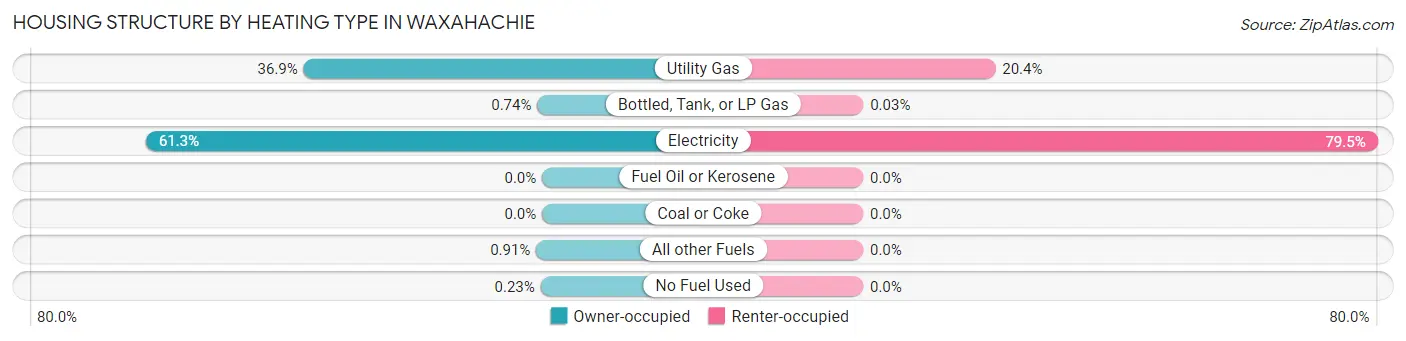
| Heating Type | Owner-occupied | Renter-occupied |
| Utility Gas | 3,206 (36.9%) | 1,174 (20.4%) |
| Bottled, Tank, or LP Gas | 64 (0.7%) | 2 (0.0%) |
| Electricity | 5,327 (61.3%) | 4,567 (79.5%) |
| Fuel Oil or Kerosene | 0 (0.0%) | 0 (0.0%) |
| Coal or Coke | 0 (0.0%) | 0 (0.0%) |
| All other Fuels | 79 (0.9%) | 0 (0.0%) |
| No Fuel Used | 20 (0.2%) | 0 (0.0%) |
| Total | 8,696 (100.0%) | 5,743 (100.0%) |
Household Vehicle Usage in Waxahachie
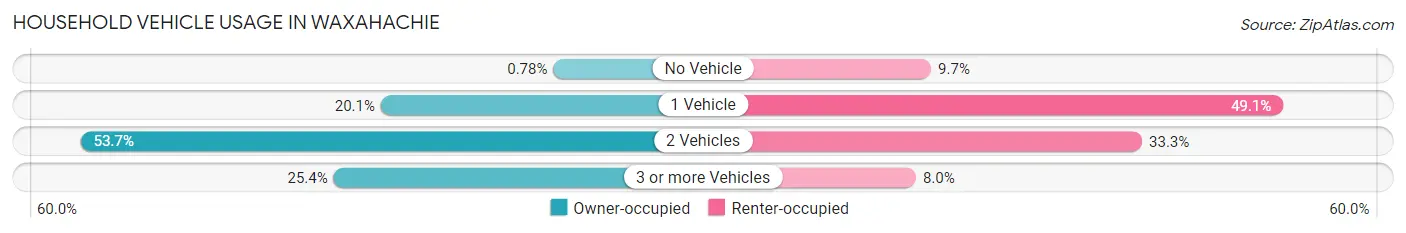
| Vehicles per Household | Owner-occupied | Renter-occupied |
| No Vehicle | 68 (0.8%) | 555 (9.7%) |
| 1 Vehicle | 1,748 (20.1%) | 2,819 (49.1%) |
| 2 Vehicles | 4,672 (53.7%) | 1,912 (33.3%) |
| 3 or more Vehicles | 2,208 (25.4%) | 457 (8.0%) |
| Total | 8,696 (100.0%) | 5,743 (100.0%) |
Real Estate & Mortgages in Waxahachie
Real Estate and Mortgage Overview in Waxahachie
| Characteristic | Without Mortgage | With Mortgage |
| Housing Units | 2,706 | 5,990 |
| Median Property Value | $220,100 | $290,700 |
| Median Household Income | $78,383 | $1,553 |
| Monthly Housing Costs | $656 | $431 |
| Real Estate Taxes | $2,718 | $130 |
Property Value by Mortgage Status in Waxahachie
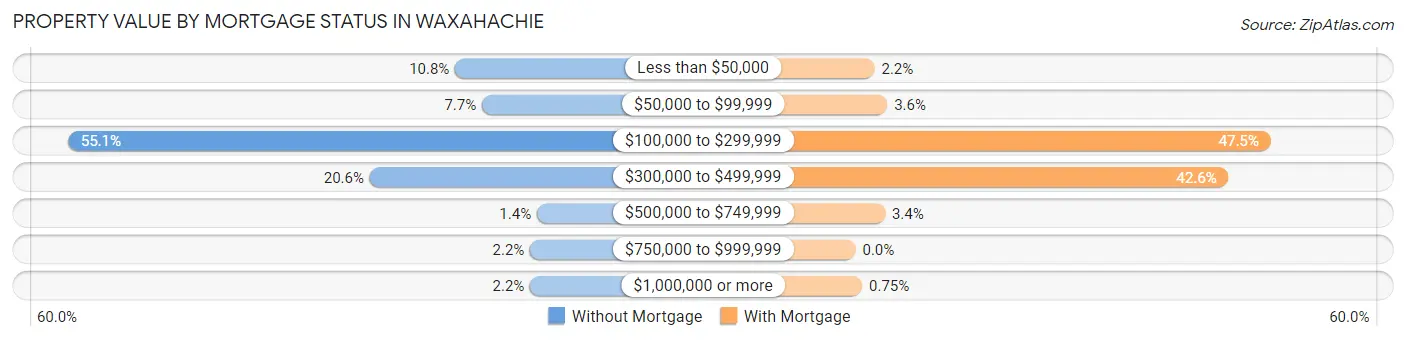
| Property Value | Without Mortgage | With Mortgage |
| Less than $50,000 | 292 (10.8%) | 130 (2.2%) |
| $50,000 to $99,999 | 209 (7.7%) | 217 (3.6%) |
| $100,000 to $299,999 | 1,490 (55.1%) | 2,843 (47.5%) |
| $300,000 to $499,999 | 556 (20.5%) | 2,554 (42.6%) |
| $500,000 to $749,999 | 39 (1.4%) | 201 (3.4%) |
| $750,000 to $999,999 | 60 (2.2%) | 0 (0.0%) |
| $1,000,000 or more | 60 (2.2%) | 45 (0.7%) |
| Total | 2,706 (100.0%) | 5,990 (100.0%) |
Household Income by Mortgage Status in Waxahachie
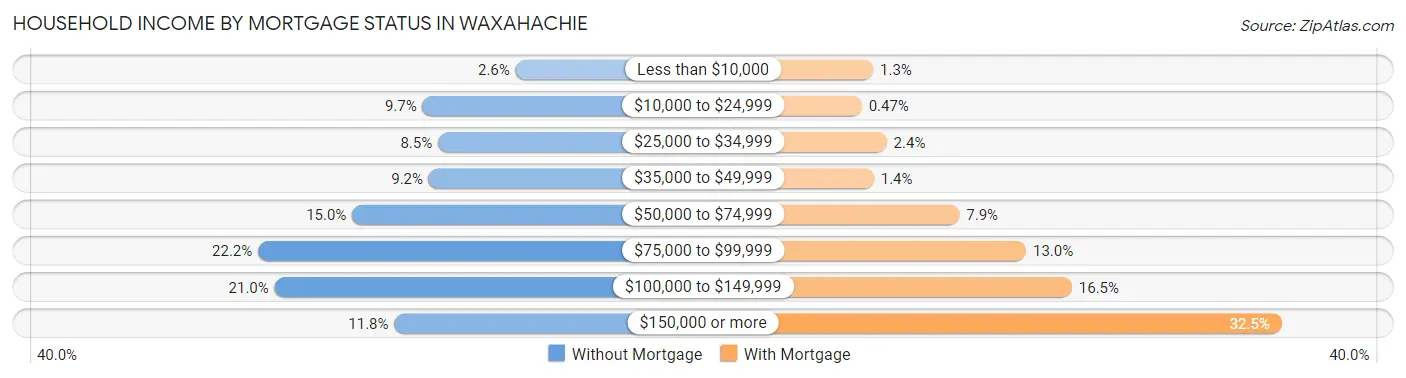
| Household Income | Without Mortgage | With Mortgage |
| Less than $10,000 | 70 (2.6%) | 80 (1.3%) |
| $10,000 to $24,999 | 262 (9.7%) | 28 (0.5%) |
| $25,000 to $34,999 | 230 (8.5%) | 142 (2.4%) |
| $35,000 to $49,999 | 249 (9.2%) | 83 (1.4%) |
| $50,000 to $74,999 | 407 (15.0%) | 474 (7.9%) |
| $75,000 to $99,999 | 601 (22.2%) | 778 (13.0%) |
| $100,000 to $149,999 | 567 (20.9%) | 987 (16.5%) |
| $150,000 or more | 320 (11.8%) | 1,945 (32.5%) |
| Total | 2,706 (100.0%) | 5,990 (100.0%) |
Property Value to Household Income Ratio in Waxahachie
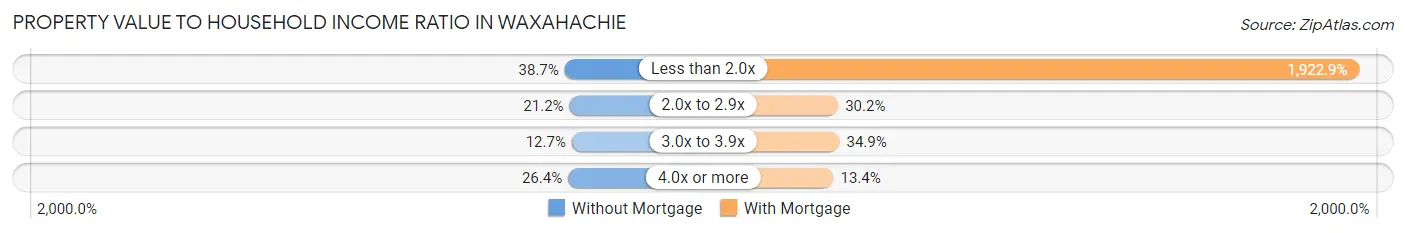
| Value-to-Income Ratio | Without Mortgage | With Mortgage |
| Less than 2.0x | 1,046 (38.7%) | 115,184 (1,922.9%) |
| 2.0x to 2.9x | 573 (21.2%) | 1,810 (30.2%) |
| 3.0x to 3.9x | 343 (12.7%) | 2,093 (34.9%) |
| 4.0x or more | 714 (26.4%) | 800 (13.4%) |
| Total | 2,706 (100.0%) | 5,990 (100.0%) |
Real Estate Taxes by Mortgage Status in Waxahachie
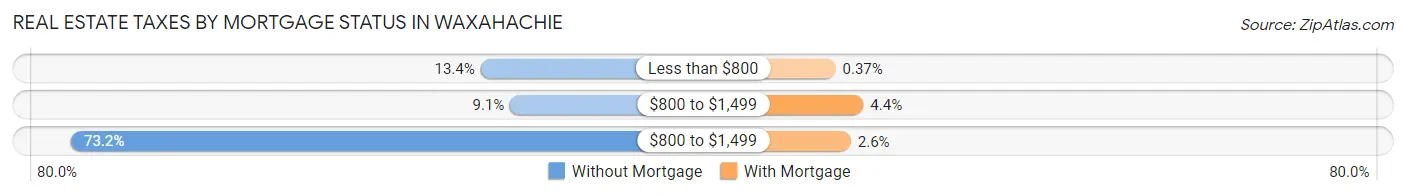
| Property Taxes | Without Mortgage | With Mortgage |
| Less than $800 | 362 (13.4%) | 22 (0.4%) |
| $800 to $1,499 | 245 (9.0%) | 266 (4.4%) |
| $800 to $1,499 | 1,981 (73.2%) | 156 (2.6%) |
| Total | 2,706 (100.0%) | 5,990 (100.0%) |
Health & Disability in Waxahachie
Health Insurance Coverage by Age in Waxahachie
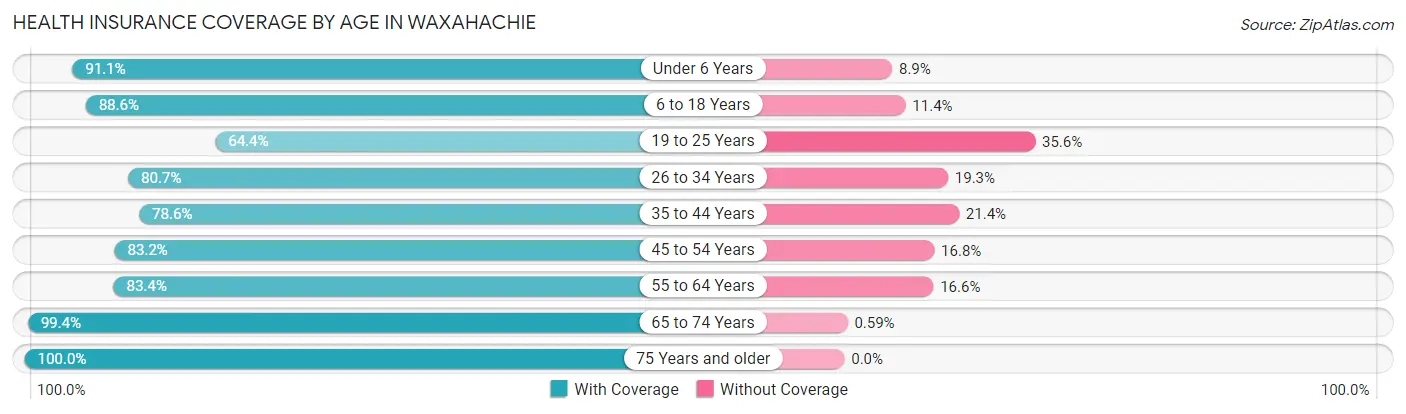
| Age Bracket | With Coverage | Without Coverage |
| Under 6 Years | 3,480 (91.1%) | 340 (8.9%) |
| 6 to 18 Years | 6,927 (88.6%) | 891 (11.4%) |
| 19 to 25 Years | 2,896 (64.4%) | 1,599 (35.6%) |
| 26 to 34 Years | 5,090 (80.7%) | 1,218 (19.3%) |
| 35 to 44 Years | 4,247 (78.6%) | 1,154 (21.4%) |
| 45 to 54 Years | 3,511 (83.2%) | 707 (16.8%) |
| 55 to 64 Years | 3,128 (83.4%) | 622 (16.6%) |
| 65 to 74 Years | 3,204 (99.4%) | 19 (0.6%) |
| 75 Years and older | 1,994 (100.0%) | 0 (0.0%) |
| Total | 34,477 (84.0%) | 6,550 (16.0%) |
Health Insurance Coverage by Citizenship Status in Waxahachie
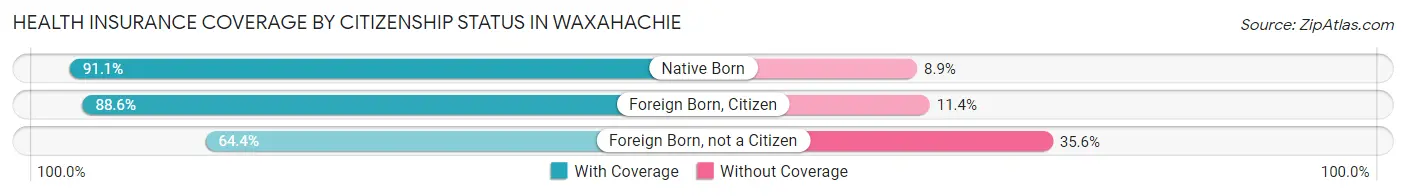
| Citizenship Status | With Coverage | Without Coverage |
| Native Born | 3,480 (91.1%) | 340 (8.9%) |
| Foreign Born, Citizen | 6,927 (88.6%) | 891 (11.4%) |
| Foreign Born, not a Citizen | 2,896 (64.4%) | 1,599 (35.6%) |
Health Insurance Coverage by Household Income in Waxahachie
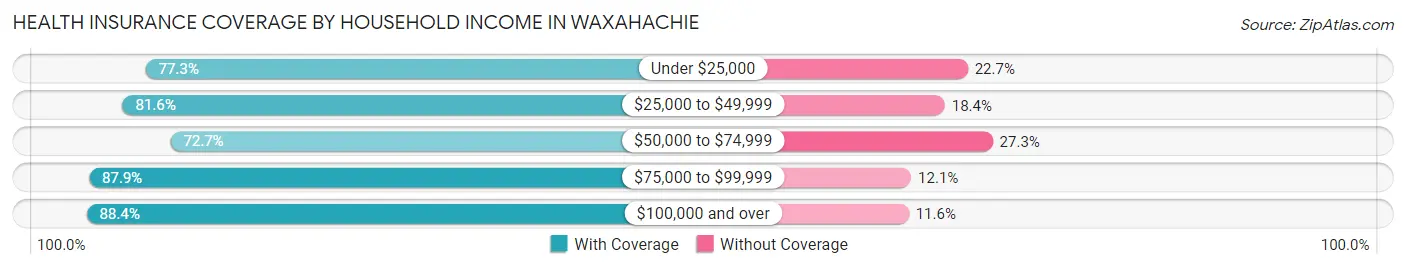
| Household Income | With Coverage | Without Coverage |
| Under $25,000 | 2,027 (77.3%) | 594 (22.7%) |
| $25,000 to $49,999 | 5,372 (81.6%) | 1,208 (18.4%) |
| $50,000 to $74,999 | 4,532 (72.7%) | 1,704 (27.3%) |
| $75,000 to $99,999 | 6,126 (87.9%) | 840 (12.1%) |
| $100,000 and over | 15,944 (88.4%) | 2,093 (11.6%) |
Public vs Private Health Insurance Coverage by Age in Waxahachie
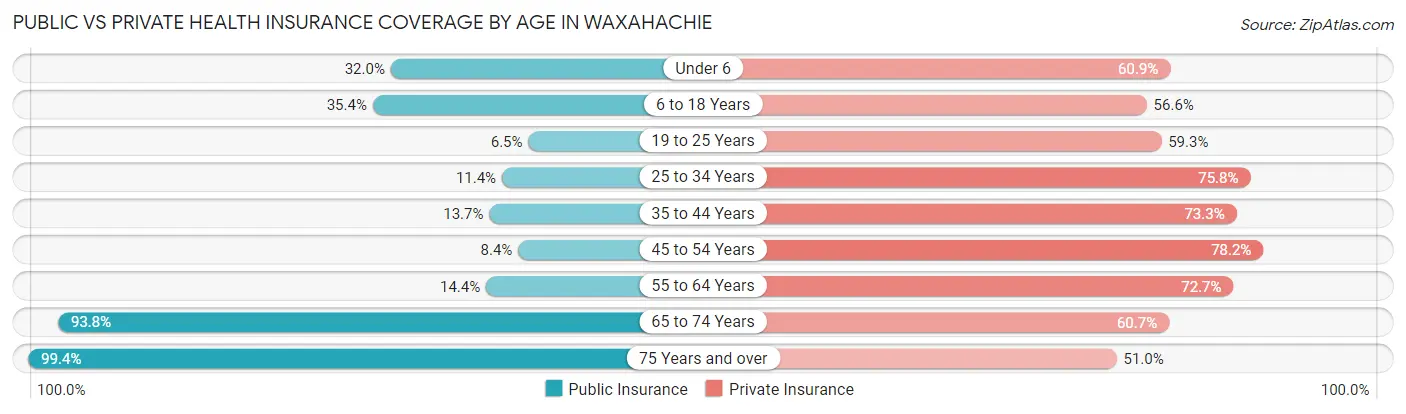
| Age Bracket | Public Insurance | Private Insurance |
| Under 6 | 1,224 (32.0%) | 2,328 (60.9%) |
| 6 to 18 Years | 2,766 (35.4%) | 4,424 (56.6%) |
| 19 to 25 Years | 292 (6.5%) | 2,665 (59.3%) |
| 25 to 34 Years | 719 (11.4%) | 4,783 (75.8%) |
| 35 to 44 Years | 742 (13.7%) | 3,956 (73.3%) |
| 45 to 54 Years | 354 (8.4%) | 3,299 (78.2%) |
| 55 to 64 Years | 538 (14.3%) | 2,725 (72.7%) |
| 65 to 74 Years | 3,024 (93.8%) | 1,957 (60.7%) |
| 75 Years and over | 1,981 (99.4%) | 1,017 (51.0%) |
| Total | 11,640 (28.4%) | 27,154 (66.2%) |
Disability Status by Sex by Age in Waxahachie
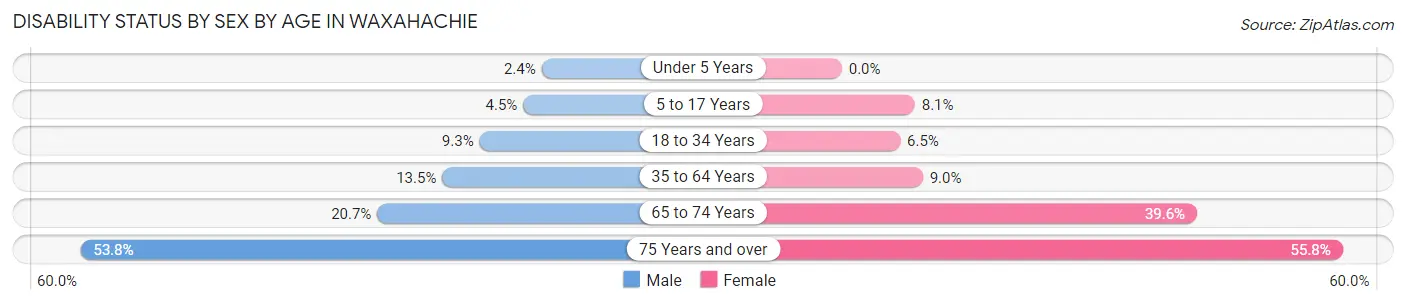
| Age Bracket | Male | Female |
| Under 5 Years | 43 (2.4%) | 0 (0.0%) |
| 5 to 17 Years | 149 (4.5%) | 363 (8.1%) |
| 18 to 34 Years | 544 (9.3%) | 363 (6.5%) |
| 35 to 64 Years | 876 (13.5%) | 619 (9.0%) |
| 65 to 74 Years | 317 (20.7%) | 670 (39.6%) |
| 75 Years and over | 383 (53.8%) | 715 (55.8%) |
Disability Class by Sex by Age in Waxahachie
Disability Class: Hearing Difficulty
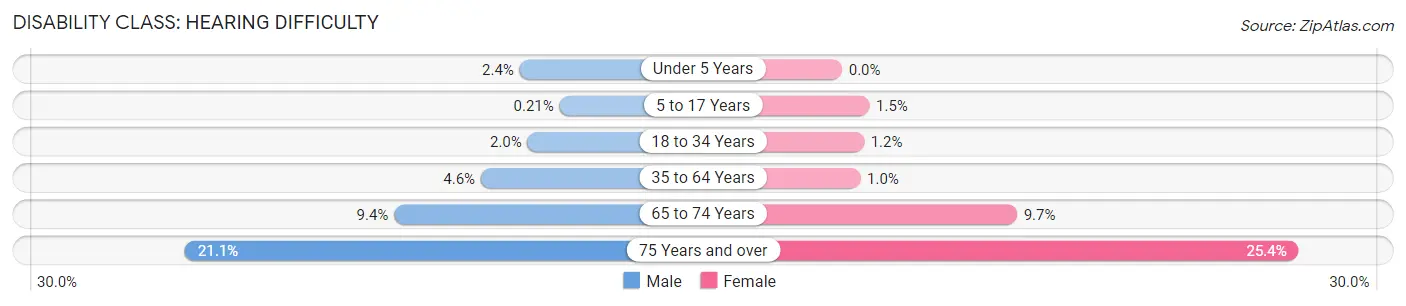
| Age Bracket | Male | Female |
| Under 5 Years | 43 (2.4%) | 0 (0.0%) |
| 5 to 17 Years | 7 (0.2%) | 68 (1.5%) |
| 18 to 34 Years | 116 (2.0%) | 68 (1.2%) |
| 35 to 64 Years | 298 (4.6%) | 70 (1.0%) |
| 65 to 74 Years | 144 (9.4%) | 165 (9.7%) |
| 75 Years and over | 150 (21.1%) | 326 (25.4%) |
Disability Class: Vision Difficulty
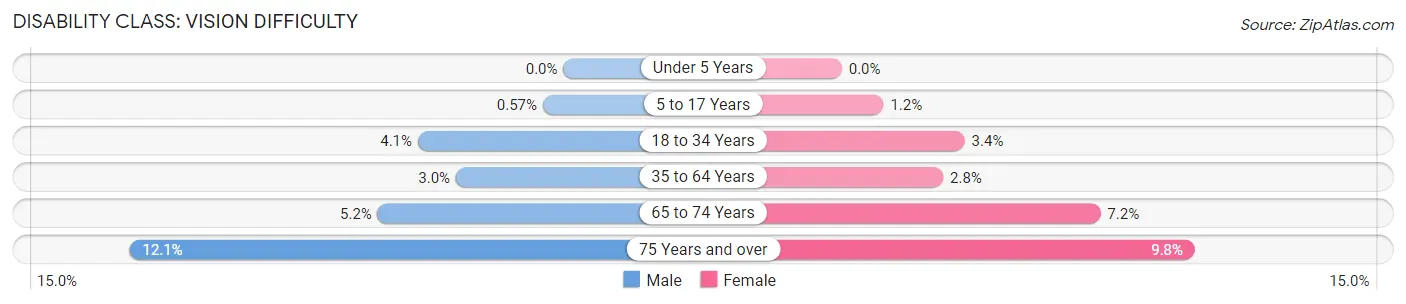
| Age Bracket | Male | Female |
| Under 5 Years | 0 (0.0%) | 0 (0.0%) |
| 5 to 17 Years | 19 (0.6%) | 52 (1.2%) |
| 18 to 34 Years | 236 (4.1%) | 191 (3.4%) |
| 35 to 64 Years | 194 (3.0%) | 194 (2.8%) |
| 65 to 74 Years | 79 (5.2%) | 122 (7.2%) |
| 75 Years and over | 86 (12.1%) | 126 (9.8%) |
Disability Class: Cognitive Difficulty
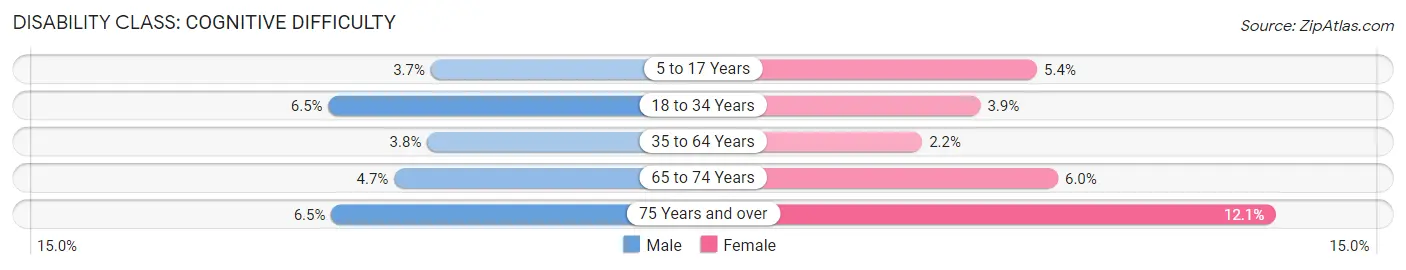
| Age Bracket | Male | Female |
| 5 to 17 Years | 123 (3.7%) | 243 (5.4%) |
| 18 to 34 Years | 381 (6.5%) | 216 (3.9%) |
| 35 to 64 Years | 246 (3.8%) | 154 (2.2%) |
| 65 to 74 Years | 72 (4.7%) | 102 (6.0%) |
| 75 Years and over | 46 (6.5%) | 155 (12.1%) |
Disability Class: Ambulatory Difficulty
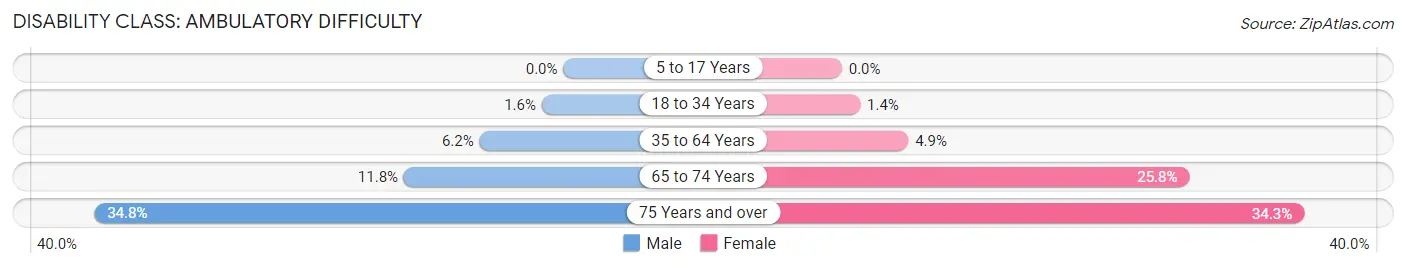
| Age Bracket | Male | Female |
| 5 to 17 Years | 0 (0.0%) | 0 (0.0%) |
| 18 to 34 Years | 93 (1.6%) | 76 (1.4%) |
| 35 to 64 Years | 404 (6.2%) | 339 (4.9%) |
| 65 to 74 Years | 181 (11.8%) | 437 (25.8%) |
| 75 Years and over | 248 (34.8%) | 440 (34.3%) |
Disability Class: Self-Care Difficulty
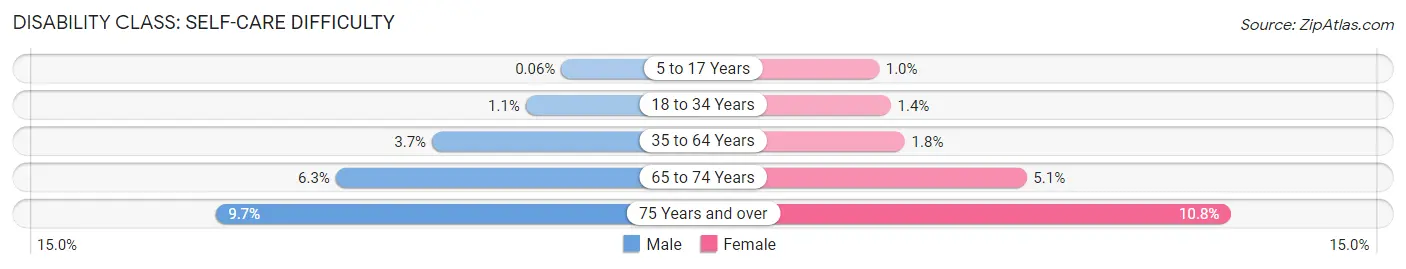
| Age Bracket | Male | Female |
| 5 to 17 Years | 2 (0.1%) | 46 (1.0%) |
| 18 to 34 Years | 61 (1.1%) | 76 (1.4%) |
| 35 to 64 Years | 238 (3.7%) | 120 (1.8%) |
| 65 to 74 Years | 97 (6.3%) | 87 (5.1%) |
| 75 Years and over | 69 (9.7%) | 139 (10.8%) |
Technology Access in Waxahachie
Computing Device Access in Waxahachie
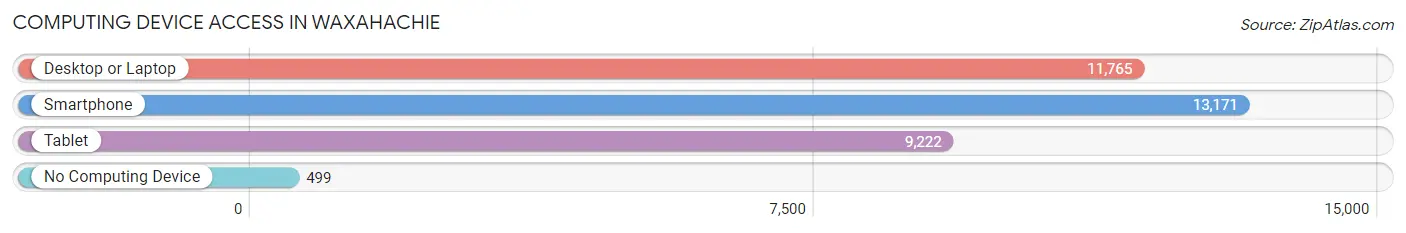
| Device Type | # Households | % Households |
| Desktop or Laptop | 11,765 | 81.5% |
| Smartphone | 13,171 | 91.2% |
| Tablet | 9,222 | 63.9% |
| No Computing Device | 499 | 3.5% |
| Total | 14,439 | 100.0% |
Internet Access in Waxahachie
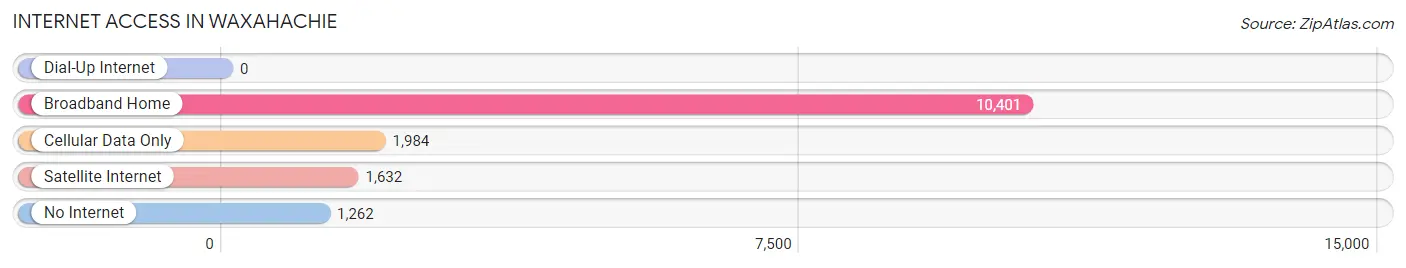
| Internet Type | # Households | % Households |
| Dial-Up Internet | 0 | 0.0% |
| Broadband Home | 10,401 | 72.0% |
| Cellular Data Only | 1,984 | 13.7% |
| Satellite Internet | 1,632 | 11.3% |
| No Internet | 1,262 | 8.7% |
| Total | 14,439 | 100.0% |
Waxahachie Summary
Waxahachie is a city located in Ellis County, Texas, United States. It is the county seat of Ellis County and is located just south of Dallas and Fort Worth. The population of Waxahachie was 30,621 at the 2010 census, making it the largest city in Ellis County.
History
The area that is now Waxahachie was first settled in the 1840s by settlers from the Peters Colony. The city was named after the Native American tribe of the same name, which had inhabited the area for centuries. The city was officially incorporated in 1850 and was named the county seat of Ellis County in 1873.
In the late 19th century, Waxahachie was a major stop on the Texas and Pacific Railway, and the city grew rapidly as a result. The city was also home to several cotton mills and other industries, and by the early 20th century, Waxahachie had become a major center for cotton production.
The city continued to grow throughout the 20th century, and by the 2000 census, the population had grown to 24,469.
Geography
Waxahachie is located in north-central Texas, about 30 miles south of Dallas and 40 miles north of Fort Worth. The city is situated on the banks of the Trinity River, and is surrounded by rolling hills and prairies.
The climate in Waxahachie is generally mild, with hot summers and cool winters. The average annual temperature is around 68 degrees Fahrenheit, and the average annual precipitation is around 37 inches.
Economy
Waxahachie’s economy is largely based on agriculture and manufacturing. The city is home to several large manufacturing plants, including a General Motors plant and a Tyson Foods plant. The city is also home to several large agricultural operations, including cotton farms, cattle ranches, and poultry farms.
The city is also home to several large retail stores, including Walmart, Target, and Home Depot. The city is also home to several large medical facilities, including Baylor Scott & White Medical Center and Texas Health Presbyterian Hospital.
Demographics
As of the 2010 census, the population of Waxahachie was 30,621. The racial makeup of the city was 73.3% White, 15.2% African American, 0.7% Native American, 0.9% Asian, 0.1% Pacific Islander, 7.2% from other races, and 2.6% from two or more races. Hispanic or Latino of any race were 18.2% of the population.
The median income for a household in Waxahachie was $45,945, and the median income for a family was $54,945. The per capita income for the city was $22,845. About 11.3% of families and 14.2% of the population were below the poverty line, including 19.2% of those under age 18 and 8.2% of those age 65 or over.
Common Questions
What is Per Capita Income in Waxahachie?
Per Capita income in Waxahachie is $33,996.
What is the Median Family Income in Waxahachie?
Median Family Income in Waxahachie is $89,620.
What is the Median Household income in Waxahachie?
Median Household Income in Waxahachie is $80,044.
What is Income or Wage Gap in Waxahachie?
Income or Wage Gap in Waxahachie is 24.9%.
Women in Waxahachie earn 75.1 cents for every dollar earned by a man.
What is Family Income Deficit in Waxahachie?
Family Income Deficit in Waxahachie is $9,517.
Families that are below poverty line in Waxahachie earn $9,517 less on average than the poverty threshold level.
What is Inequality or Gini Index in Waxahachie?
Inequality or Gini Index in Waxahachie is 0.39.
What is the Total Population of Waxahachie?
Total Population of Waxahachie is 41,801.
What is the Total Male Population of Waxahachie?
Total Male Population of Waxahachie is 20,199.
What is the Total Female Population of Waxahachie?
Total Female Population of Waxahachie is 21,602.
What is the Ratio of Males per 100 Females in Waxahachie?
There are 93.51 Males per 100 Females in Waxahachie.
What is the Ratio of Females per 100 Males in Waxahachie?
There are 106.95 Females per 100 Males in Waxahachie.
What is the Median Population Age in Waxahachie?
Median Population Age in Waxahachie is 31.9 Years.
What is the Average Family Size in Waxahachie
Average Family Size in Waxahachie is 3.3 People.
What is the Average Household Size in Waxahachie
Average Household Size in Waxahachie is 2.8 People.
How Large is the Labor Force in Waxahachie?
There are 21,930 People in the Labor Forcein in Waxahachie.
What is the Percentage of People in the Labor Force in Waxahachie?
68.3% of People are in the Labor Force in Waxahachie.
What is the Unemployment Rate in Waxahachie?
Unemployment Rate in Waxahachie is 3.1%.