Burleson, TX Map & Demographics
Burleson Map
Burleson Overview
$36,700
PER CAPITA INCOME
$97,112
AVG FAMILY INCOME
$87,312
AVG HOUSEHOLD INCOME
23.3%
WAGE / INCOME GAP [ % ]
76.7¢/ $1
WAGE / INCOME GAP [ $ ]
$9,957
FAMILY INCOME DEFICIT
0.38
INEQUALITY / GINI INDEX
48,970
TOTAL POPULATION
23,762
MALE POPULATION
25,208
FEMALE POPULATION
94.26
MALES / 100 FEMALES
106.09
FEMALES / 100 MALES
35.4
MEDIAN AGE
3.4
AVG FAMILY SIZE
2.9
AVG HOUSEHOLD SIZE
25,142
LABOR FORCE [ PEOPLE ]
69.9%
PERCENT IN LABOR FORCE
3.8%
UNEMPLOYMENT RATE
Burleson Zip Codes
Income in Burleson
Income Overview in Burleson
Per Capita Income in Burleson is $36,700, while median incomes of families and households are $97,112 and $87,312 respectively.
| Characteristic | Number | Measure |
| Per Capita Income | 48,970 | $36,700 |
| Median Family Income | 12,742 | $97,112 |
| Mean Family Income | 12,742 | $114,291 |
| Median Household Income | 16,998 | $87,312 |
| Mean Household Income | 16,998 | $103,211 |
| Income Deficit | 12,742 | $9,957 |
| Wage / Income Gap (%) | 48,970 | 23.30% |
| Wage / Income Gap ($) | 48,970 | 76.70¢ per $1 |
| Gini / Inequality Index | 48,970 | 0.38 |
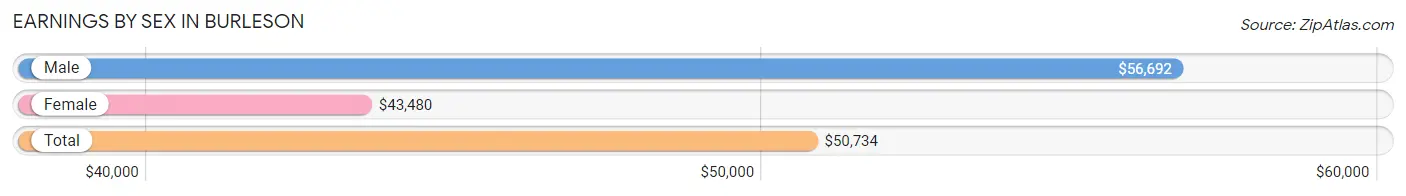
Earnings by Sex in Burleson
Average Earnings in Burleson are $50,734, $56,692 for men and $43,480 for women, a difference of 23.3%.
| Sex | Number | Average Earnings |
| Male | 13,777 (53.4%) | $56,692 |
| Female | 12,023 (46.6%) | $43,480 |
| Total | 25,800 (100.0%) | $50,734 |
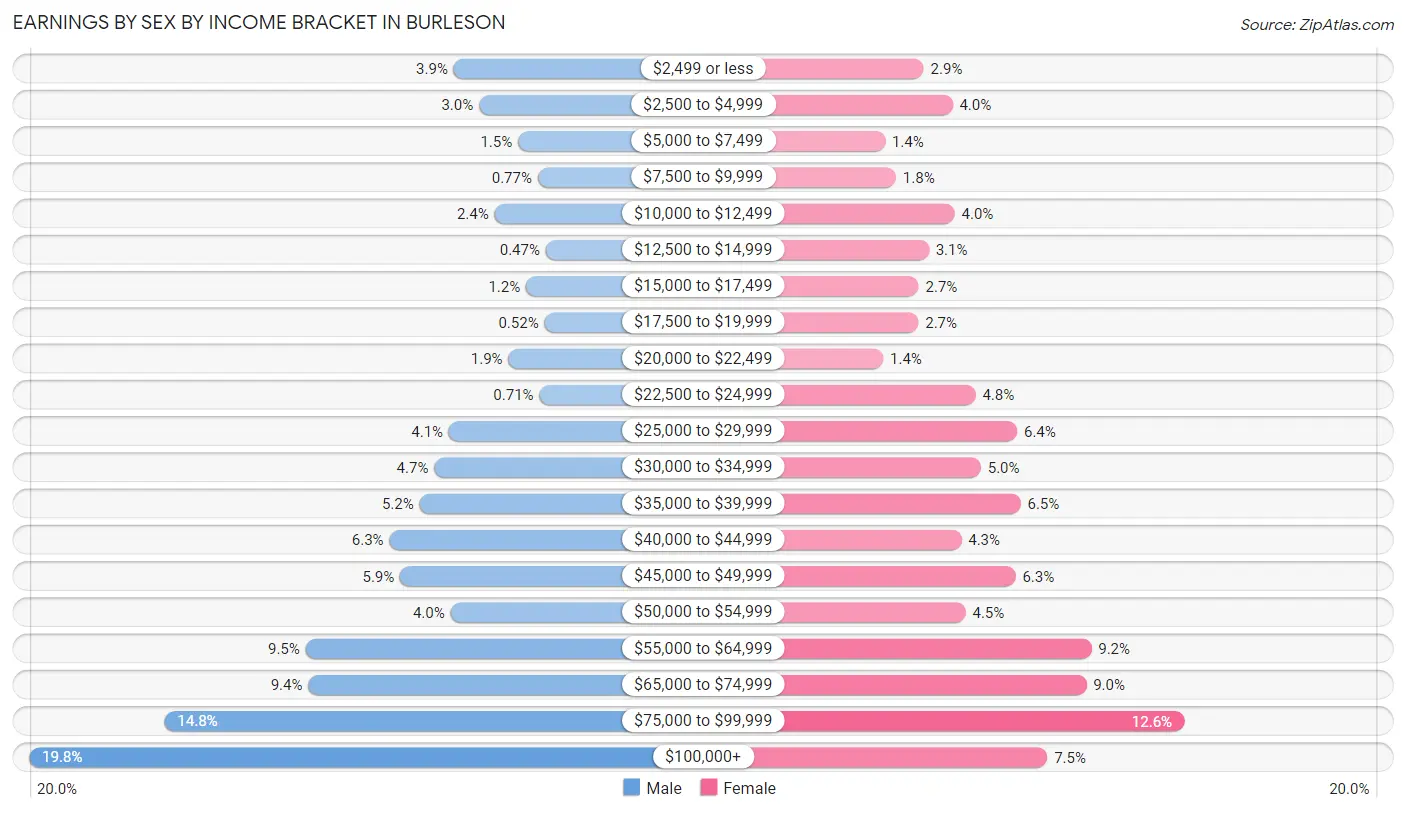
Earnings by Sex by Income Bracket in Burleson
The most common earnings brackets in Burleson are $100,000+ for men (2,732 | 19.8%) and $75,000 to $99,999 for women (1,518 | 12.6%).
| Income | Male | Female |
| $2,499 or less | 540 (3.9%) | 346 (2.9%) |
| $2,500 to $4,999 | 409 (3.0%) | 476 (4.0%) |
| $5,000 to $7,499 | 208 (1.5%) | 172 (1.4%) |
| $7,500 to $9,999 | 106 (0.8%) | 221 (1.8%) |
| $10,000 to $12,499 | 329 (2.4%) | 486 (4.0%) |
| $12,500 to $14,999 | 65 (0.5%) | 369 (3.1%) |
| $15,000 to $17,499 | 167 (1.2%) | 323 (2.7%) |
| $17,500 to $19,999 | 71 (0.5%) | 322 (2.7%) |
| $20,000 to $22,499 | 257 (1.9%) | 163 (1.4%) |
| $22,500 to $24,999 | 98 (0.7%) | 579 (4.8%) |
| $25,000 to $29,999 | 565 (4.1%) | 767 (6.4%) |
| $30,000 to $34,999 | 640 (4.6%) | 604 (5.0%) |
| $35,000 to $39,999 | 716 (5.2%) | 783 (6.5%) |
| $40,000 to $44,999 | 872 (6.3%) | 516 (4.3%) |
| $45,000 to $49,999 | 817 (5.9%) | 760 (6.3%) |
| $50,000 to $54,999 | 556 (4.0%) | 535 (4.4%) |
| $55,000 to $64,999 | 1,305 (9.5%) | 1,101 (9.2%) |
| $65,000 to $74,999 | 1,291 (9.4%) | 1,079 (9.0%) |
| $75,000 to $99,999 | 2,033 (14.8%) | 1,518 (12.6%) |
| $100,000+ | 2,732 (19.8%) | 903 (7.5%) |
| Total | 13,777 (100.0%) | 12,023 (100.0%) |
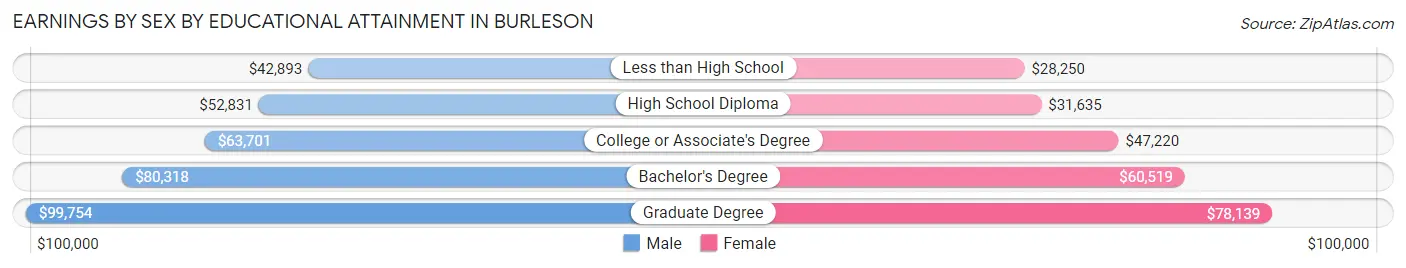
Earnings by Sex by Educational Attainment in Burleson
Average earnings in Burleson are $65,287 for men and $48,474 for women, a difference of 25.8%. Men with an educational attainment of graduate degree enjoy the highest average annual earnings of $99,754, while those with less than high school education earn the least with $42,893. Women with an educational attainment of graduate degree earn the most with the average annual earnings of $78,139, while those with less than high school education have the smallest earnings of $28,250.
| Educational Attainment | Male Income | Female Income |
| Less than High School | $42,893 | $28,250 |
| High School Diploma | $52,831 | $31,635 |
| College or Associate's Degree | $63,701 | $47,220 |
| Bachelor's Degree | $80,318 | $60,519 |
| Graduate Degree | $99,754 | $78,139 |
| Total | $65,287 | $48,474 |
Family Income in Burleson
Family Income Brackets in Burleson
According to the Burleson family income data, there are 3,211 families falling into the $100,000 to $149,999 income range, which is the most common income bracket and makes up 25.2% of all families. Conversely, the less than $10,000 income bracket is the least frequent group with only 178 families (1.4%) belonging to this category.
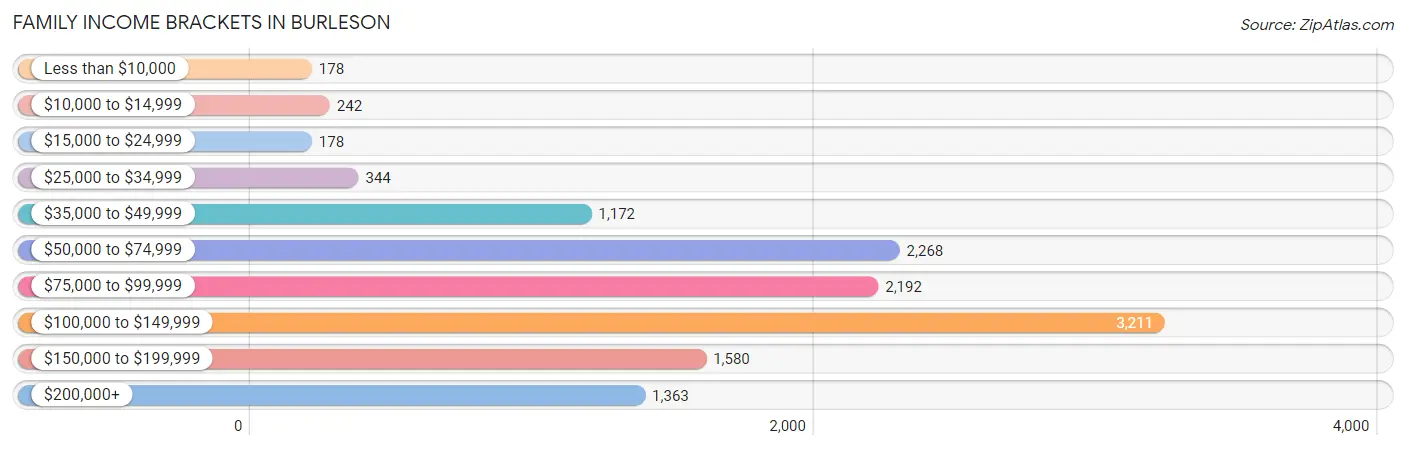
| Income Bracket | # Families | % Families |
| Less than $10,000 | 178 | 1.4% |
| $10,000 to $14,999 | 242 | 1.9% |
| $15,000 to $24,999 | 178 | 1.4% |
| $25,000 to $34,999 | 344 | 2.7% |
| $35,000 to $49,999 | 1,172 | 9.2% |
| $50,000 to $74,999 | 2,268 | 17.8% |
| $75,000 to $99,999 | 2,192 | 17.2% |
| $100,000 to $149,999 | 3,211 | 25.2% |
| $150,000 to $199,999 | 1,580 | 12.4% |
| $200,000+ | 1,363 | 10.7% |
Family Income by Famaliy Size in Burleson
5-person families (1,155 | 9.1%) account for the highest median family income in Burleson with $108,542 per family, while 2-person families (5,030 | 39.5%) have the highest median income of $43,468 per family member.
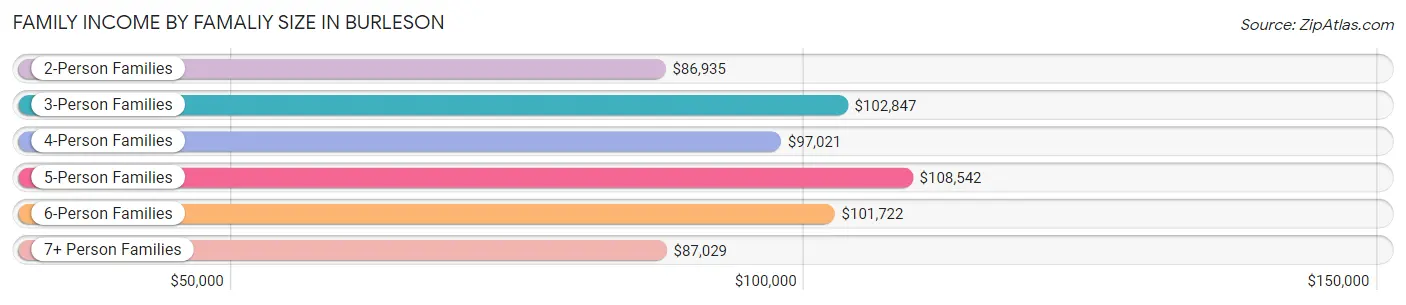
| Income Bracket | # Families | Median Income |
| 2-Person Families | 5,030 (39.5%) | $86,935 |
| 3-Person Families | 2,896 (22.7%) | $102,847 |
| 4-Person Families | 2,725 (21.4%) | $97,021 |
| 5-Person Families | 1,155 (9.1%) | $108,542 |
| 6-Person Families | 707 (5.6%) | $101,722 |
| 7+ Person Families | 229 (1.8%) | $87,029 |
| Total | 12,742 (100.0%) | $97,112 |
Family Income by Number of Earners in Burleson
The median family income in Burleson is $97,112, with families comprising 3+ earners (1,396) having the highest median family income of $172,835, while families with no earners (1,133) have the lowest median family income of $52,306, accounting for 11.0% and 8.9% of families, respectively.
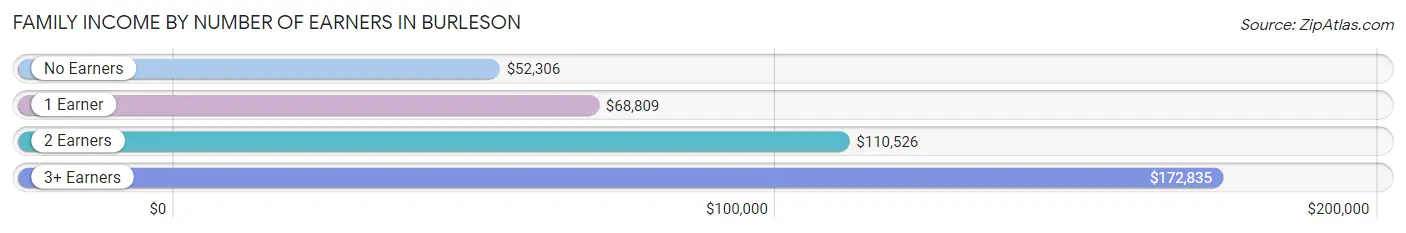
| Number of Earners | # Families | Median Income |
| No Earners | 1,133 (8.9%) | $52,306 |
| 1 Earner | 4,001 (31.4%) | $68,809 |
| 2 Earners | 6,212 (48.7%) | $110,526 |
| 3+ Earners | 1,396 (11.0%) | $172,835 |
| Total | 12,742 (100.0%) | $97,112 |
Household Income in Burleson
Household Income Brackets in Burleson
With 4,063 households falling in the category, the $100,000 to $149,999 income range is the most frequent in Burleson, accounting for 23.9% of all households. In contrast, only 425 households (2.5%) fall into the less than $10,000 income bracket, making it the least populous group.
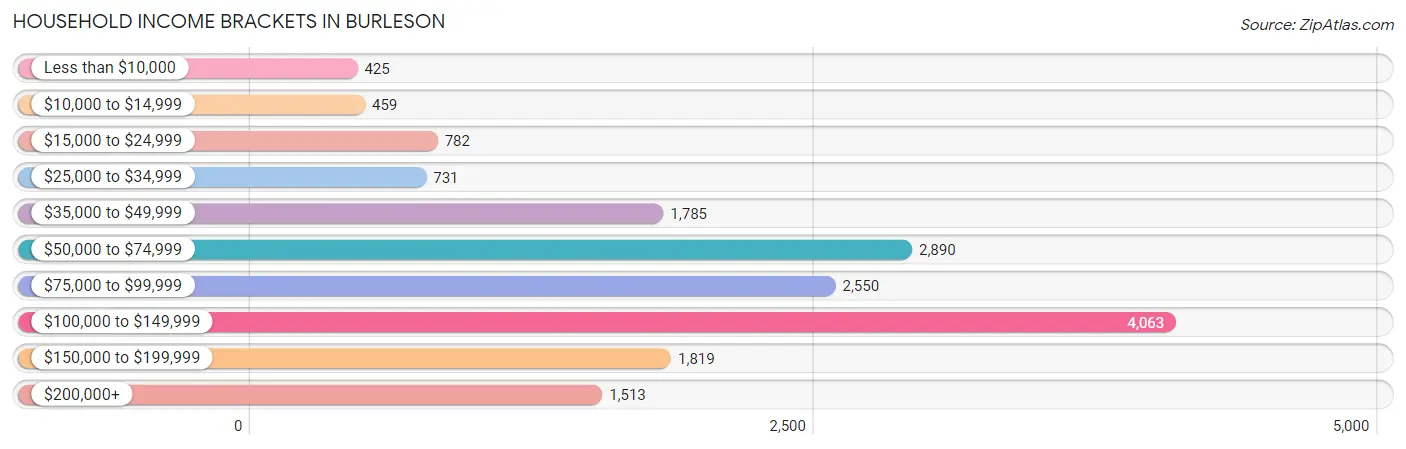
| Income Bracket | # Households | % Households |
| Less than $10,000 | 425 | 2.5% |
| $10,000 to $14,999 | 459 | 2.7% |
| $15,000 to $24,999 | 782 | 4.6% |
| $25,000 to $34,999 | 731 | 4.3% |
| $35,000 to $49,999 | 1,785 | 10.5% |
| $50,000 to $74,999 | 2,890 | 17.0% |
| $75,000 to $99,999 | 2,550 | 15.0% |
| $100,000 to $149,999 | 4,063 | 23.9% |
| $150,000 to $199,999 | 1,819 | 10.7% |
| $200,000+ | 1,513 | 8.9% |
Household Income by Householder Age in Burleson
The median household income in Burleson is $87,312, with the highest median household income of $106,019 found in the 45 to 64 years age bracket for the primary householder. A total of 5,793 households (34.1%) fall into this category. Meanwhile, the 65+ years age bracket for the primary householder has the lowest median household income of $54,450, with 3,837 households (22.6%) in this group.
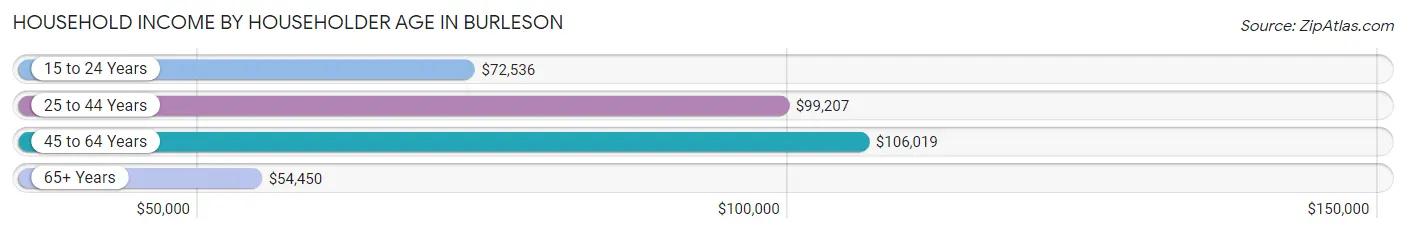
| Income Bracket | # Households | Median Income |
| 15 to 24 Years | 558 (3.3%) | $72,536 |
| 25 to 44 Years | 6,810 (40.1%) | $99,207 |
| 45 to 64 Years | 5,793 (34.1%) | $106,019 |
| 65+ Years | 3,837 (22.6%) | $54,450 |
| Total | 16,998 (100.0%) | $87,312 |
Poverty in Burleson
Income Below Poverty by Sex and Age in Burleson
With 6.0% poverty level for males and 8.5% for females among the residents of Burleson, 6 to 11 year old males and 15 year old females are the most vulnerable to poverty, with 349 males (14.0%) and 101 females (20.2%) in their respective age groups living below the poverty level.
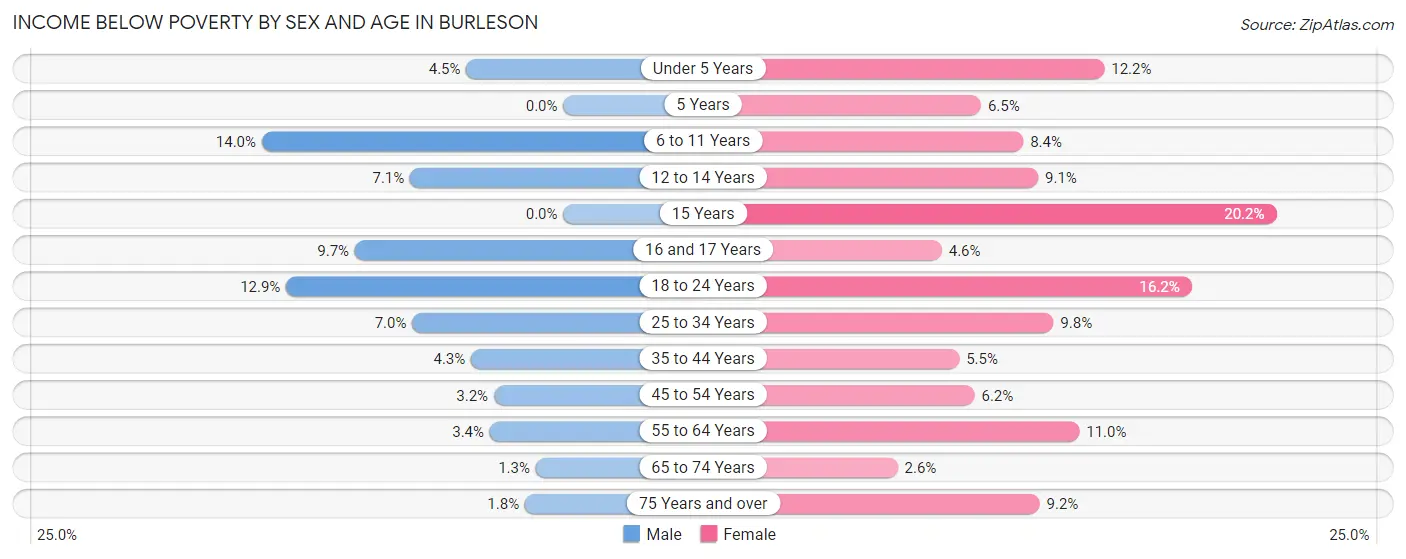
| Age Bracket | Male | Female |
| Under 5 Years | 87 (4.5%) | 228 (12.2%) |
| 5 Years | 0 (0.0%) | 39 (6.5%) |
| 6 to 11 Years | 349 (14.0%) | 185 (8.4%) |
| 12 to 14 Years | 108 (7.1%) | 110 (9.1%) |
| 15 Years | 0 (0.0%) | 101 (20.2%) |
| 16 and 17 Years | 76 (9.7%) | 35 (4.6%) |
| 18 to 24 Years | 230 (12.9%) | 285 (16.2%) |
| 25 to 34 Years | 201 (7.0%) | 315 (9.8%) |
| 35 to 44 Years | 166 (4.3%) | 235 (5.4%) |
| 45 to 54 Years | 97 (3.2%) | 169 (6.2%) |
| 55 to 64 Years | 82 (3.4%) | 264 (11.0%) |
| 65 to 74 Years | 20 (1.3%) | 58 (2.6%) |
| 75 Years and over | 15 (1.8%) | 121 (9.2%) |
| Total | 1,431 (6.0%) | 2,145 (8.5%) |
Income Above Poverty by Sex and Age in Burleson
According to the poverty statistics in Burleson, males aged 5 years and females aged 65 to 74 years are the age groups that are most secure financially, with 100.0% of males and 97.4% of females in these age groups living above the poverty line.
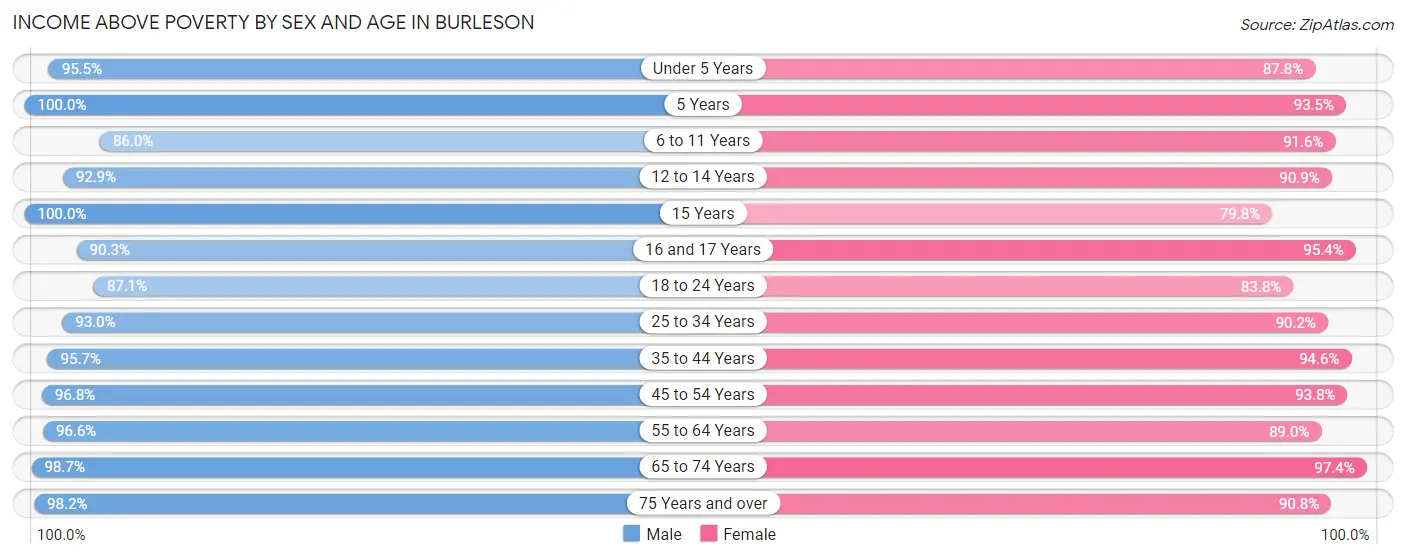
| Age Bracket | Male | Female |
| Under 5 Years | 1,846 (95.5%) | 1,644 (87.8%) |
| 5 Years | 166 (100.0%) | 565 (93.5%) |
| 6 to 11 Years | 2,146 (86.0%) | 2,011 (91.6%) |
| 12 to 14 Years | 1,411 (92.9%) | 1,098 (90.9%) |
| 15 Years | 446 (100.0%) | 400 (79.8%) |
| 16 and 17 Years | 710 (90.3%) | 720 (95.4%) |
| 18 to 24 Years | 1,559 (87.1%) | 1,471 (83.8%) |
| 25 to 34 Years | 2,668 (93.0%) | 2,894 (90.2%) |
| 35 to 44 Years | 3,714 (95.7%) | 4,073 (94.6%) |
| 45 to 54 Years | 2,920 (96.8%) | 2,575 (93.8%) |
| 55 to 64 Years | 2,323 (96.6%) | 2,132 (89.0%) |
| 65 to 74 Years | 1,548 (98.7%) | 2,184 (97.4%) |
| 75 Years and over | 827 (98.2%) | 1,197 (90.8%) |
| Total | 22,284 (94.0%) | 22,964 (91.5%) |
Income Below Poverty Among Married-Couple Families in Burleson
The poverty statistics for married-couple families in Burleson show that 3.9% or 375 of the total 9,567 families live below the poverty line. Families with 3 or 4 children have the highest poverty rate of 6.8%, comprising of 83 families. On the other hand, families with 5 or more children have the lowest poverty rate of 0.0%, which includes 0 families.
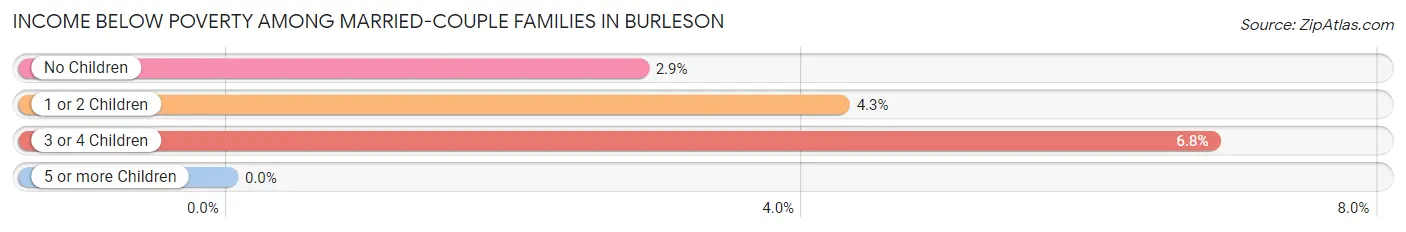
| Children | Above Poverty | Below Poverty |
| No Children | 4,382 (97.1%) | 129 (2.9%) |
| 1 or 2 Children | 3,665 (95.7%) | 163 (4.3%) |
| 3 or 4 Children | 1,131 (93.2%) | 83 (6.8%) |
| 5 or more Children | 14 (100.0%) | 0 (0.0%) |
| Total | 9,192 (96.1%) | 375 (3.9%) |
Income Below Poverty Among Single-Parent Households in Burleson
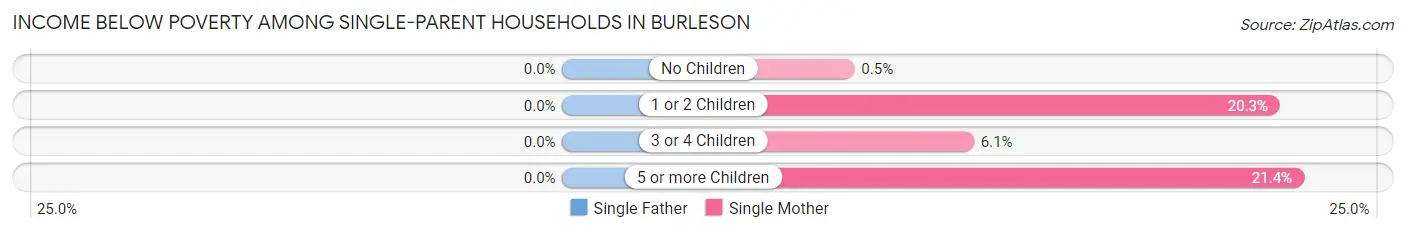
| Children | Single Father | Single Mother |
| No Children | 0 (0.0%) | 3 (0.5%) |
| 1 or 2 Children | 0 (0.0%) | 290 (20.3%) |
| 3 or 4 Children | 0 (0.0%) | 16 (6.1%) |
| 5 or more Children | 0 (0.0%) | 24 (21.4%) |
| Total | 0 (0.0%) | 333 (13.8%) |
Income Below Poverty Among Married-Couple vs Single-Parent Households in Burleson
The poverty data for Burleson shows that 375 of the married-couple family households (3.9%) and 333 of the single-parent households (10.5%) are living below the poverty level. Within the married-couple family households, those with 3 or 4 children have the highest poverty rate, with 83 households (6.8%) falling below the poverty line. Among the single-parent households, those with 5 or more children have the highest poverty rate, with 24 household (21.4%) living below poverty.
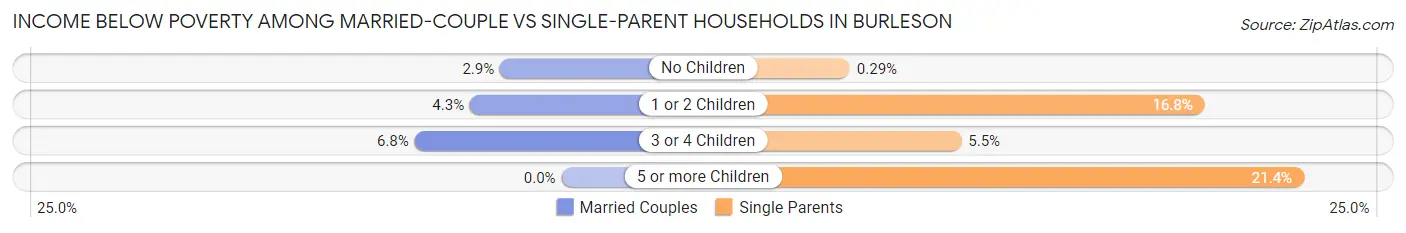
| Children | Married-Couple Families | Single-Parent Households |
| No Children | 129 (2.9%) | 3 (0.3%) |
| 1 or 2 Children | 163 (4.3%) | 290 (16.8%) |
| 3 or 4 Children | 83 (6.8%) | 16 (5.5%) |
| 5 or more Children | 0 (0.0%) | 24 (21.4%) |
| Total | 375 (3.9%) | 333 (10.5%) |
Race in Burleson
The most populous races in Burleson are White / Caucasian (39,149 | 79.9%), Hispanic or Latino (9,073 | 18.5%), and Two or more Races (5,482 | 11.2%).
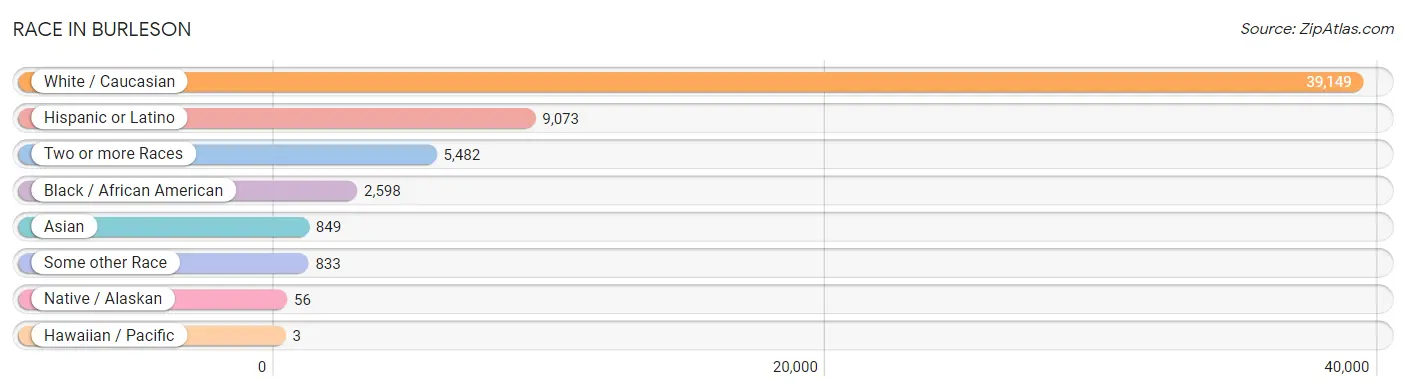
| Race | # Population | % Population |
| Asian | 849 | 1.7% |
| Black / African American | 2,598 | 5.3% |
| Hawaiian / Pacific | 3 | 0.0% |
| Hispanic or Latino | 9,073 | 18.5% |
| Native / Alaskan | 56 | 0.1% |
| White / Caucasian | 39,149 | 79.9% |
| Two or more Races | 5,482 | 11.2% |
| Some other Race | 833 | 1.7% |
| Total | 48,970 | 100.0% |
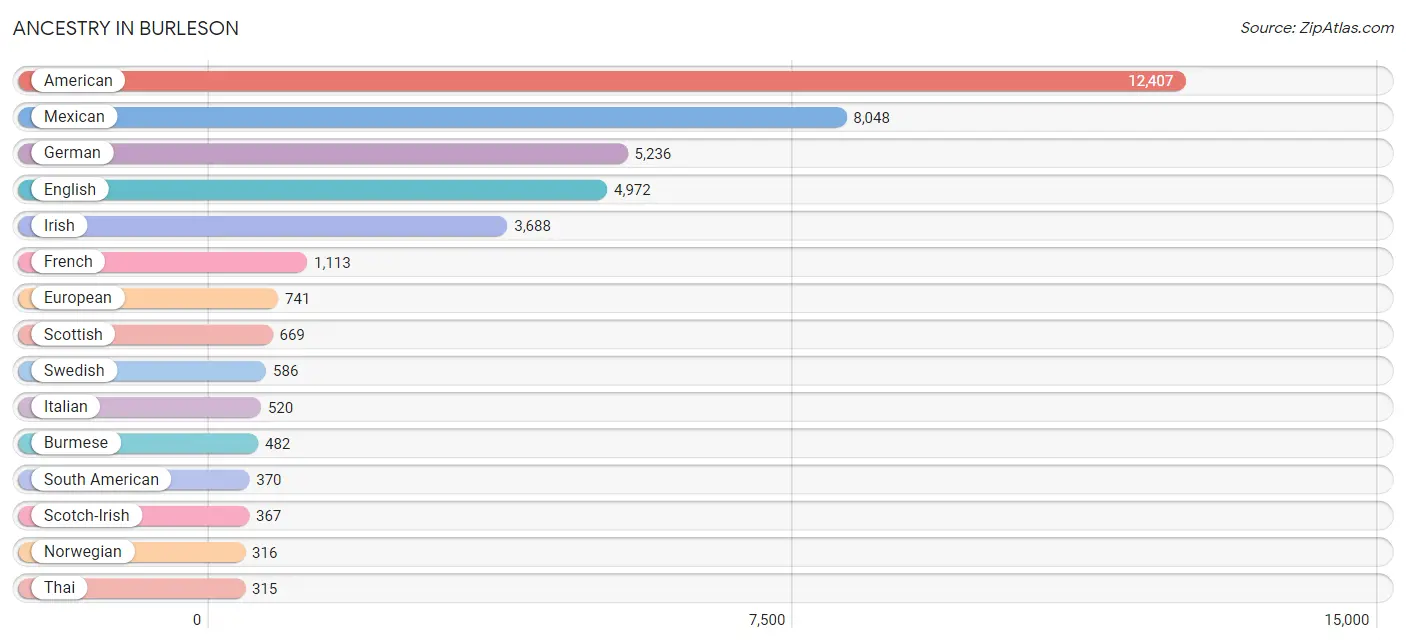
Ancestry in Burleson
The most populous ancestries reported in Burleson are American (12,407 | 25.3%), Mexican (8,048 | 16.4%), German (5,236 | 10.7%), English (4,972 | 10.2%), and Irish (3,688 | 7.5%), together accounting for 70.1% of all Burleson residents.
| Ancestry | # Population | % Population |
| African | 153 | 0.3% |
| American | 12,407 | 25.3% |
| Apache | 2 | 0.0% |
| Arab | 154 | 0.3% |
| Argentinean | 25 | 0.1% |
| Australian | 13 | 0.0% |
| Austrian | 9 | 0.0% |
| Belgian | 36 | 0.1% |
| Blackfeet | 21 | 0.0% |
| Brazilian | 172 | 0.4% |
| British | 118 | 0.2% |
| Burmese | 482 | 1.0% |
| Cajun | 103 | 0.2% |
| Canadian | 11 | 0.0% |
| Central American | 224 | 0.5% |
| Cherokee | 213 | 0.4% |
| Chickasaw | 83 | 0.2% |
| Chilean | 40 | 0.1% |
| Choctaw | 142 | 0.3% |
| Colombian | 82 | 0.2% |
| Comanche | 8 | 0.0% |
| Cuban | 161 | 0.3% |
| Czech | 127 | 0.3% |
| Czechoslovakian | 61 | 0.1% |
| Danish | 73 | 0.2% |
| Dominican | 10 | 0.0% |
| Dutch | 285 | 0.6% |
| Dutch West Indian | 90 | 0.2% |
| Eastern European | 28 | 0.1% |
| Ecuadorian | 10 | 0.0% |
| Egyptian | 19 | 0.0% |
| English | 4,972 | 10.2% |
| European | 741 | 1.5% |
| Finnish | 28 | 0.1% |
| French | 1,113 | 2.3% |
| French Canadian | 49 | 0.1% |
| German | 5,236 | 10.7% |
| Greek | 20 | 0.0% |
| Guatemalan | 149 | 0.3% |
| Hungarian | 120 | 0.3% |
| Indian (Asian) | 197 | 0.4% |
| Iranian | 48 | 0.1% |
| Irish | 3,688 | 7.5% |
| Iroquois | 6 | 0.0% |
| Italian | 520 | 1.1% |
| Jamaican | 20 | 0.0% |
| Jordanian | 11 | 0.0% |
| Kenyan | 30 | 0.1% |
| Kiowa | 2 | 0.0% |
| Korean | 156 | 0.3% |
| Laotian | 34 | 0.1% |
| Lebanese | 19 | 0.0% |
| Menominee | 135 | 0.3% |
| Mexican | 8,048 | 16.4% |
| Mexican American Indian | 15 | 0.0% |
| Nigerian | 56 | 0.1% |
| Northern European | 39 | 0.1% |
| Norwegian | 316 | 0.6% |
| Osage | 22 | 0.0% |
| Pakistani | 36 | 0.1% |
| Pennsylvania German | 33 | 0.1% |
| Peruvian | 143 | 0.3% |
| Polish | 210 | 0.4% |
| Portuguese | 14 | 0.0% |
| Puerto Rican | 96 | 0.2% |
| Romanian | 113 | 0.2% |
| Russian | 140 | 0.3% |
| Salvadoran | 75 | 0.2% |
| Scandinavian | 108 | 0.2% |
| Scotch-Irish | 367 | 0.7% |
| Scottish | 669 | 1.4% |
| Sioux | 18 | 0.0% |
| Slovak | 15 | 0.0% |
| South American | 370 | 0.8% |
| South American Indian | 36 | 0.1% |
| Spaniard | 51 | 0.1% |
| Spanish | 40 | 0.1% |
| Sri Lankan | 152 | 0.3% |
| Subsaharan African | 227 | 0.5% |
| Swedish | 586 | 1.2% |
| Swiss | 23 | 0.1% |
| Syrian | 61 | 0.1% |
| Thai | 315 | 0.6% |
| Turkish | 12 | 0.0% |
| Venezuelan | 70 | 0.1% |
| Welsh | 197 | 0.4% |
| Yaqui | 75 | 0.2% | View All 87 Rows |
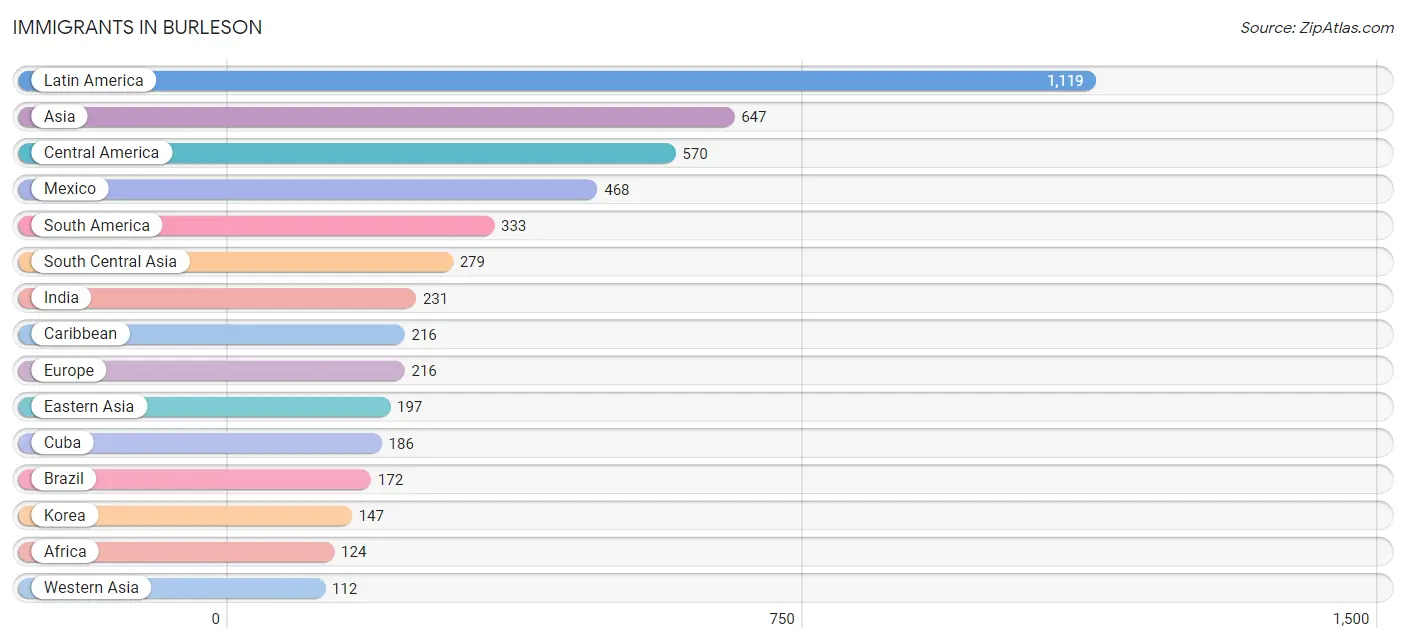
Immigrants in Burleson
The most numerous immigrant groups reported in Burleson came from Latin America (1,119 | 2.3%), Asia (647 | 1.3%), Central America (570 | 1.2%), Mexico (468 | 1.0%), and South America (333 | 0.7%), together accounting for 6.4% of all Burleson residents.
| Immigration Origin | # Population | % Population |
| Africa | 124 | 0.3% |
| Argentina | 9 | 0.0% |
| Asia | 647 | 1.3% |
| Belarus | 9 | 0.0% |
| Brazil | 172 | 0.4% |
| Canada | 24 | 0.1% |
| Caribbean | 216 | 0.4% |
| Central America | 570 | 1.2% |
| China | 50 | 0.1% |
| Colombia | 66 | 0.1% |
| Cuba | 186 | 0.4% |
| Dominican Republic | 10 | 0.0% |
| Eastern Africa | 30 | 0.1% |
| Eastern Asia | 197 | 0.4% |
| Eastern Europe | 75 | 0.2% |
| Ecuador | 10 | 0.0% |
| Egypt | 19 | 0.0% |
| El Salvador | 19 | 0.0% |
| England | 44 | 0.1% |
| Europe | 216 | 0.4% |
| Germany | 25 | 0.1% |
| Guatemala | 83 | 0.2% |
| India | 231 | 0.5% |
| Indonesia | 10 | 0.0% |
| Iran | 48 | 0.1% |
| Jamaica | 20 | 0.0% |
| Jordan | 47 | 0.1% |
| Kenya | 30 | 0.1% |
| Korea | 147 | 0.3% |
| Latin America | 1,119 | 2.3% |
| Lebanon | 19 | 0.0% |
| Mexico | 468 | 1.0% |
| Middle Africa | 17 | 0.0% |
| Nigeria | 58 | 0.1% |
| Northern Africa | 19 | 0.0% |
| Northern Europe | 84 | 0.2% |
| Norway | 22 | 0.0% |
| Peru | 42 | 0.1% |
| Philippines | 43 | 0.1% |
| Romania | 39 | 0.1% |
| Russia | 27 | 0.1% |
| South America | 333 | 0.7% |
| South Central Asia | 279 | 0.6% |
| South Eastern Asia | 59 | 0.1% |
| Southern Europe | 32 | 0.1% |
| Spain | 32 | 0.1% |
| Syria | 46 | 0.1% |
| Venezuela | 34 | 0.1% |
| Vietnam | 6 | 0.0% |
| Western Africa | 58 | 0.1% |
| Western Asia | 112 | 0.2% |
| Western Europe | 25 | 0.1% |
| Zaire | 17 | 0.0% | View All 53 Rows |
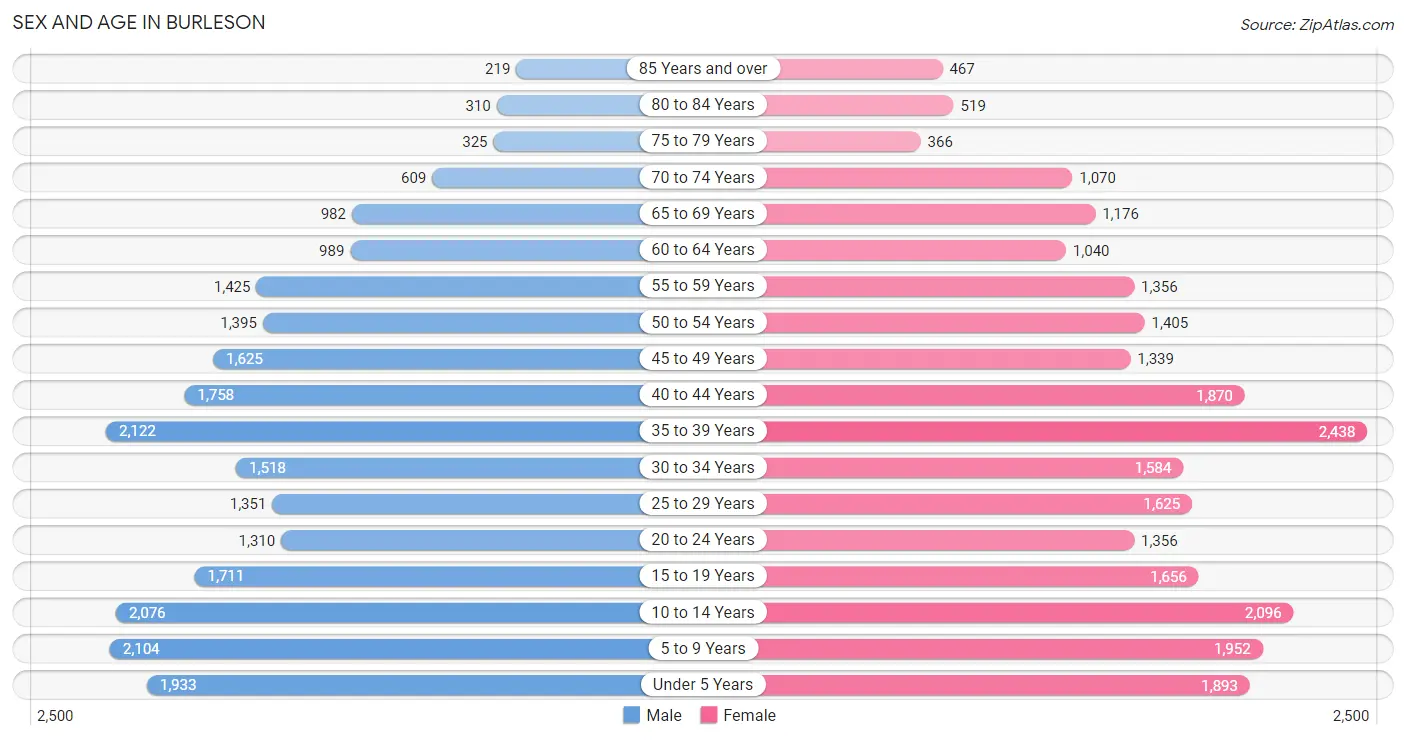
Sex and Age in Burleson
Sex and Age in Burleson
The most populous age groups in Burleson are 35 to 39 Years (2,122 | 8.9%) for men and 35 to 39 Years (2,438 | 9.7%) for women.
| Age Bracket | Male | Female |
| Under 5 Years | 1,933 (8.1%) | 1,893 (7.5%) |
| 5 to 9 Years | 2,104 (8.8%) | 1,952 (7.7%) |
| 10 to 14 Years | 2,076 (8.7%) | 2,096 (8.3%) |
| 15 to 19 Years | 1,711 (7.2%) | 1,656 (6.6%) |
| 20 to 24 Years | 1,310 (5.5%) | 1,356 (5.4%) |
| 25 to 29 Years | 1,351 (5.7%) | 1,625 (6.5%) |
| 30 to 34 Years | 1,518 (6.4%) | 1,584 (6.3%) |
| 35 to 39 Years | 2,122 (8.9%) | 2,438 (9.7%) |
| 40 to 44 Years | 1,758 (7.4%) | 1,870 (7.4%) |
| 45 to 49 Years | 1,625 (6.8%) | 1,339 (5.3%) |
| 50 to 54 Years | 1,395 (5.9%) | 1,405 (5.6%) |
| 55 to 59 Years | 1,425 (6.0%) | 1,356 (5.4%) |
| 60 to 64 Years | 989 (4.2%) | 1,040 (4.1%) |
| 65 to 69 Years | 982 (4.1%) | 1,176 (4.7%) |
| 70 to 74 Years | 609 (2.6%) | 1,070 (4.2%) |
| 75 to 79 Years | 325 (1.4%) | 366 (1.5%) |
| 80 to 84 Years | 310 (1.3%) | 519 (2.1%) |
| 85 Years and over | 219 (0.9%) | 467 (1.8%) |
| Total | 23,762 (100.0%) | 25,208 (100.0%) |
Families and Households in Burleson
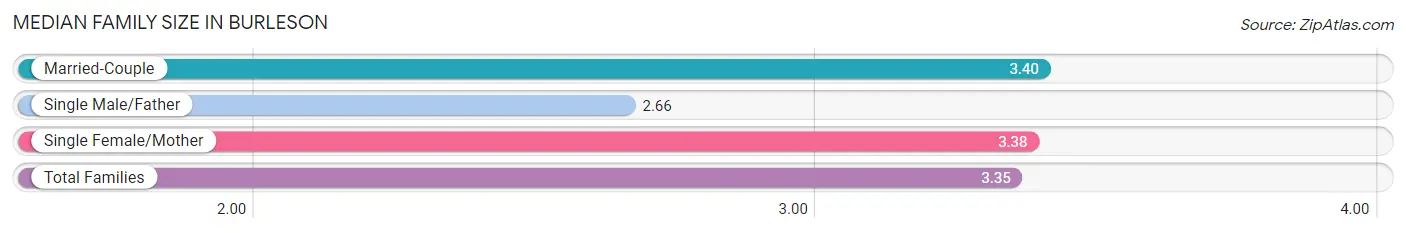
Median Family Size in Burleson
The median family size in Burleson is 3.35 persons per family, with married-couple families (9,567 | 75.1%) accounting for the largest median family size of 3.4 persons per family. On the other hand, single male/father families (768 | 6.0%) represent the smallest median family size with 2.66 persons per family.
| Family Type | # Families | Family Size |
| Married-Couple | 9,567 (75.1%) | 3.40 |
| Single Male/Father | 768 (6.0%) | 2.66 |
| Single Female/Mother | 2,407 (18.9%) | 3.38 |
| Total Families | 12,742 (100.0%) | 3.35 |
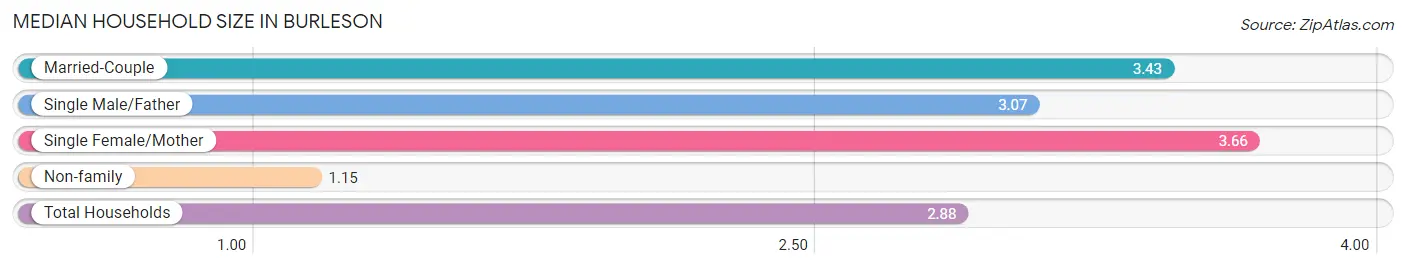
Median Household Size in Burleson
The median household size in Burleson is 2.88 persons per household, with single female/mother households (2,407 | 14.2%) accounting for the largest median household size of 3.66 persons per household. non-family households (4,256 | 25.0%) represent the smallest median household size with 1.15 persons per household.
| Household Type | # Households | Household Size |
| Married-Couple | 9,567 (56.3%) | 3.43 |
| Single Male/Father | 768 (4.5%) | 3.07 |
| Single Female/Mother | 2,407 (14.2%) | 3.66 |
| Non-family | 4,256 (25.0%) | 1.15 |
| Total Households | 16,998 (100.0%) | 2.88 |
Household Size by Marriage Status in Burleson
Out of a total of 16,998 households in Burleson, 12,742 (75.0%) are family households, while 4,256 (25.0%) are nonfamily households. The most numerous type of family households are 2-person households, comprising 4,722, and the most common type of nonfamily households are 1-person households, comprising 3,672.
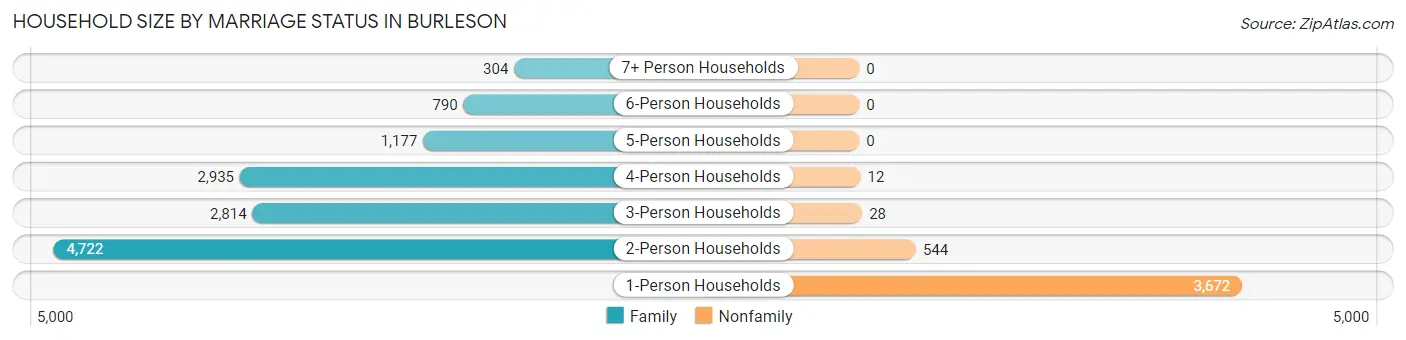
| Household Size | Family Households | Nonfamily Households |
| 1-Person Households | - | 3,672 (21.6%) |
| 2-Person Households | 4,722 (27.8%) | 544 (3.2%) |
| 3-Person Households | 2,814 (16.6%) | 28 (0.2%) |
| 4-Person Households | 2,935 (17.3%) | 12 (0.1%) |
| 5-Person Households | 1,177 (6.9%) | 0 (0.0%) |
| 6-Person Households | 790 (4.6%) | 0 (0.0%) |
| 7+ Person Households | 304 (1.8%) | 0 (0.0%) |
| Total | 12,742 (75.0%) | 4,256 (25.0%) |
Female Fertility in Burleson
Fertility by Age in Burleson
Average fertility rate in Burleson is 54.0 births per 1,000 women. Women in the age bracket of 20 to 34 years have the highest fertility rate with 87.0 births per 1,000 women. Women in the age bracket of 20 to 34 years acount for 59.4% of all women with births.
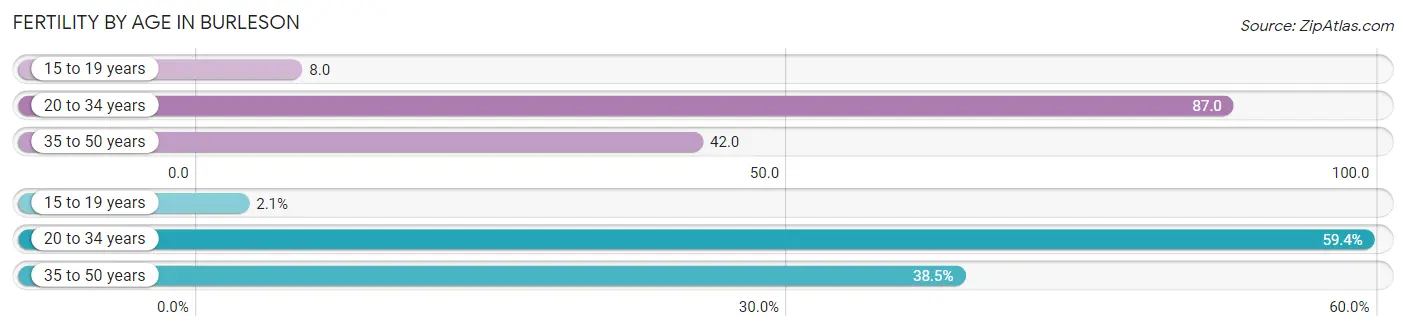
| Age Bracket | Women with Births | Births / 1,000 Women |
| 15 to 19 years | 14 (2.1%) | 8.0 |
| 20 to 34 years | 396 (59.4%) | 87.0 |
| 35 to 50 years | 257 (38.5%) | 42.0 |
| Total | 667 (100.0%) | 54.0 |
Fertility by Age by Marriage Status in Burleson
72.1% of women with births (667) in Burleson are married. The highest percentage of unmarried women with births falls into 15 to 19 years age bracket with 100.0% of them unmarried at the time of birth, while the lowest percentage of unmarried women with births belong to 35 to 50 years age bracket with 24.5% of them unmarried.
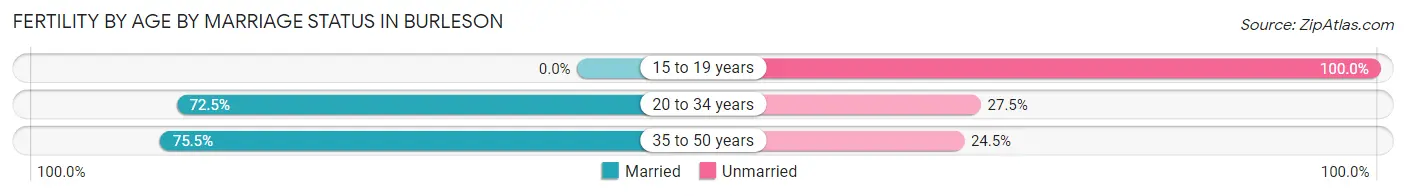
| Age Bracket | Married | Unmarried |
| 15 to 19 years | 0 (0.0%) | 14 (100.0%) |
| 20 to 34 years | 287 (72.5%) | 109 (27.5%) |
| 35 to 50 years | 194 (75.5%) | 63 (24.5%) |
| Total | 481 (72.1%) | 186 (27.9%) |
Fertility by Education in Burleson
Average fertility rate in Burleson is 54.0 births per 1,000 women. Women with the education attainment of bachelor's degree have the highest fertility rate of 84.0 births per 1,000 women, while women with the education attainment of less than high school have the lowest fertility at 9.0 births per 1,000 women. Women with the education attainment of bachelor's degree represent 33.9% of all women with births.
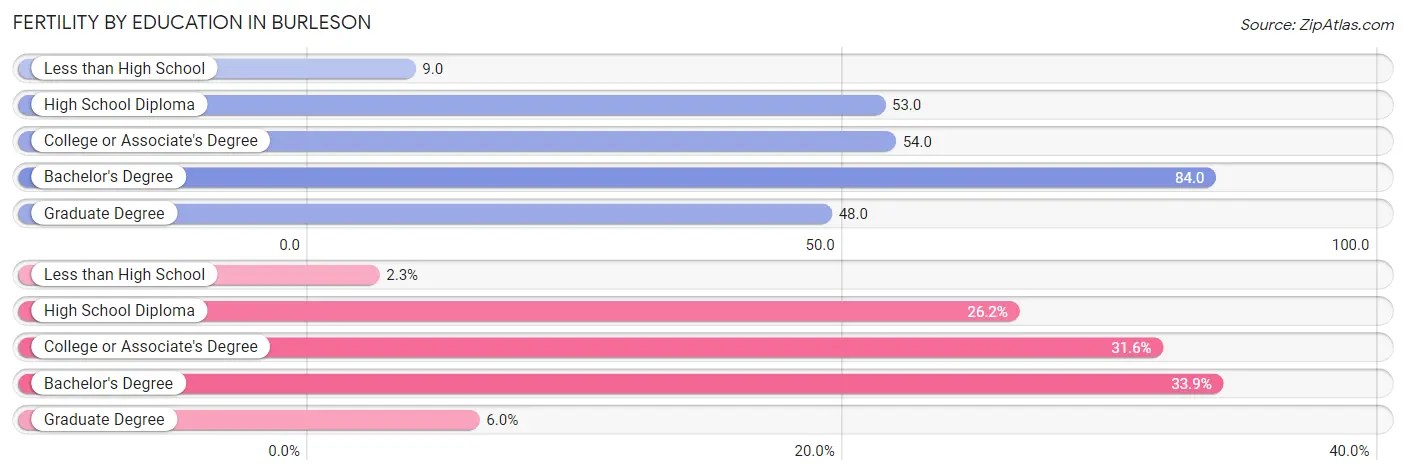
| Educational Attainment | Women with Births | Births / 1,000 Women |
| Less than High School | 15 (2.2%) | 9.0 |
| High School Diploma | 175 (26.2%) | 53.0 |
| College or Associate's Degree | 211 (31.6%) | 54.0 |
| Bachelor's Degree | 226 (33.9%) | 84.0 |
| Graduate Degree | 40 (6.0%) | 48.0 |
| Total | 667 (100.0%) | 54.0 |
Fertility by Education by Marriage Status in Burleson
27.9% of women with births in Burleson are unmarried. Women with the educational attainment of less than high school are most likely to be married with 100.0% of them married at childbirth, while women with the educational attainment of high school diploma are least likely to be married with 58.9% of them unmarried at childbirth.
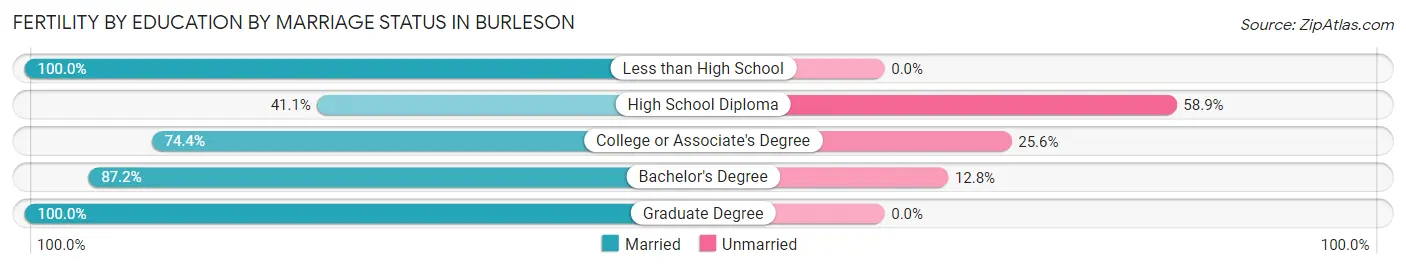
| Educational Attainment | Married | Unmarried |
| Less than High School | 15 (100.0%) | 0 (0.0%) |
| High School Diploma | 72 (41.1%) | 103 (58.9%) |
| College or Associate's Degree | 157 (74.4%) | 54 (25.6%) |
| Bachelor's Degree | 197 (87.2%) | 29 (12.8%) |
| Graduate Degree | 40 (100.0%) | 0 (0.0%) |
| Total | 481 (72.1%) | 186 (27.9%) |
Employment Characteristics in Burleson
Employment by Class of Employer in Burleson
Among the 23,862 employed individuals in Burleson, private company employees (17,057 | 71.5%), local government employees (1,875 | 7.9%), and not-for-profit organizations (1,561 | 6.5%) make up the most common classes of employment.
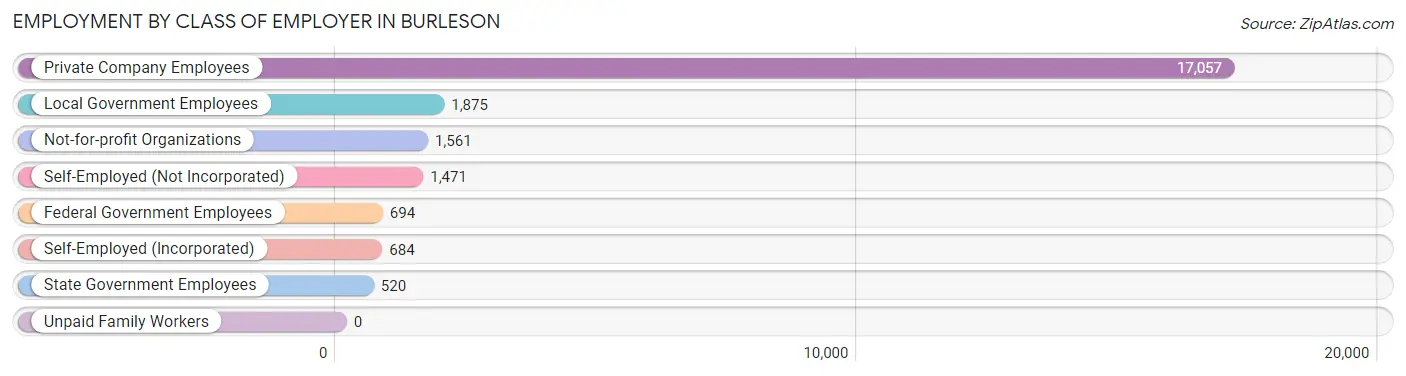
| Employer Class | # Employees | % Employees |
| Private Company Employees | 17,057 | 71.5% |
| Self-Employed (Incorporated) | 684 | 2.9% |
| Self-Employed (Not Incorporated) | 1,471 | 6.2% |
| Not-for-profit Organizations | 1,561 | 6.5% |
| Local Government Employees | 1,875 | 7.9% |
| State Government Employees | 520 | 2.2% |
| Federal Government Employees | 694 | 2.9% |
| Unpaid Family Workers | 0 | 0.0% |
| Total | 23,862 | 100.0% |
Employment Status by Age in Burleson
According to the labor force statistics for Burleson, out of the total population over 16 years of age (35,969), 69.9% or 25,142 individuals are in the labor force, with 3.8% or 955 of them unemployed. The age group with the highest labor force participation rate is 45 to 54 years, with 89.2% or 5,141 individuals in the labor force. Within the labor force, the 65 to 74 years age range has the highest percentage of unemployed individuals, with 8.2% or 88 of them being unemployed.
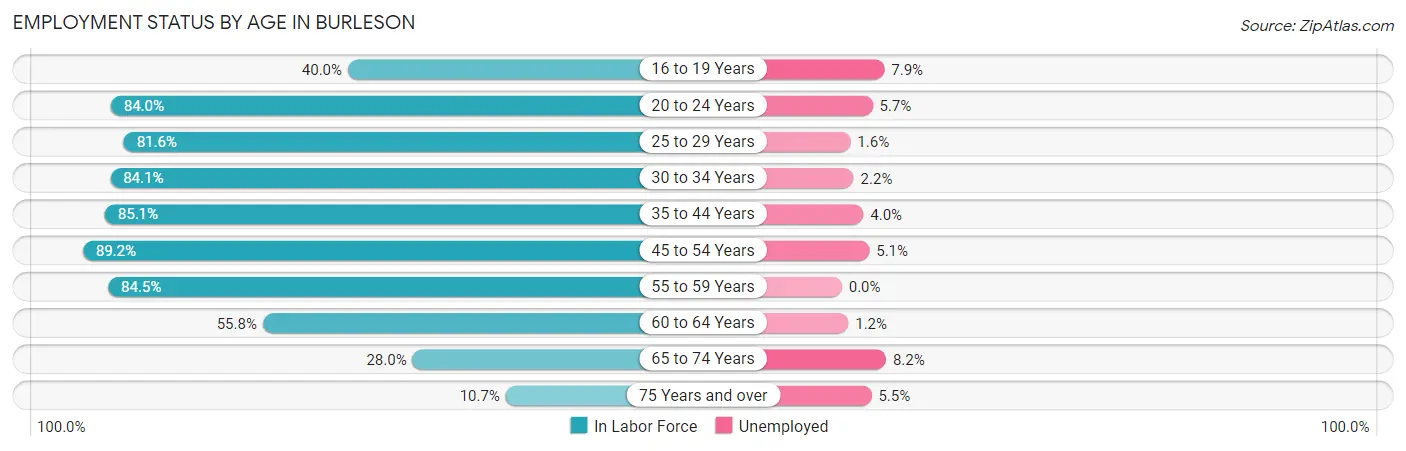
| Age Bracket | In Labor Force | Unemployed |
| 16 to 19 Years | 968 (40.0%) | 76 (7.9%) |
| 20 to 24 Years | 2,239 (84.0%) | 128 (5.7%) |
| 25 to 29 Years | 2,428 (81.6%) | 39 (1.6%) |
| 30 to 34 Years | 2,609 (84.1%) | 57 (2.2%) |
| 35 to 44 Years | 6,968 (85.1%) | 279 (4.0%) |
| 45 to 54 Years | 5,141 (89.2%) | 262 (5.1%) |
| 55 to 59 Years | 2,350 (84.5%) | 0 (0.0%) |
| 60 to 64 Years | 1,132 (55.8%) | 14 (1.2%) |
| 65 to 74 Years | 1,074 (28.0%) | 88 (8.2%) |
| 75 Years and over | 236 (10.7%) | 13 (5.5%) |
| Total | 25,142 (69.9%) | 955 (3.8%) |
Employment Status by Educational Attainment in Burleson
According to labor force statistics for Burleson, 83.0% of individuals (20,617) out of the total population between 25 and 64 years of age (24,840) are in the labor force, with 3.2% or 660 of them being unemployed. The group with the highest labor force participation rate are those with the educational attainment of bachelor's degree or higher, with 89.6% or 6,632 individuals in the labor force. Within the labor force, individuals with high school diploma education have the highest percentage of unemployment, with 5.0% or 258 of them being unemployed.
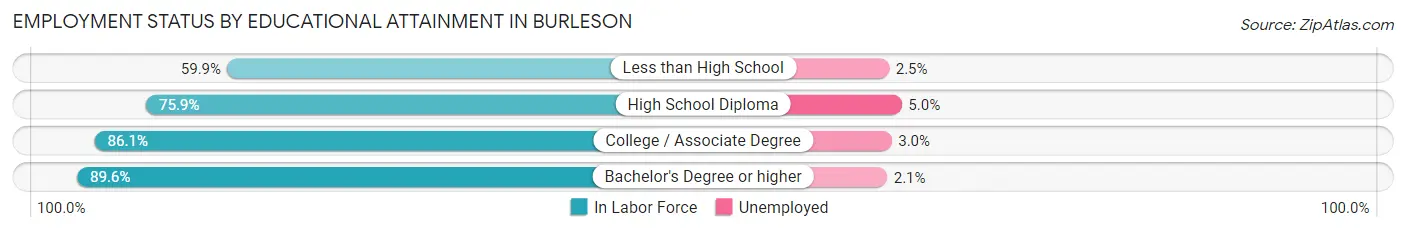
| Educational Attainment | In Labor Force | Unemployed |
| Less than High School | 763 (59.9%) | 32 (2.5%) |
| High School Diploma | 5,154 (75.9%) | 340 (5.0%) |
| College / Associate Degree | 8,071 (86.1%) | 281 (3.0%) |
| Bachelor's Degree or higher | 6,632 (89.6%) | 155 (2.1%) |
| Total | 20,617 (83.0%) | 795 (3.2%) |
Employment Occupations by Sex in Burleson
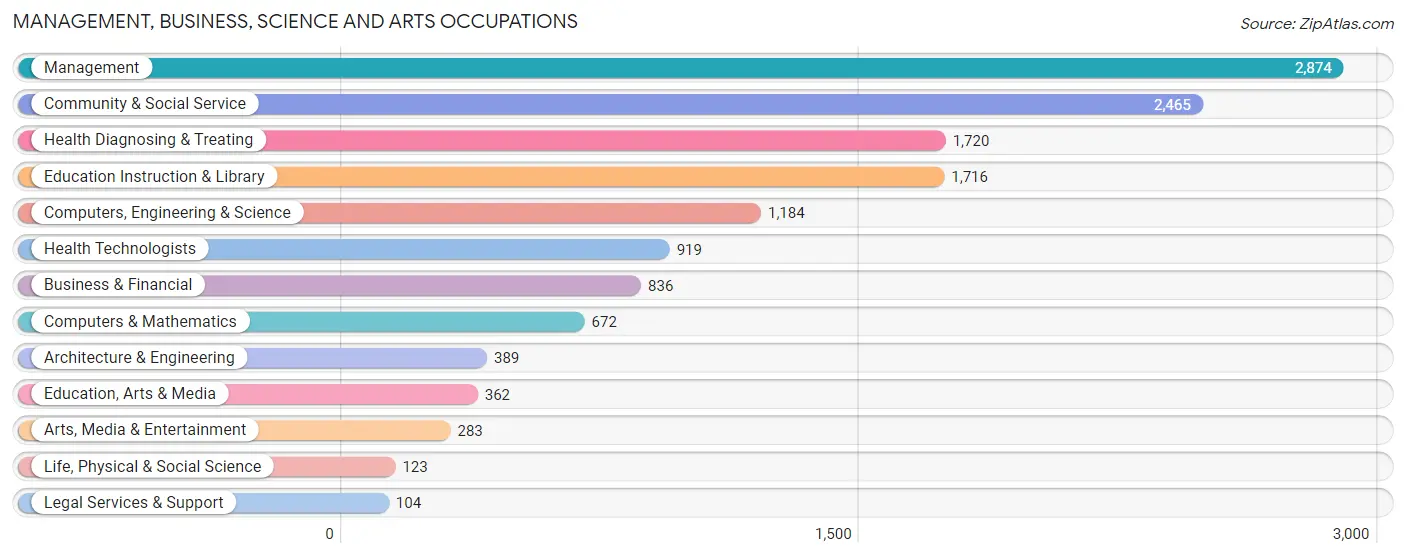
Management, Business, Science and Arts Occupations
The most common Management, Business, Science and Arts occupations in Burleson are Management (2,874 | 11.9%), Community & Social Service (2,465 | 10.2%), Health Diagnosing & Treating (1,720 | 7.1%), Education Instruction & Library (1,716 | 7.1%), and Computers, Engineering & Science (1,184 | 4.9%).
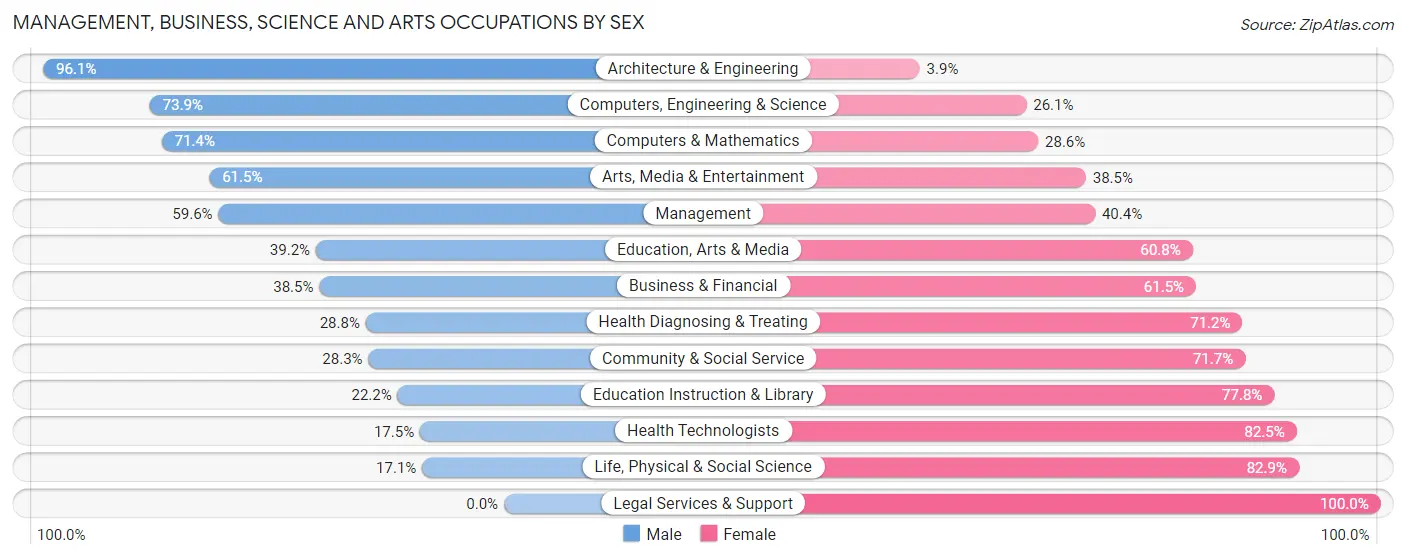
Management, Business, Science and Arts Occupations by Sex
Within the Management, Business, Science and Arts occupations in Burleson, the most male-oriented occupations are Architecture & Engineering (96.1%), Computers, Engineering & Science (73.9%), and Computers & Mathematics (71.4%), while the most female-oriented occupations are Legal Services & Support (100.0%), Life, Physical & Social Science (82.9%), and Health Technologists (82.5%).
| Occupation | Male | Female |
| Management | 1,712 (59.6%) | 1,162 (40.4%) |
| Business & Financial | 322 (38.5%) | 514 (61.5%) |
| Computers, Engineering & Science | 875 (73.9%) | 309 (26.1%) |
| Computers & Mathematics | 480 (71.4%) | 192 (28.6%) |
| Architecture & Engineering | 374 (96.1%) | 15 (3.9%) |
| Life, Physical & Social Science | 21 (17.1%) | 102 (82.9%) |
| Community & Social Service | 697 (28.3%) | 1,768 (71.7%) |
| Education, Arts & Media | 142 (39.2%) | 220 (60.8%) |
| Legal Services & Support | 0 (0.0%) | 104 (100.0%) |
| Education Instruction & Library | 381 (22.2%) | 1,335 (77.8%) |
| Arts, Media & Entertainment | 174 (61.5%) | 109 (38.5%) |
| Health Diagnosing & Treating | 496 (28.8%) | 1,224 (71.2%) |
| Health Technologists | 161 (17.5%) | 758 (82.5%) |
| Total (Category) | 4,102 (45.2%) | 4,977 (54.8%) |
| Total (Overall) | 12,806 (53.1%) | 11,288 (46.9%) |
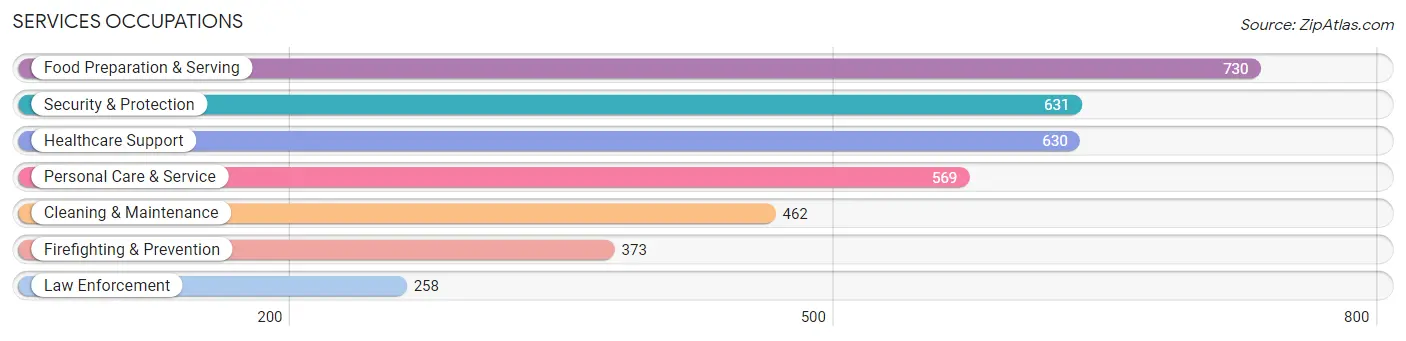
Services Occupations
The most common Services occupations in Burleson are Food Preparation & Serving (730 | 3.0%), Security & Protection (631 | 2.6%), Healthcare Support (630 | 2.6%), Personal Care & Service (569 | 2.4%), and Cleaning & Maintenance (462 | 1.9%).
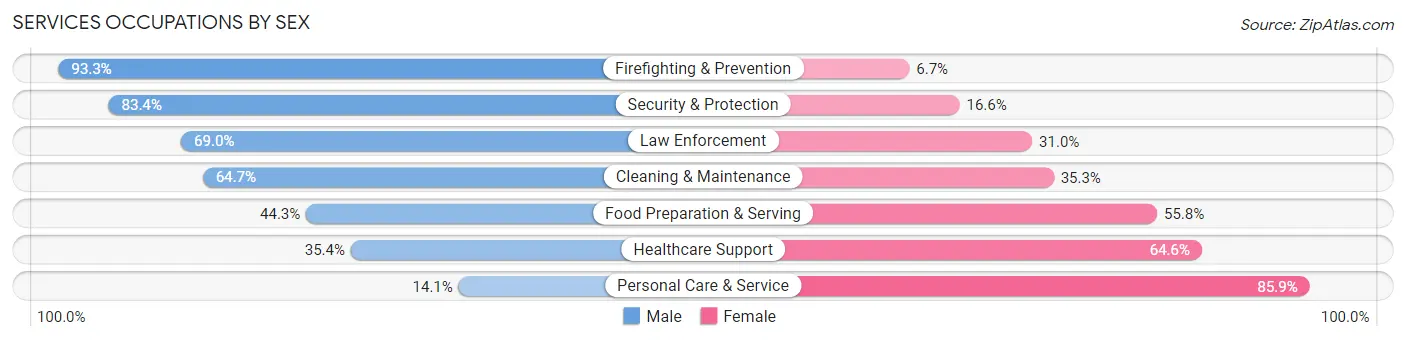
Services Occupations by Sex
Within the Services occupations in Burleson, the most male-oriented occupations are Firefighting & Prevention (93.3%), Security & Protection (83.4%), and Law Enforcement (69.0%), while the most female-oriented occupations are Personal Care & Service (85.9%), Healthcare Support (64.6%), and Food Preparation & Serving (55.7%).
| Occupation | Male | Female |
| Healthcare Support | 223 (35.4%) | 407 (64.6%) |
| Security & Protection | 526 (83.4%) | 105 (16.6%) |
| Firefighting & Prevention | 348 (93.3%) | 25 (6.7%) |
| Law Enforcement | 178 (69.0%) | 80 (31.0%) |
| Food Preparation & Serving | 323 (44.3%) | 407 (55.7%) |
| Cleaning & Maintenance | 299 (64.7%) | 163 (35.3%) |
| Personal Care & Service | 80 (14.1%) | 489 (85.9%) |
| Total (Category) | 1,451 (48.0%) | 1,571 (52.0%) |
| Total (Overall) | 12,806 (53.1%) | 11,288 (46.9%) |
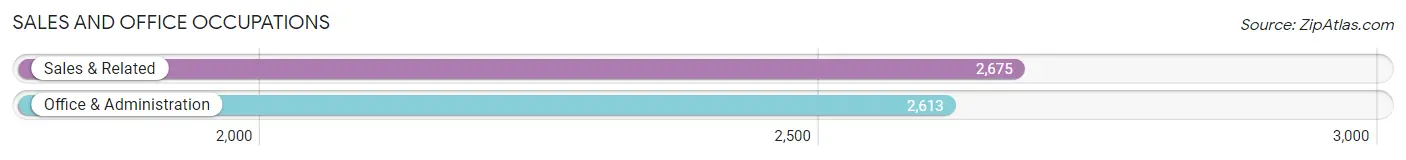
Sales and Office Occupations
The most common Sales and Office occupations in Burleson are Sales & Related (2,675 | 11.1%), and Office & Administration (2,613 | 10.8%).
Sales and Office Occupations by Sex
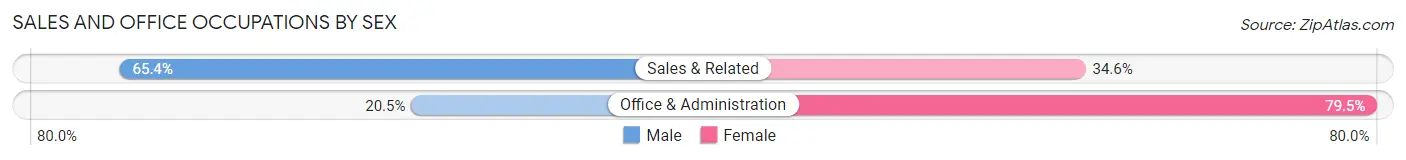
| Occupation | Male | Female |
| Sales & Related | 1,749 (65.4%) | 926 (34.6%) |
| Office & Administration | 536 (20.5%) | 2,077 (79.5%) |
| Total (Category) | 2,285 (43.2%) | 3,003 (56.8%) |
| Total (Overall) | 12,806 (53.1%) | 11,288 (46.9%) |
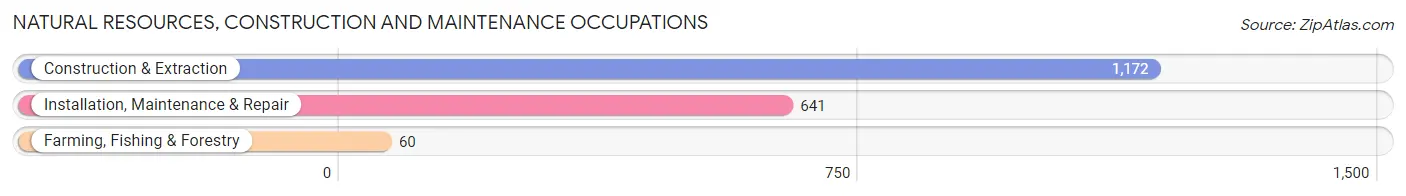
Natural Resources, Construction and Maintenance Occupations
The most common Natural Resources, Construction and Maintenance occupations in Burleson are Construction & Extraction (1,172 | 4.9%), Installation, Maintenance & Repair (641 | 2.7%), and Farming, Fishing & Forestry (60 | 0.3%).
Natural Resources, Construction and Maintenance Occupations by Sex
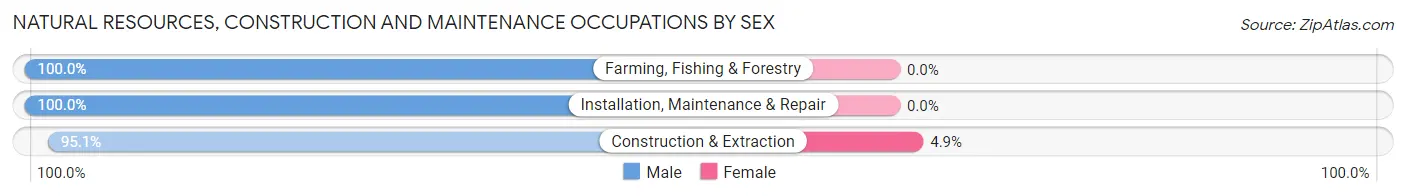
| Occupation | Male | Female |
| Farming, Fishing & Forestry | 60 (100.0%) | 0 (0.0%) |
| Construction & Extraction | 1,115 (95.1%) | 57 (4.9%) |
| Installation, Maintenance & Repair | 641 (100.0%) | 0 (0.0%) |
| Total (Category) | 1,816 (97.0%) | 57 (3.0%) |
| Total (Overall) | 12,806 (53.1%) | 11,288 (46.9%) |
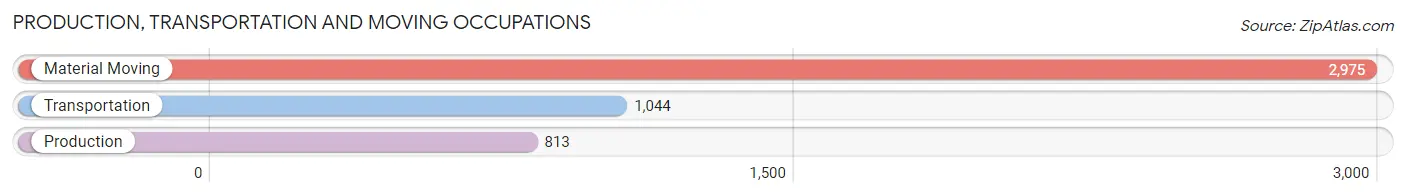
Production, Transportation and Moving Occupations
The most common Production, Transportation and Moving occupations in Burleson are Material Moving (2,975 | 12.3%), Transportation (1,044 | 4.3%), and Production (813 | 3.4%).
Production, Transportation and Moving Occupations by Sex
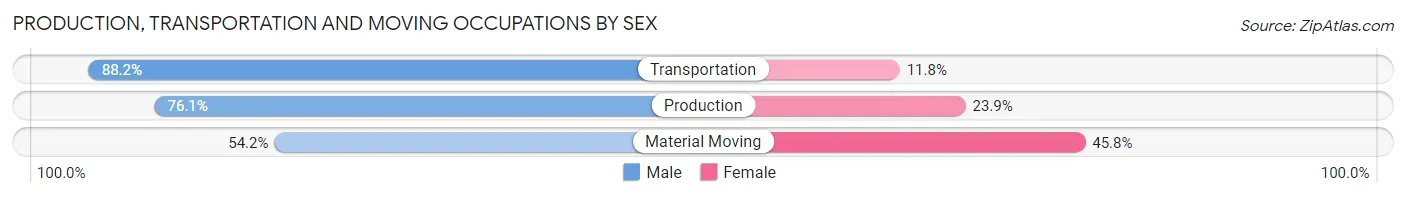
| Occupation | Male | Female |
| Production | 619 (76.1%) | 194 (23.9%) |
| Transportation | 921 (88.2%) | 123 (11.8%) |
| Material Moving | 1,612 (54.2%) | 1,363 (45.8%) |
| Total (Category) | 3,152 (65.2%) | 1,680 (34.8%) |
| Total (Overall) | 12,806 (53.1%) | 11,288 (46.9%) |
Employment Industries by Sex in Burleson
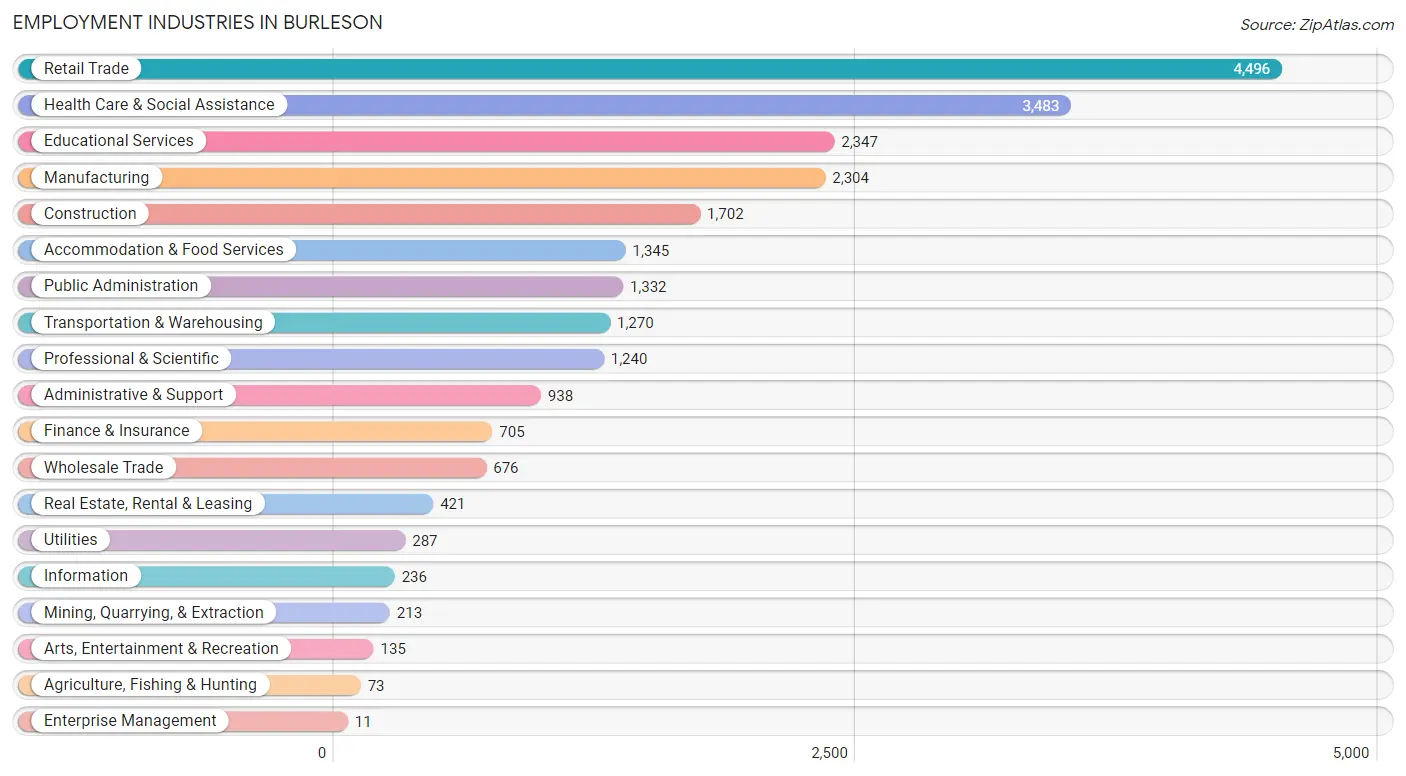
Employment Industries in Burleson
The major employment industries in Burleson include Retail Trade (4,496 | 18.7%), Health Care & Social Assistance (3,483 | 14.5%), Educational Services (2,347 | 9.7%), Manufacturing (2,304 | 9.6%), and Construction (1,702 | 7.1%).
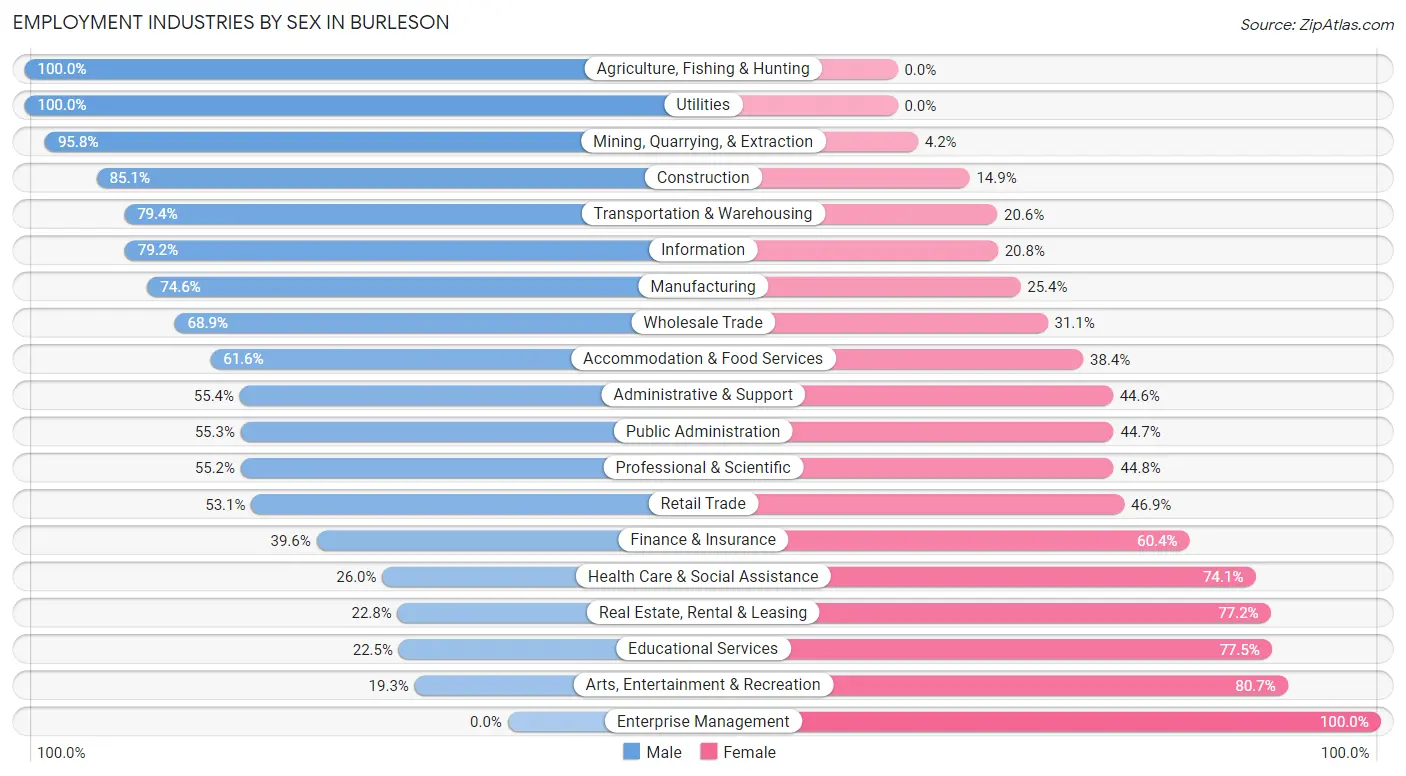
Employment Industries by Sex in Burleson
The Burleson industries that see more men than women are Agriculture, Fishing & Hunting (100.0%), Utilities (100.0%), and Mining, Quarrying, & Extraction (95.8%), whereas the industries that tend to have a higher number of women are Enterprise Management (100.0%), Arts, Entertainment & Recreation (80.7%), and Educational Services (77.5%).
| Industry | Male | Female |
| Agriculture, Fishing & Hunting | 73 (100.0%) | 0 (0.0%) |
| Mining, Quarrying, & Extraction | 204 (95.8%) | 9 (4.2%) |
| Construction | 1,448 (85.1%) | 254 (14.9%) |
| Manufacturing | 1,718 (74.6%) | 586 (25.4%) |
| Wholesale Trade | 466 (68.9%) | 210 (31.1%) |
| Retail Trade | 2,386 (53.1%) | 2,110 (46.9%) |
| Transportation & Warehousing | 1,008 (79.4%) | 262 (20.6%) |
| Utilities | 287 (100.0%) | 0 (0.0%) |
| Information | 187 (79.2%) | 49 (20.8%) |
| Finance & Insurance | 279 (39.6%) | 426 (60.4%) |
| Real Estate, Rental & Leasing | 96 (22.8%) | 325 (77.2%) |
| Professional & Scientific | 685 (55.2%) | 555 (44.8%) |
| Enterprise Management | 0 (0.0%) | 11 (100.0%) |
| Administrative & Support | 520 (55.4%) | 418 (44.6%) |
| Educational Services | 529 (22.5%) | 1,818 (77.5%) |
| Health Care & Social Assistance | 904 (26.0%) | 2,579 (74.1%) |
| Arts, Entertainment & Recreation | 26 (19.3%) | 109 (80.7%) |
| Accommodation & Food Services | 828 (61.6%) | 517 (38.4%) |
| Public Administration | 736 (55.3%) | 596 (44.7%) |
| Total | 12,806 (53.1%) | 11,288 (46.9%) |
Education in Burleson
School Enrollment in Burleson
The most common levels of schooling among the 11,834 students in Burleson are middle school (3,122 | 26.4%), high school (2,980 | 25.2%), and elementary school (2,922 | 24.7%).
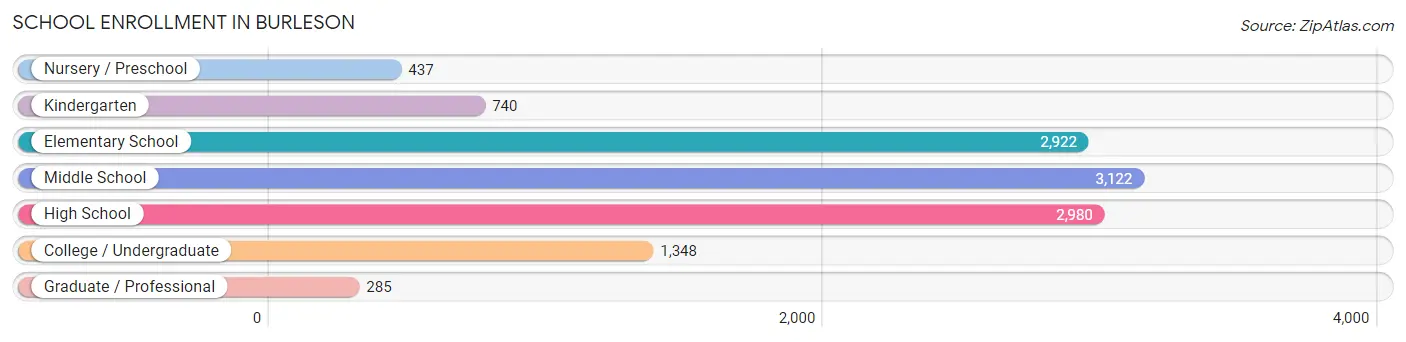
| School Level | # Students | % Students |
| Nursery / Preschool | 437 | 3.7% |
| Kindergarten | 740 | 6.2% |
| Elementary School | 2,922 | 24.7% |
| Middle School | 3,122 | 26.4% |
| High School | 2,980 | 25.2% |
| College / Undergraduate | 1,348 | 11.4% |
| Graduate / Professional | 285 | 2.4% |
| Total | 11,834 | 100.0% |
School Enrollment by Age by Funding Source in Burleson
Out of a total of 11,834 students who are enrolled in schools in Burleson, 1,077 (9.1%) attend a private institution, while the remaining 10,757 (90.9%) are enrolled in public schools. The age group of 3 to 4 year olds has the highest likelihood of being enrolled in private schools, with 185 (58.7% in the age bracket) enrolled. Conversely, the age group of 15 to 17 year olds has the lowest likelihood of being enrolled in a private school, with 2,055 (96.3% in the age bracket) attending a public institution.
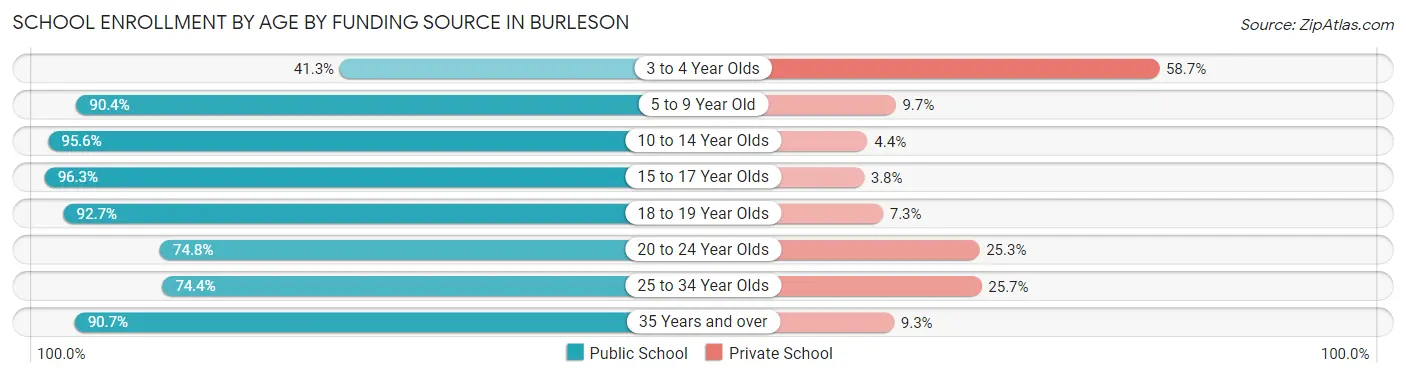
| Age Bracket | Public School | Private School |
| 3 to 4 Year Olds | 130 (41.3%) | 185 (58.7%) |
| 5 to 9 Year Old | 3,182 (90.3%) | 340 (9.7%) |
| 10 to 14 Year Olds | 3,677 (95.6%) | 170 (4.4%) |
| 15 to 17 Year Olds | 2,055 (96.3%) | 80 (3.7%) |
| 18 to 19 Year Olds | 611 (92.7%) | 48 (7.3%) |
| 20 to 24 Year Olds | 367 (74.8%) | 124 (25.3%) |
| 25 to 34 Year Olds | 229 (74.4%) | 79 (25.7%) |
| 35 Years and over | 505 (90.7%) | 52 (9.3%) |
| Total | 10,757 (90.9%) | 1,077 (9.1%) |
Educational Attainment by Field of Study in Burleson
Business (2,325 | 24.1%), education (1,553 | 16.1%), arts & humanities (977 | 10.1%), science & technology (968 | 10.0%), and social sciences (693 | 7.2%) are the most common fields of study among 9,654 individuals in Burleson who have obtained a bachelor's degree or higher.
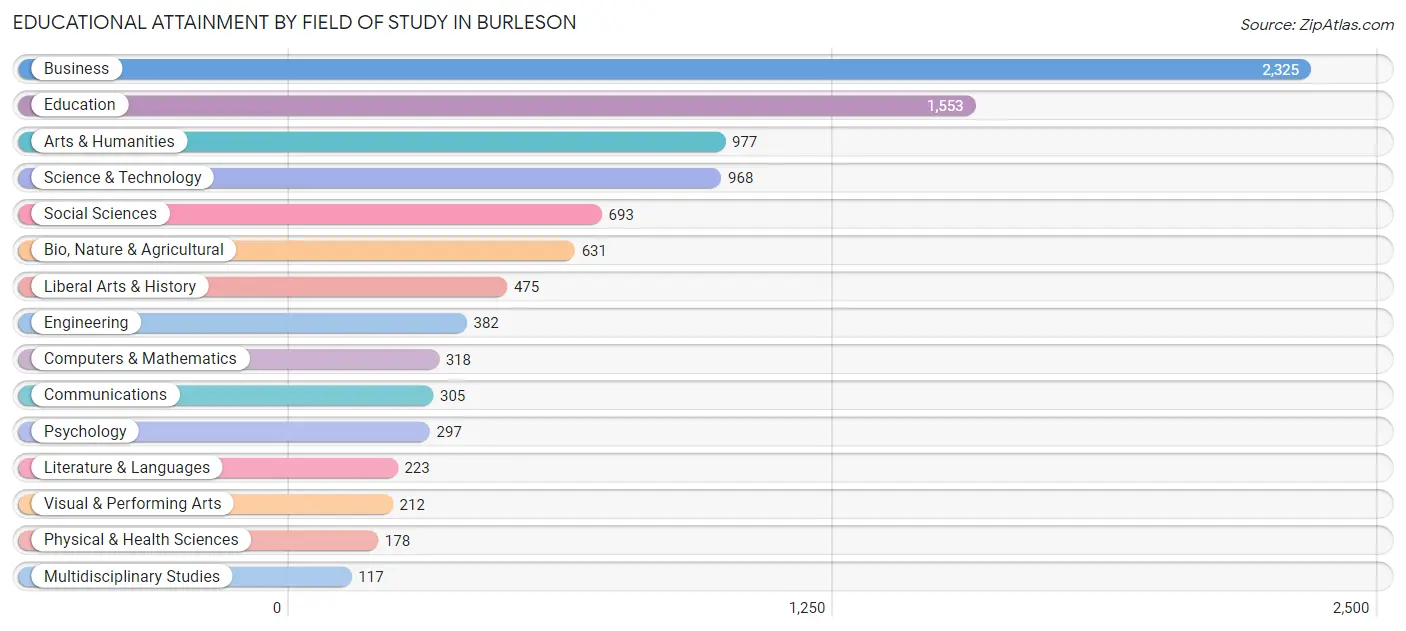
| Field of Study | # Graduates | % Graduates |
| Computers & Mathematics | 318 | 3.3% |
| Bio, Nature & Agricultural | 631 | 6.5% |
| Physical & Health Sciences | 178 | 1.8% |
| Psychology | 297 | 3.1% |
| Social Sciences | 693 | 7.2% |
| Engineering | 382 | 4.0% |
| Multidisciplinary Studies | 117 | 1.2% |
| Science & Technology | 968 | 10.0% |
| Business | 2,325 | 24.1% |
| Education | 1,553 | 16.1% |
| Literature & Languages | 223 | 2.3% |
| Liberal Arts & History | 475 | 4.9% |
| Visual & Performing Arts | 212 | 2.2% |
| Communications | 305 | 3.2% |
| Arts & Humanities | 977 | 10.1% |
| Total | 9,654 | 100.0% |
Transportation & Commute in Burleson
Vehicle Availability by Sex in Burleson
The most prevalent vehicle ownership categories in Burleson are males with 2 vehicles (7,690, accounting for 60.0%) and females with 2 vehicles (5,833, making up 69.7%).
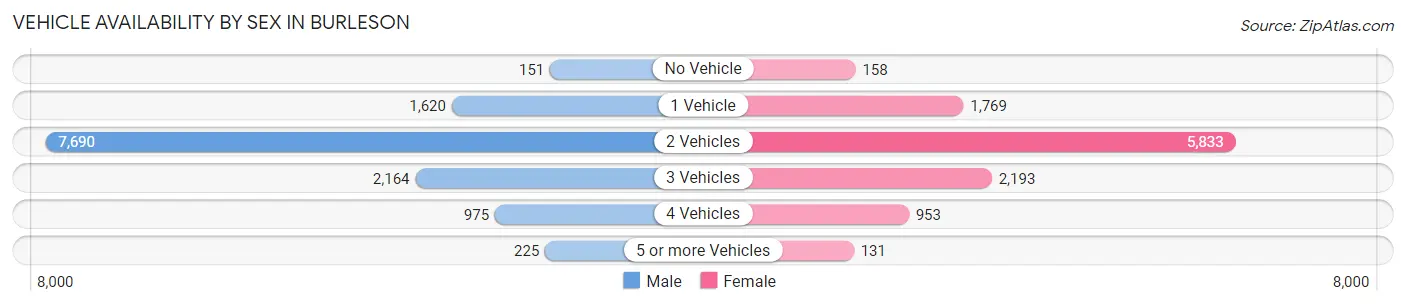
| Vehicles Available | Male | Female |
| No Vehicle | 151 (1.2%) | 158 (1.4%) |
| 1 Vehicle | 1,620 (12.6%) | 1,769 (16.0%) |
| 2 Vehicles | 7,690 (60.0%) | 5,833 (52.8%) |
| 3 Vehicles | 2,164 (16.9%) | 2,193 (19.9%) |
| 4 Vehicles | 975 (7.6%) | 953 (8.6%) |
| 5 or more Vehicles | 225 (1.8%) | 131 (1.2%) |
| Total | 12,825 (100.0%) | 11,037 (100.0%) |
Commute Time in Burleson
The most frequently occuring commute durations in Burleson are 30 to 34 minutes (4,909 commuters, 22.2%), 20 to 24 minutes (3,164 commuters, 14.3%), and 45 to 59 minutes (2,497 commuters, 11.3%).
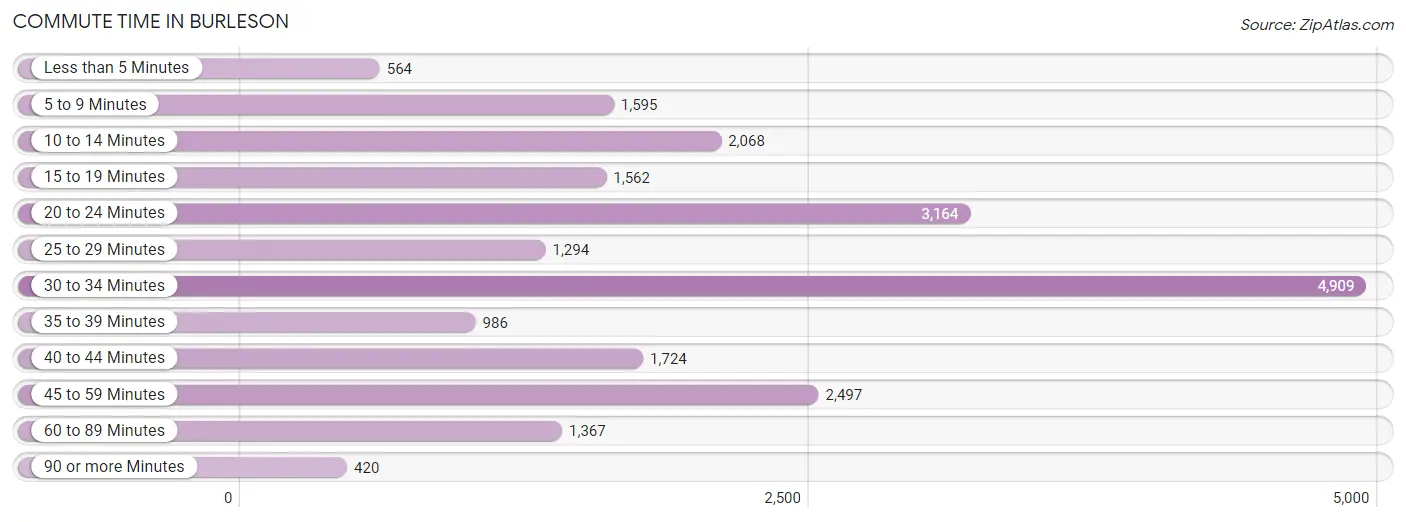
| Commute Time | # Commuters | % Commuters |
| Less than 5 Minutes | 564 | 2.5% |
| 5 to 9 Minutes | 1,595 | 7.2% |
| 10 to 14 Minutes | 2,068 | 9.3% |
| 15 to 19 Minutes | 1,562 | 7.0% |
| 20 to 24 Minutes | 3,164 | 14.3% |
| 25 to 29 Minutes | 1,294 | 5.8% |
| 30 to 34 Minutes | 4,909 | 22.2% |
| 35 to 39 Minutes | 986 | 4.4% |
| 40 to 44 Minutes | 1,724 | 7.8% |
| 45 to 59 Minutes | 2,497 | 11.3% |
| 60 to 89 Minutes | 1,367 | 6.2% |
| 90 or more Minutes | 420 | 1.9% |
Commute Time by Sex in Burleson
The most common commute times in Burleson are 30 to 34 minutes (2,585 commuters, 21.4%) for males and 30 to 34 minutes (2,324 commuters, 23.1%) for females.
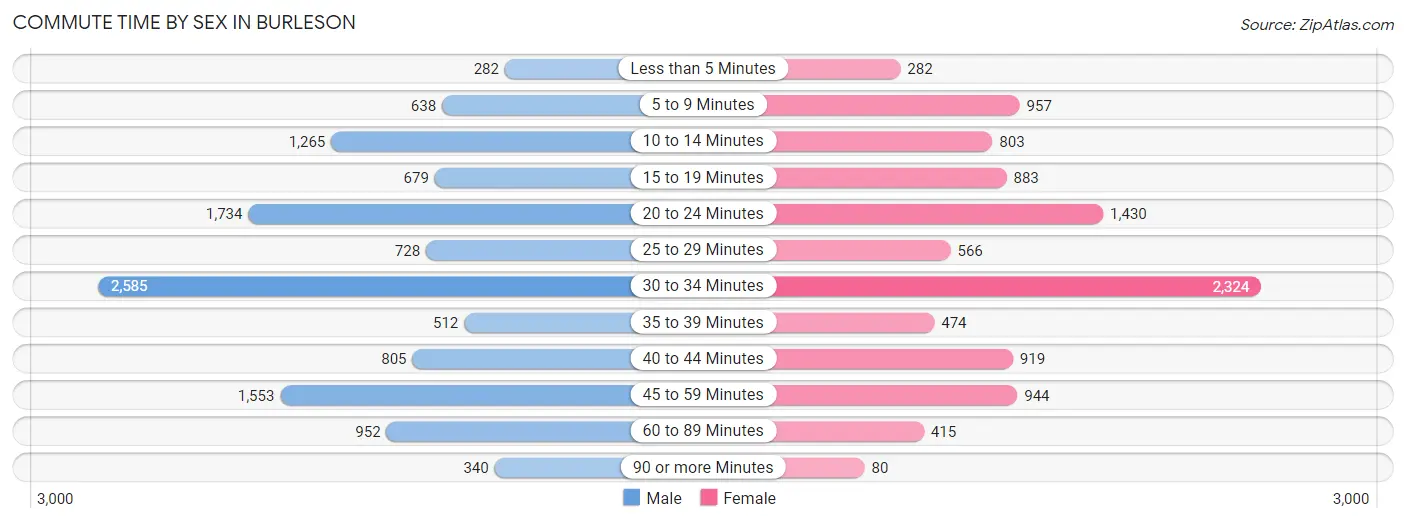
| Commute Time | Male | Female |
| Less than 5 Minutes | 282 (2.3%) | 282 (2.8%) |
| 5 to 9 Minutes | 638 (5.3%) | 957 (9.5%) |
| 10 to 14 Minutes | 1,265 (10.5%) | 803 (8.0%) |
| 15 to 19 Minutes | 679 (5.6%) | 883 (8.8%) |
| 20 to 24 Minutes | 1,734 (14.4%) | 1,430 (14.2%) |
| 25 to 29 Minutes | 728 (6.0%) | 566 (5.6%) |
| 30 to 34 Minutes | 2,585 (21.4%) | 2,324 (23.1%) |
| 35 to 39 Minutes | 512 (4.2%) | 474 (4.7%) |
| 40 to 44 Minutes | 805 (6.7%) | 919 (9.1%) |
| 45 to 59 Minutes | 1,553 (12.9%) | 944 (9.4%) |
| 60 to 89 Minutes | 952 (7.9%) | 415 (4.1%) |
| 90 or more Minutes | 340 (2.8%) | 80 (0.8%) |
Time of Departure to Work by Sex in Burleson
The most frequent times of departure to work in Burleson are 7:00 AM to 7:29 AM (2,758, 22.8%) for males and 7:30 AM to 7:59 AM (2,222, 22.1%) for females.
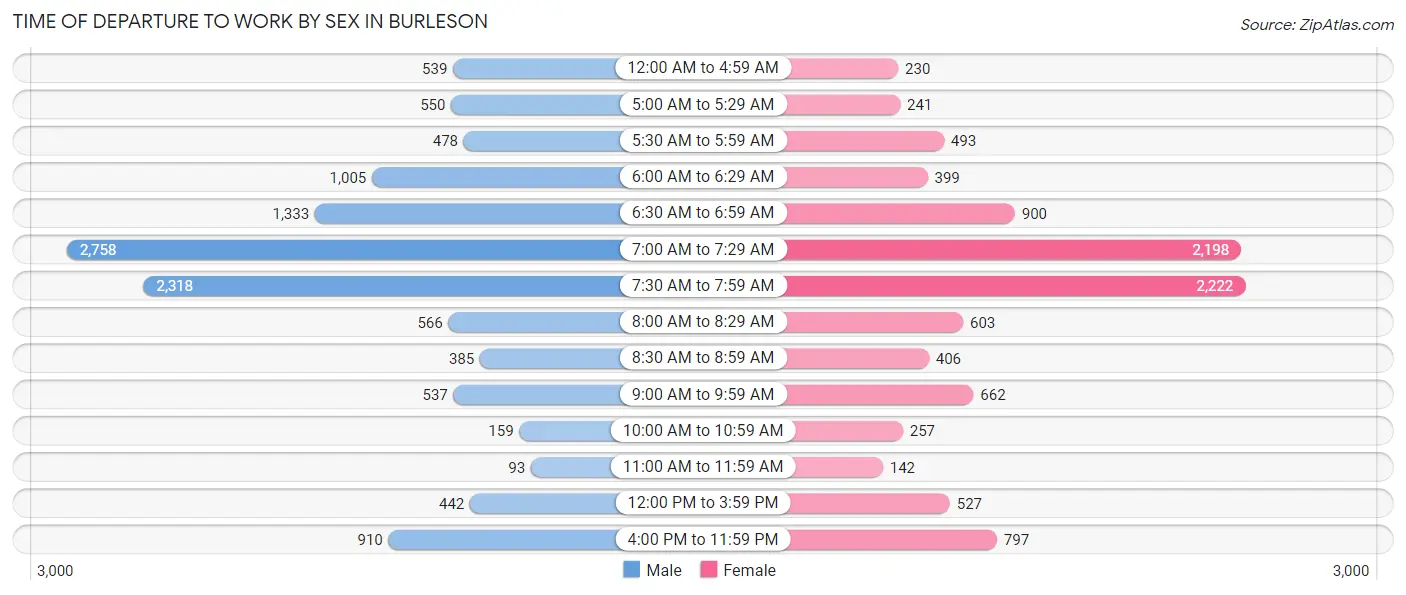
| Time of Departure | Male | Female |
| 12:00 AM to 4:59 AM | 539 (4.5%) | 230 (2.3%) |
| 5:00 AM to 5:29 AM | 550 (4.6%) | 241 (2.4%) |
| 5:30 AM to 5:59 AM | 478 (4.0%) | 493 (4.9%) |
| 6:00 AM to 6:29 AM | 1,005 (8.3%) | 399 (4.0%) |
| 6:30 AM to 6:59 AM | 1,333 (11.0%) | 900 (8.9%) |
| 7:00 AM to 7:29 AM | 2,758 (22.8%) | 2,198 (21.8%) |
| 7:30 AM to 7:59 AM | 2,318 (19.2%) | 2,222 (22.1%) |
| 8:00 AM to 8:29 AM | 566 (4.7%) | 603 (6.0%) |
| 8:30 AM to 8:59 AM | 385 (3.2%) | 406 (4.0%) |
| 9:00 AM to 9:59 AM | 537 (4.4%) | 662 (6.6%) |
| 10:00 AM to 10:59 AM | 159 (1.3%) | 257 (2.5%) |
| 11:00 AM to 11:59 AM | 93 (0.8%) | 142 (1.4%) |
| 12:00 PM to 3:59 PM | 442 (3.7%) | 527 (5.2%) |
| 4:00 PM to 11:59 PM | 910 (7.5%) | 797 (7.9%) |
| Total | 12,073 (100.0%) | 10,077 (100.0%) |
Housing Occupancy in Burleson
Occupancy by Ownership in Burleson
Of the total 16,998 dwellings in Burleson, owner-occupied units account for 11,889 (69.9%), while renter-occupied units make up 5,109 (30.1%).
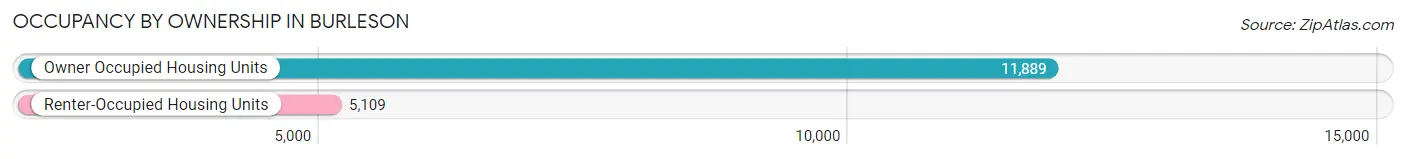
| Occupancy | # Housing Units | % Housing Units |
| Owner Occupied Housing Units | 11,889 | 69.9% |
| Renter-Occupied Housing Units | 5,109 | 30.1% |
| Total Occupied Housing Units | 16,998 | 100.0% |
Occupancy by Household Size in Burleson
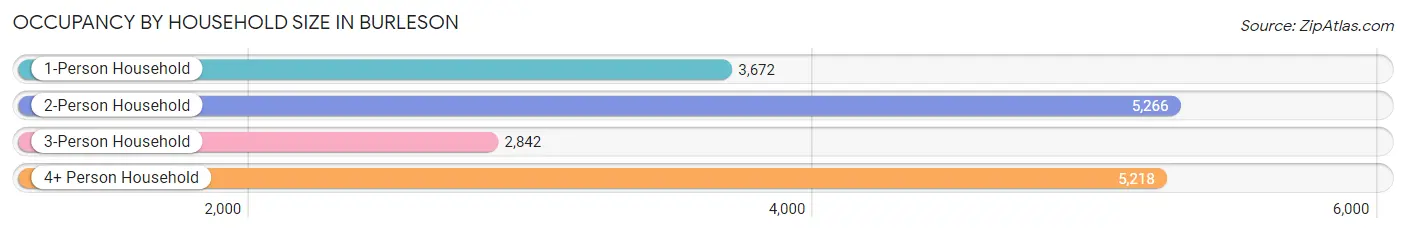
| Household Size | # Housing Units | % Housing Units |
| 1-Person Household | 3,672 | 21.6% |
| 2-Person Household | 5,266 | 31.0% |
| 3-Person Household | 2,842 | 16.7% |
| 4+ Person Household | 5,218 | 30.7% |
| Total Housing Units | 16,998 | 100.0% |
Occupancy by Ownership by Household Size in Burleson
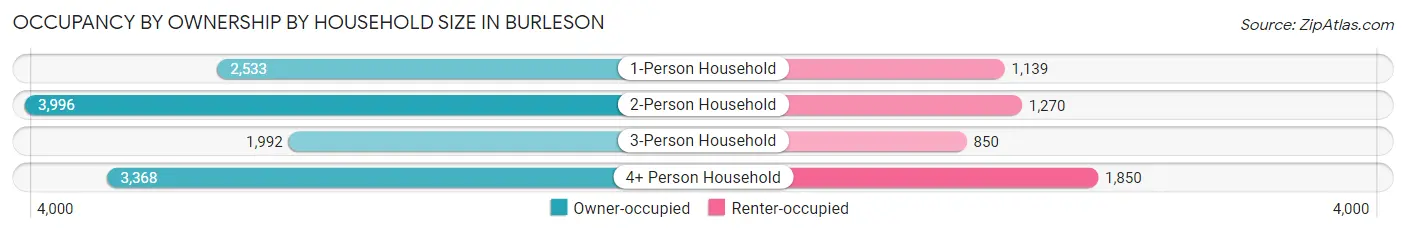
| Household Size | Owner-occupied | Renter-occupied |
| 1-Person Household | 2,533 (69.0%) | 1,139 (31.0%) |
| 2-Person Household | 3,996 (75.9%) | 1,270 (24.1%) |
| 3-Person Household | 1,992 (70.1%) | 850 (29.9%) |
| 4+ Person Household | 3,368 (64.5%) | 1,850 (35.4%) |
| Total Housing Units | 11,889 (69.9%) | 5,109 (30.1%) |
Occupancy by Educational Attainment in Burleson
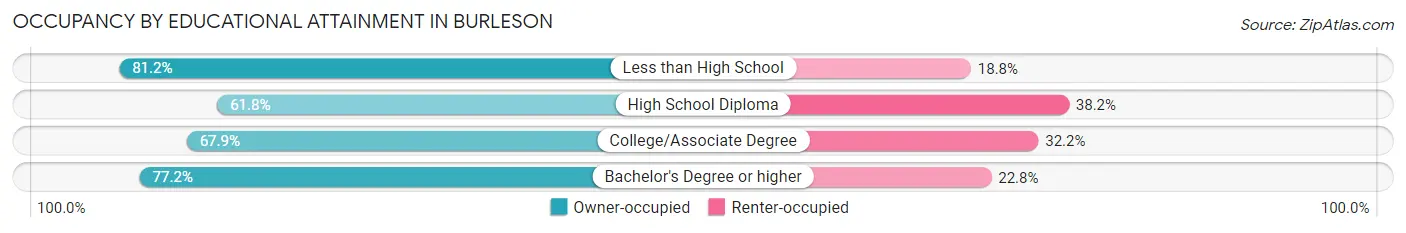
| Household Size | Owner-occupied | Renter-occupied |
| Less than High School | 675 (81.2%) | 156 (18.8%) |
| High School Diploma | 2,665 (61.8%) | 1,647 (38.2%) |
| College/Associate Degree | 4,366 (67.8%) | 2,069 (32.2%) |
| Bachelor's Degree or higher | 4,183 (77.2%) | 1,237 (22.8%) |
Occupancy by Age of Householder in Burleson
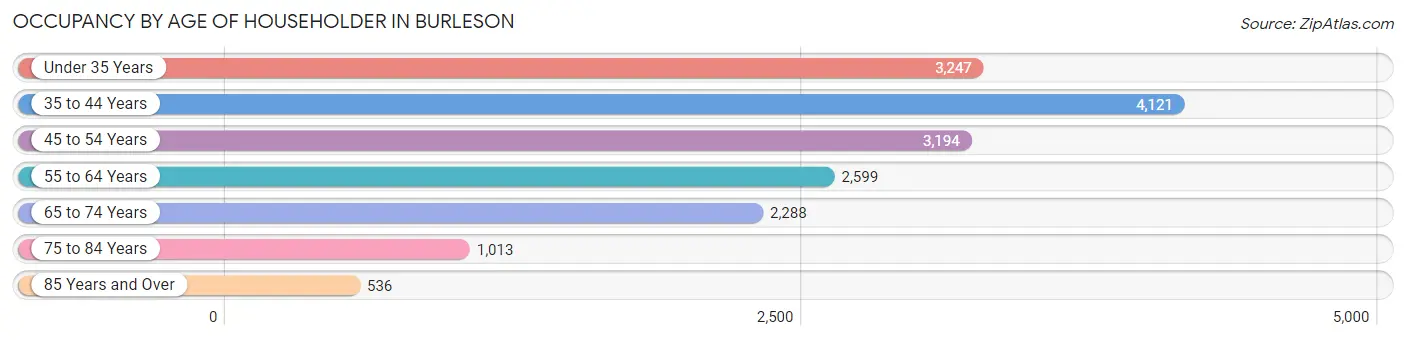
| Age Bracket | # Households | % Households |
| Under 35 Years | 3,247 | 19.1% |
| 35 to 44 Years | 4,121 | 24.2% |
| 45 to 54 Years | 3,194 | 18.8% |
| 55 to 64 Years | 2,599 | 15.3% |
| 65 to 74 Years | 2,288 | 13.5% |
| 75 to 84 Years | 1,013 | 6.0% |
| 85 Years and Over | 536 | 3.2% |
| Total | 16,998 | 100.0% |
Housing Finances in Burleson
Median Income by Occupancy in Burleson
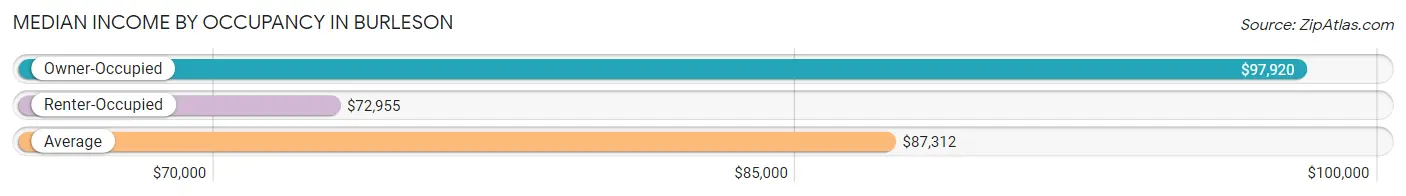
| Occupancy Type | # Households | Median Income |
| Owner-Occupied | 11,889 (69.9%) | $97,920 |
| Renter-Occupied | 5,109 (30.1%) | $72,955 |
| Average | 16,998 (100.0%) | $87,312 |
Occupancy by Householder Income Bracket in Burleson
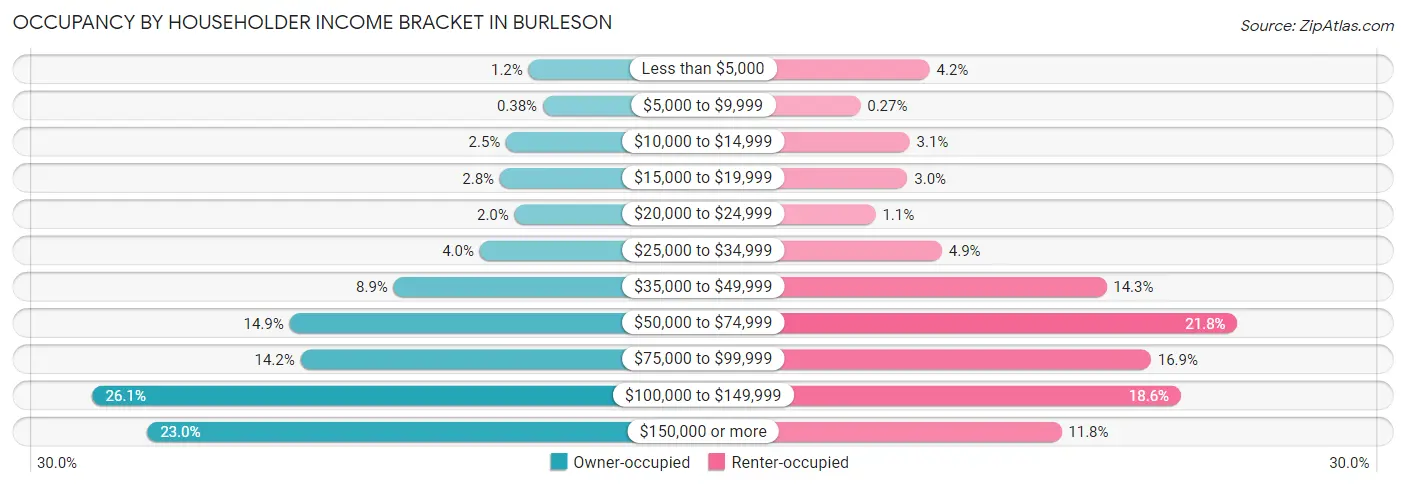
| Income Bracket | Owner-occupied | Renter-occupied |
| Less than $5,000 | 143 (1.2%) | 216 (4.2%) |
| $5,000 to $9,999 | 45 (0.4%) | 14 (0.3%) |
| $10,000 to $14,999 | 295 (2.5%) | 158 (3.1%) |
| $15,000 to $19,999 | 338 (2.8%) | 151 (3.0%) |
| $20,000 to $24,999 | 238 (2.0%) | 58 (1.1%) |
| $25,000 to $34,999 | 474 (4.0%) | 252 (4.9%) |
| $35,000 to $49,999 | 1,059 (8.9%) | 732 (14.3%) |
| $50,000 to $74,999 | 1,767 (14.9%) | 1,115 (21.8%) |
| $75,000 to $99,999 | 1,692 (14.2%) | 862 (16.9%) |
| $100,000 to $149,999 | 3,105 (26.1%) | 950 (18.6%) |
| $150,000 or more | 2,733 (23.0%) | 601 (11.8%) |
| Total | 11,889 (100.0%) | 5,109 (100.0%) |
Monthly Housing Cost Tiers in Burleson
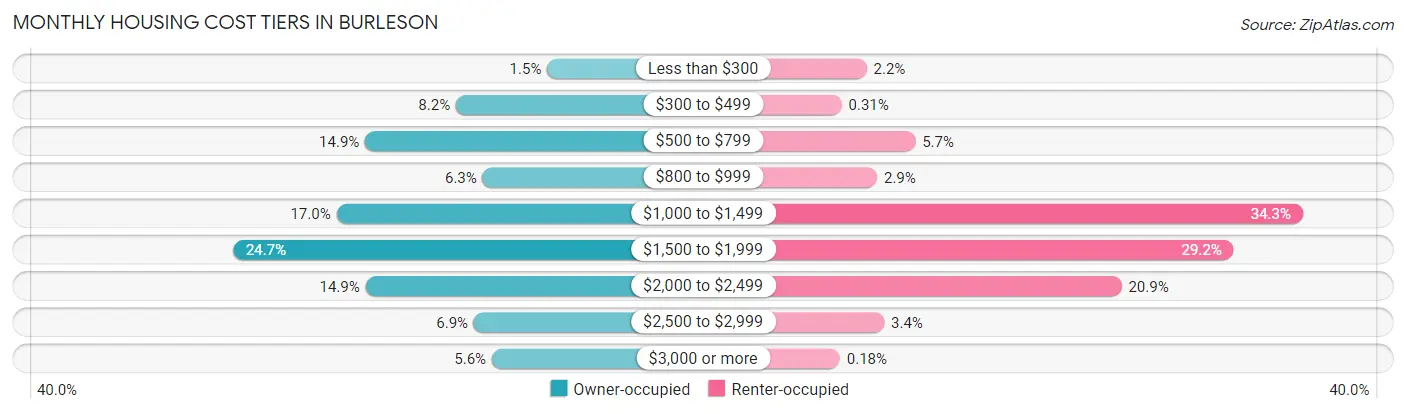
| Monthly Cost | Owner-occupied | Renter-occupied |
| Less than $300 | 180 (1.5%) | 110 (2.1%) |
| $300 to $499 | 978 (8.2%) | 16 (0.3%) |
| $500 to $799 | 1,774 (14.9%) | 293 (5.7%) |
| $800 to $999 | 745 (6.3%) | 149 (2.9%) |
| $1,000 to $1,499 | 2,025 (17.0%) | 1,751 (34.3%) |
| $1,500 to $1,999 | 2,933 (24.7%) | 1,491 (29.2%) |
| $2,000 to $2,499 | 1,770 (14.9%) | 1,069 (20.9%) |
| $2,500 to $2,999 | 821 (6.9%) | 176 (3.4%) |
| $3,000 or more | 663 (5.6%) | 9 (0.2%) |
| Total | 11,889 (100.0%) | 5,109 (100.0%) |
Physical Housing Characteristics in Burleson
Housing Structures in Burleson
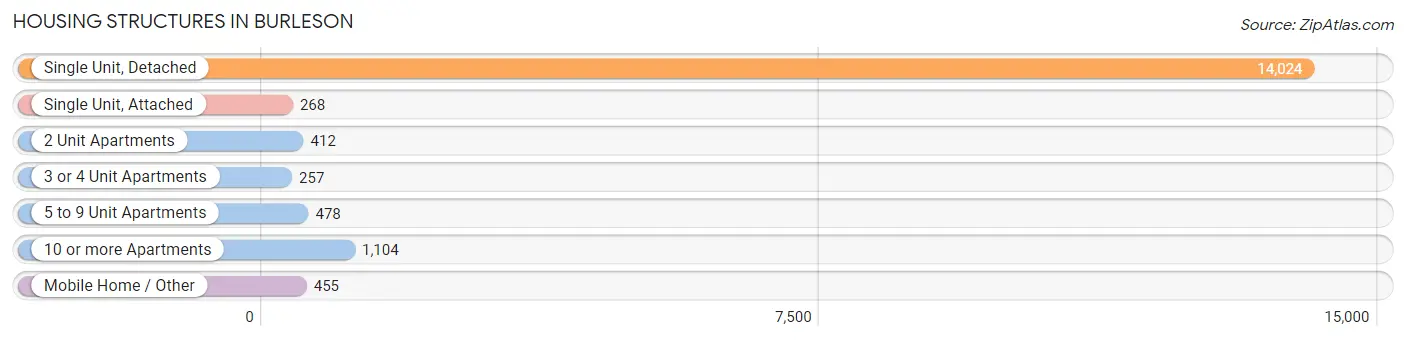
| Structure Type | # Housing Units | % Housing Units |
| Single Unit, Detached | 14,024 | 82.5% |
| Single Unit, Attached | 268 | 1.6% |
| 2 Unit Apartments | 412 | 2.4% |
| 3 or 4 Unit Apartments | 257 | 1.5% |
| 5 to 9 Unit Apartments | 478 | 2.8% |
| 10 or more Apartments | 1,104 | 6.5% |
| Mobile Home / Other | 455 | 2.7% |
| Total | 16,998 | 100.0% |
Housing Structures by Occupancy in Burleson
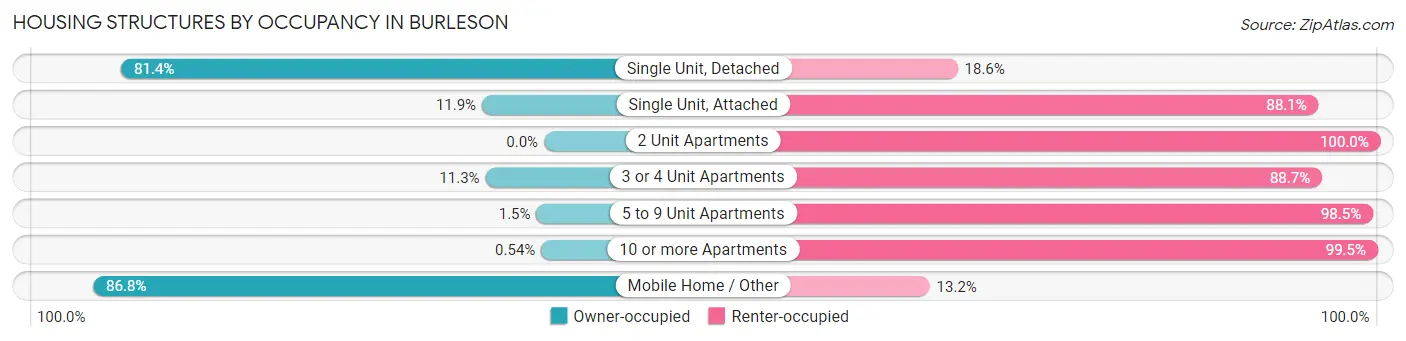
| Structure Type | Owner-occupied | Renter-occupied |
| Single Unit, Detached | 11,420 (81.4%) | 2,604 (18.6%) |
| Single Unit, Attached | 32 (11.9%) | 236 (88.1%) |
| 2 Unit Apartments | 0 (0.0%) | 412 (100.0%) |
| 3 or 4 Unit Apartments | 29 (11.3%) | 228 (88.7%) |
| 5 to 9 Unit Apartments | 7 (1.5%) | 471 (98.5%) |
| 10 or more Apartments | 6 (0.5%) | 1,098 (99.5%) |
| Mobile Home / Other | 395 (86.8%) | 60 (13.2%) |
| Total | 11,889 (69.9%) | 5,109 (30.1%) |
Housing Structures by Number of Rooms in Burleson
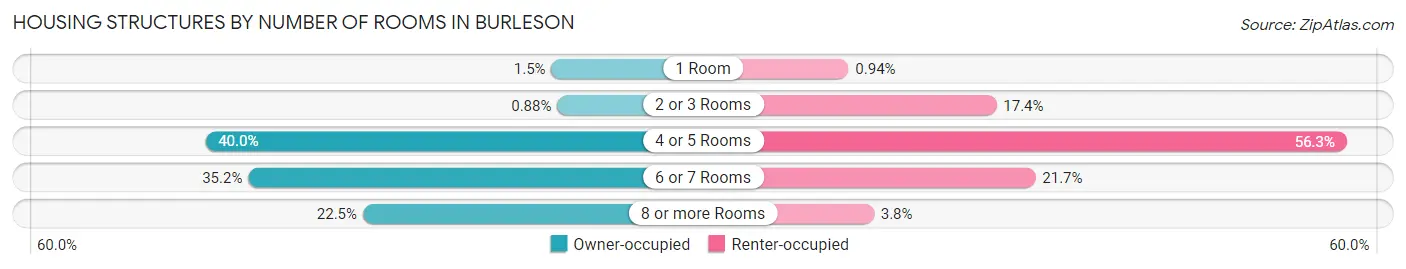
| Number of Rooms | Owner-occupied | Renter-occupied |
| 1 Room | 182 (1.5%) | 48 (0.9%) |
| 2 or 3 Rooms | 105 (0.9%) | 887 (17.4%) |
| 4 or 5 Rooms | 4,750 (40.0%) | 2,874 (56.2%) |
| 6 or 7 Rooms | 4,182 (35.2%) | 1,108 (21.7%) |
| 8 or more Rooms | 2,670 (22.5%) | 192 (3.8%) |
| Total | 11,889 (100.0%) | 5,109 (100.0%) |
Housing Structure by Heating Type in Burleson
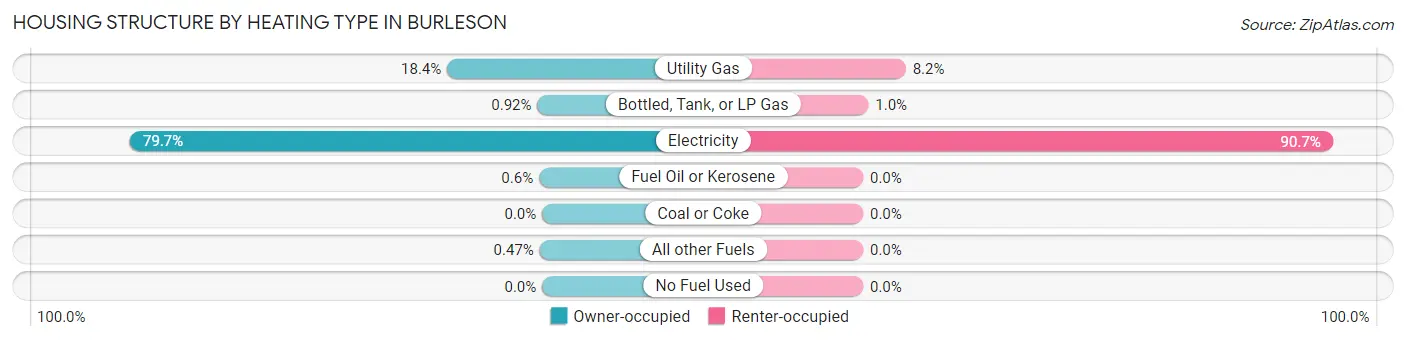
| Heating Type | Owner-occupied | Renter-occupied |
| Utility Gas | 2,183 (18.4%) | 421 (8.2%) |
| Bottled, Tank, or LP Gas | 109 (0.9%) | 52 (1.0%) |
| Electricity | 9,470 (79.6%) | 4,636 (90.7%) |
| Fuel Oil or Kerosene | 71 (0.6%) | 0 (0.0%) |
| Coal or Coke | 0 (0.0%) | 0 (0.0%) |
| All other Fuels | 56 (0.5%) | 0 (0.0%) |
| No Fuel Used | 0 (0.0%) | 0 (0.0%) |
| Total | 11,889 (100.0%) | 5,109 (100.0%) |
Household Vehicle Usage in Burleson
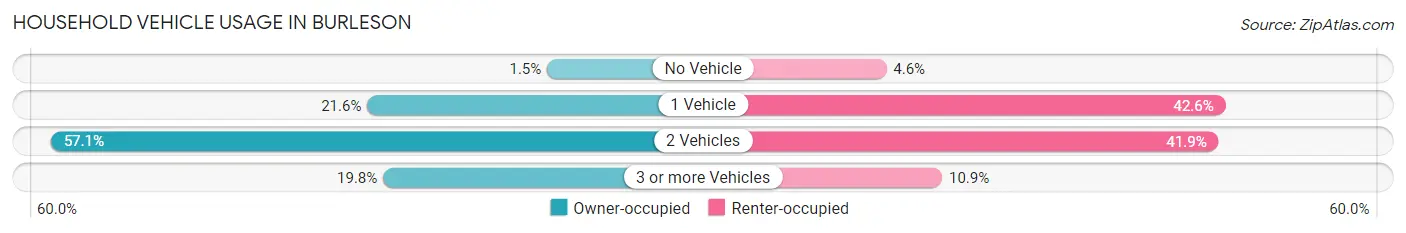
| Vehicles per Household | Owner-occupied | Renter-occupied |
| No Vehicle | 175 (1.5%) | 237 (4.6%) |
| 1 Vehicle | 2,570 (21.6%) | 2,178 (42.6%) |
| 2 Vehicles | 6,785 (57.1%) | 2,138 (41.8%) |
| 3 or more Vehicles | 2,359 (19.8%) | 556 (10.9%) |
| Total | 11,889 (100.0%) | 5,109 (100.0%) |
Real Estate & Mortgages in Burleson
Real Estate and Mortgage Overview in Burleson
| Characteristic | Without Mortgage | With Mortgage |
| Housing Units | 3,987 | 7,902 |
| Median Property Value | $231,600 | $270,800 |
| Median Household Income | $69,206 | $2,140 |
| Monthly Housing Costs | $648 | $663 |
| Real Estate Taxes | $3,291 | $178 |
Property Value by Mortgage Status in Burleson
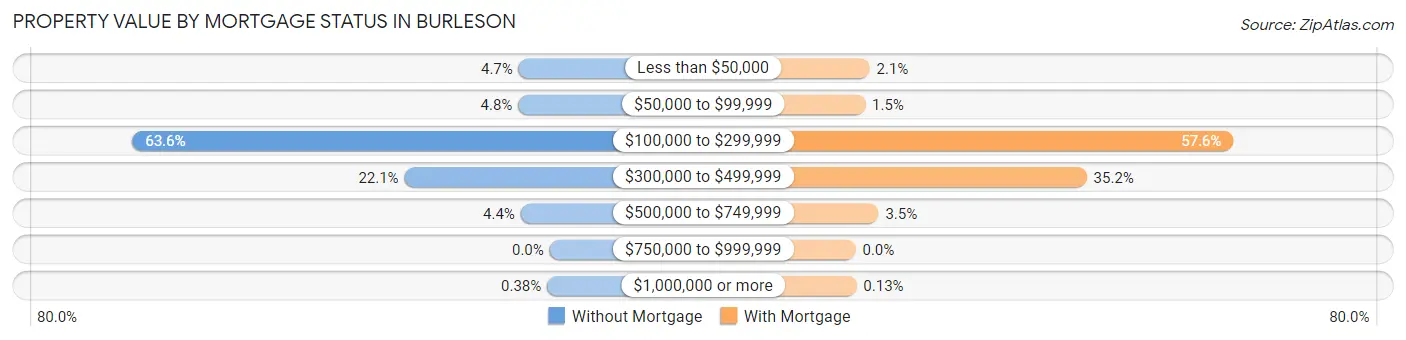
| Property Value | Without Mortgage | With Mortgage |
| Less than $50,000 | 188 (4.7%) | 169 (2.1%) |
| $50,000 to $99,999 | 191 (4.8%) | 115 (1.5%) |
| $100,000 to $299,999 | 2,535 (63.6%) | 4,549 (57.6%) |
| $300,000 to $499,999 | 882 (22.1%) | 2,783 (35.2%) |
| $500,000 to $749,999 | 176 (4.4%) | 276 (3.5%) |
| $750,000 to $999,999 | 0 (0.0%) | 0 (0.0%) |
| $1,000,000 or more | 15 (0.4%) | 10 (0.1%) |
| Total | 3,987 (100.0%) | 7,902 (100.0%) |
Household Income by Mortgage Status in Burleson
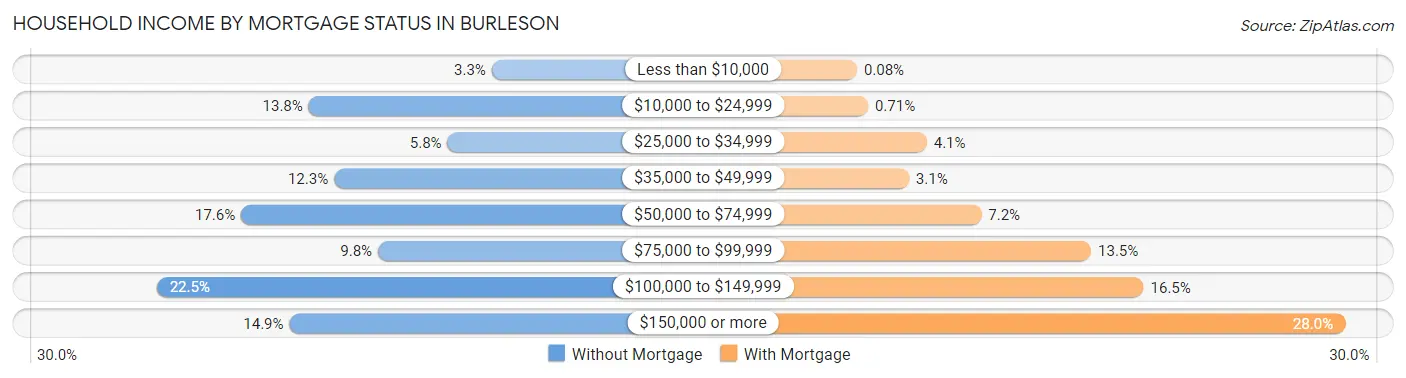
| Household Income | Without Mortgage | With Mortgage |
| Less than $10,000 | 132 (3.3%) | 6 (0.1%) |
| $10,000 to $24,999 | 549 (13.8%) | 56 (0.7%) |
| $25,000 to $34,999 | 233 (5.8%) | 322 (4.1%) |
| $35,000 to $49,999 | 491 (12.3%) | 241 (3.0%) |
| $50,000 to $74,999 | 703 (17.6%) | 568 (7.2%) |
| $75,000 to $99,999 | 391 (9.8%) | 1,064 (13.5%) |
| $100,000 to $149,999 | 895 (22.5%) | 1,301 (16.5%) |
| $150,000 or more | 593 (14.9%) | 2,210 (28.0%) |
| Total | 3,987 (100.0%) | 7,902 (100.0%) |
Property Value to Household Income Ratio in Burleson
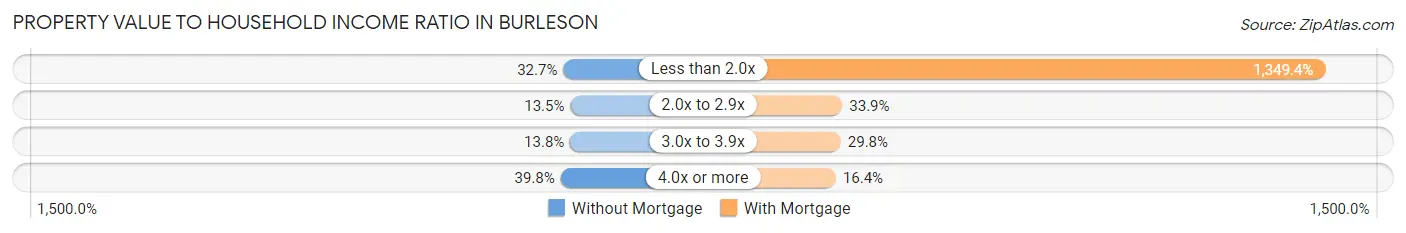
| Value-to-Income Ratio | Without Mortgage | With Mortgage |
| Less than 2.0x | 1,303 (32.7%) | 106,627 (1,349.4%) |
| 2.0x to 2.9x | 538 (13.5%) | 2,678 (33.9%) |
| 3.0x to 3.9x | 550 (13.8%) | 2,354 (29.8%) |
| 4.0x or more | 1,586 (39.8%) | 1,298 (16.4%) |
| Total | 3,987 (100.0%) | 7,902 (100.0%) |
Real Estate Taxes by Mortgage Status in Burleson
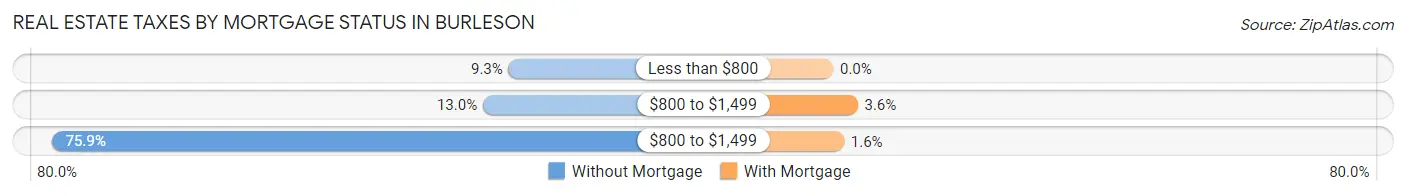
| Property Taxes | Without Mortgage | With Mortgage |
| Less than $800 | 370 (9.3%) | 0 (0.0%) |
| $800 to $1,499 | 519 (13.0%) | 283 (3.6%) |
| $800 to $1,499 | 3,027 (75.9%) | 125 (1.6%) |
| Total | 3,987 (100.0%) | 7,902 (100.0%) |
Health & Disability in Burleson
Health Insurance Coverage by Age in Burleson
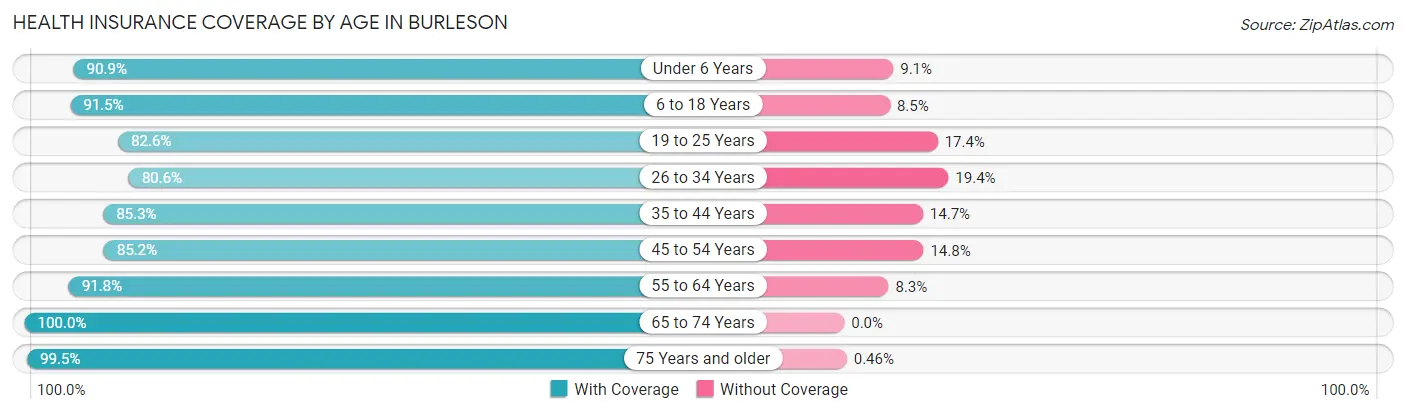
| Age Bracket | With Coverage | Without Coverage |
| Under 6 Years | 4,176 (90.9%) | 420 (9.1%) |
| 6 to 18 Years | 9,627 (91.5%) | 897 (8.5%) |
| 19 to 25 Years | 2,891 (82.6%) | 610 (17.4%) |
| 26 to 34 Years | 4,431 (80.6%) | 1,068 (19.4%) |
| 35 to 44 Years | 6,953 (85.3%) | 1,194 (14.7%) |
| 45 to 54 Years | 4,910 (85.2%) | 851 (14.8%) |
| 55 to 64 Years | 4,405 (91.7%) | 396 (8.3%) |
| 65 to 74 Years | 3,810 (100.0%) | 0 (0.0%) |
| 75 Years and older | 2,150 (99.5%) | 10 (0.5%) |
| Total | 43,353 (88.8%) | 5,446 (11.2%) |
Health Insurance Coverage by Citizenship Status in Burleson
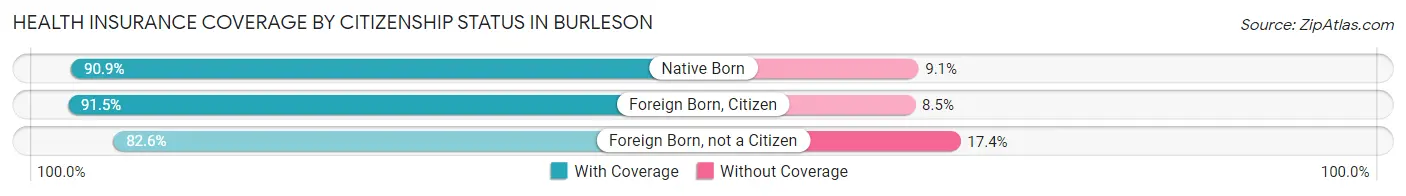
| Citizenship Status | With Coverage | Without Coverage |
| Native Born | 4,176 (90.9%) | 420 (9.1%) |
| Foreign Born, Citizen | 9,627 (91.5%) | 897 (8.5%) |
| Foreign Born, not a Citizen | 2,891 (82.6%) | 610 (17.4%) |
Health Insurance Coverage by Household Income in Burleson
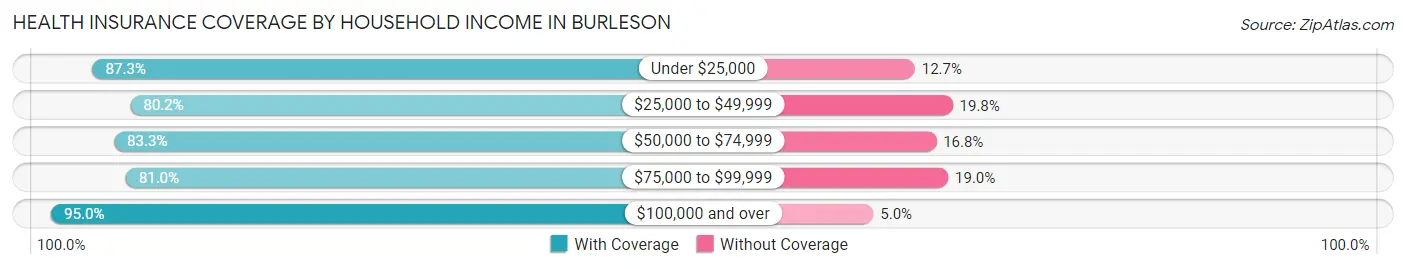
| Household Income | With Coverage | Without Coverage |
| Under $25,000 | 2,466 (87.3%) | 360 (12.7%) |
| $25,000 to $49,999 | 4,292 (80.2%) | 1,061 (19.8%) |
| $50,000 to $74,999 | 6,083 (83.3%) | 1,224 (16.8%) |
| $75,000 to $99,999 | 6,605 (81.0%) | 1,547 (19.0%) |
| $100,000 and over | 23,904 (95.0%) | 1,254 (5.0%) |
Public vs Private Health Insurance Coverage by Age in Burleson
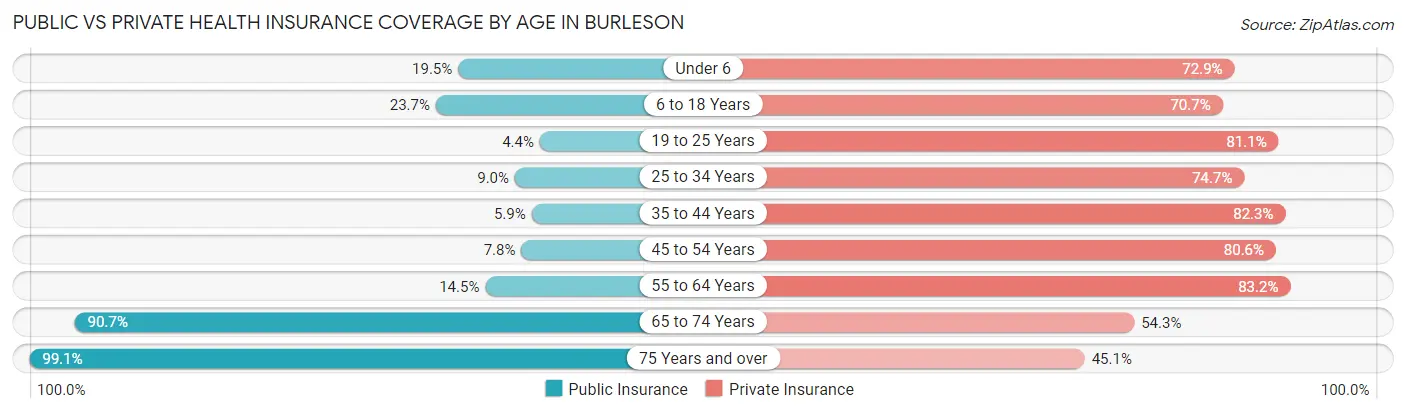
| Age Bracket | Public Insurance | Private Insurance |
| Under 6 | 898 (19.5%) | 3,349 (72.9%) |
| 6 to 18 Years | 2,492 (23.7%) | 7,435 (70.7%) |
| 19 to 25 Years | 153 (4.4%) | 2,838 (81.1%) |
| 25 to 34 Years | 495 (9.0%) | 4,107 (74.7%) |
| 35 to 44 Years | 481 (5.9%) | 6,706 (82.3%) |
| 45 to 54 Years | 450 (7.8%) | 4,641 (80.6%) |
| 55 to 64 Years | 696 (14.5%) | 3,996 (83.2%) |
| 65 to 74 Years | 3,457 (90.7%) | 2,068 (54.3%) |
| 75 Years and over | 2,141 (99.1%) | 974 (45.1%) |
| Total | 11,263 (23.1%) | 36,114 (74.0%) |
Disability Status by Sex by Age in Burleson
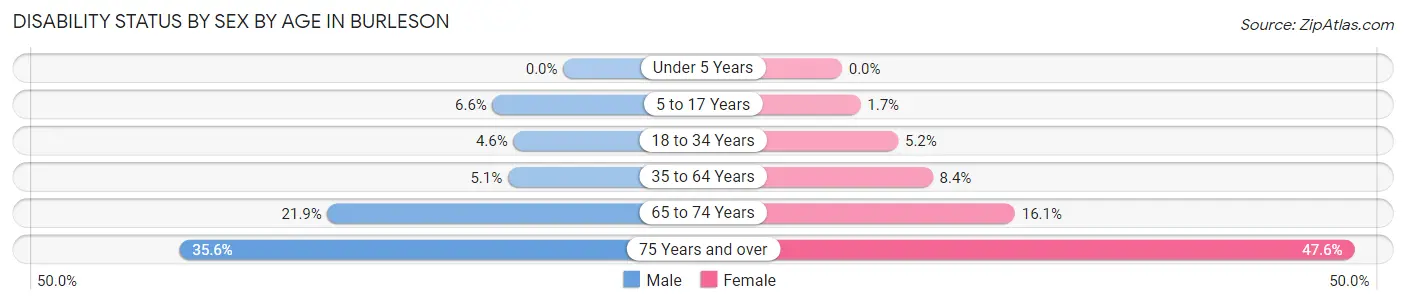
| Age Bracket | Male | Female |
| Under 5 Years | 0 (0.0%) | 0 (0.0%) |
| 5 to 17 Years | 355 (6.6%) | 91 (1.7%) |
| 18 to 34 Years | 213 (4.6%) | 259 (5.2%) |
| 35 to 64 Years | 475 (5.1%) | 796 (8.4%) |
| 65 to 74 Years | 343 (21.9%) | 360 (16.1%) |
| 75 Years and over | 300 (35.6%) | 627 (47.6%) |
Disability Class by Sex by Age in Burleson
Disability Class: Hearing Difficulty
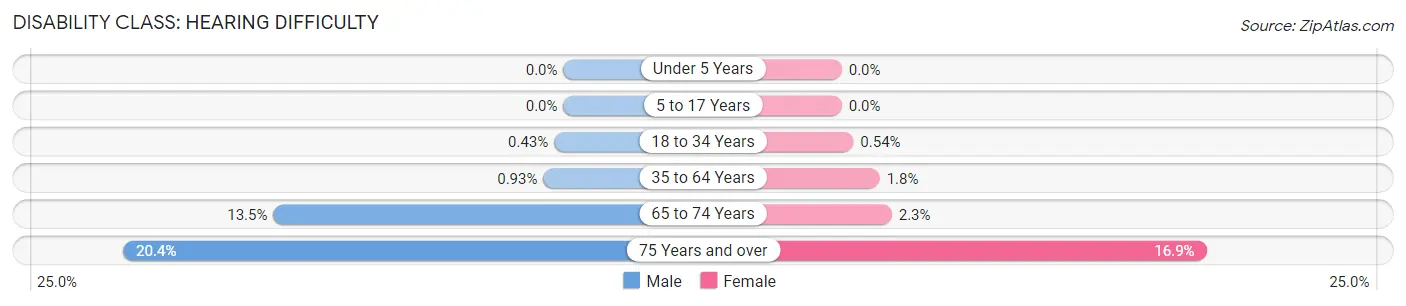
| Age Bracket | Male | Female |
| Under 5 Years | 0 (0.0%) | 0 (0.0%) |
| 5 to 17 Years | 0 (0.0%) | 0 (0.0%) |
| 18 to 34 Years | 20 (0.4%) | 27 (0.5%) |
| 35 to 64 Years | 86 (0.9%) | 166 (1.8%) |
| 65 to 74 Years | 211 (13.5%) | 52 (2.3%) |
| 75 Years and over | 172 (20.4%) | 223 (16.9%) |
Disability Class: Vision Difficulty
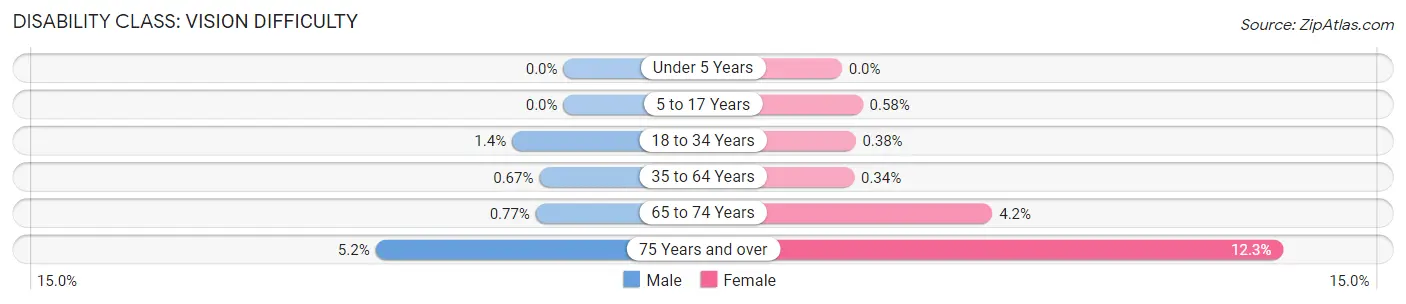
| Age Bracket | Male | Female |
| Under 5 Years | 0 (0.0%) | 0 (0.0%) |
| 5 to 17 Years | 0 (0.0%) | 31 (0.6%) |
| 18 to 34 Years | 66 (1.4%) | 19 (0.4%) |
| 35 to 64 Years | 62 (0.7%) | 32 (0.3%) |
| 65 to 74 Years | 12 (0.8%) | 94 (4.2%) |
| 75 Years and over | 44 (5.2%) | 162 (12.3%) |
Disability Class: Cognitive Difficulty
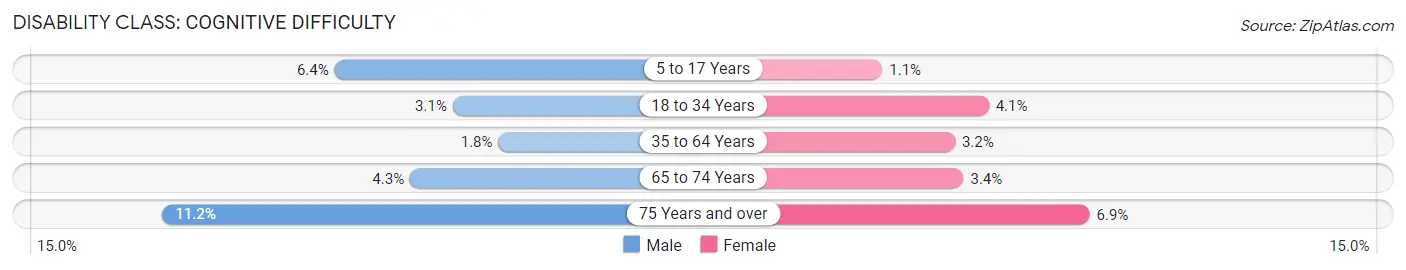
| Age Bracket | Male | Female |
| 5 to 17 Years | 345 (6.4%) | 60 (1.1%) |
| 18 to 34 Years | 142 (3.1%) | 203 (4.1%) |
| 35 to 64 Years | 168 (1.8%) | 298 (3.2%) |
| 65 to 74 Years | 67 (4.3%) | 76 (3.4%) |
| 75 Years and over | 94 (11.2%) | 91 (6.9%) |
Disability Class: Ambulatory Difficulty
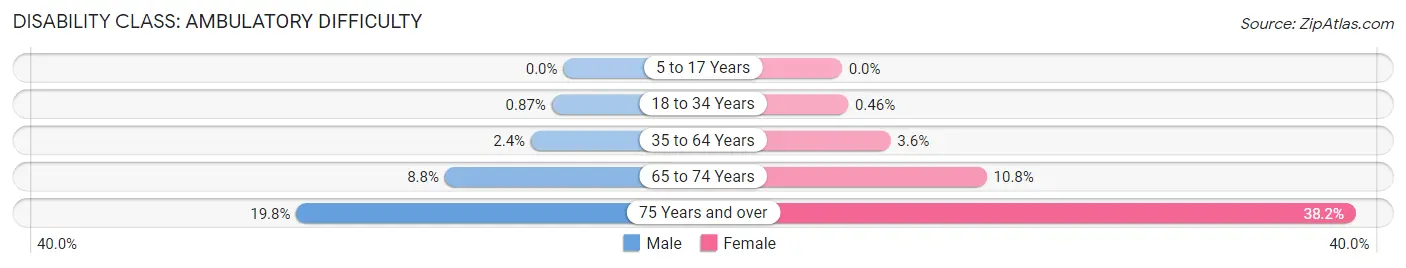
| Age Bracket | Male | Female |
| 5 to 17 Years | 0 (0.0%) | 0 (0.0%) |
| 18 to 34 Years | 40 (0.9%) | 23 (0.5%) |
| 35 to 64 Years | 223 (2.4%) | 341 (3.6%) |
| 65 to 74 Years | 138 (8.8%) | 241 (10.7%) |
| 75 Years and over | 167 (19.8%) | 503 (38.2%) |
Disability Class: Self-Care Difficulty
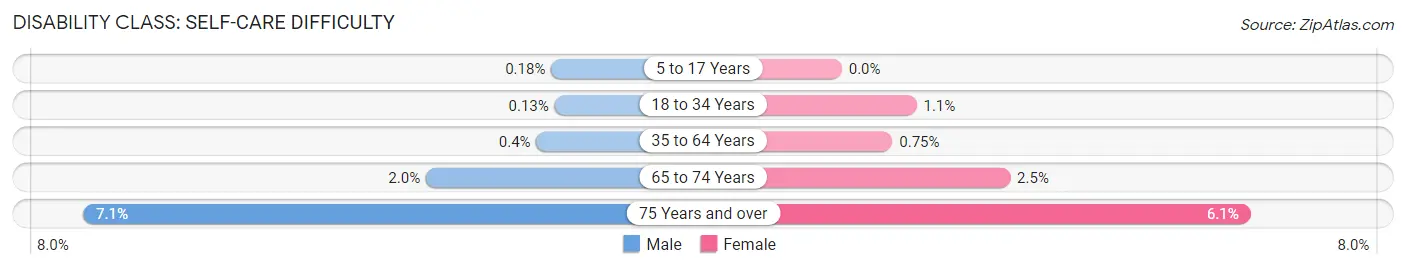
| Age Bracket | Male | Female |
| 5 to 17 Years | 10 (0.2%) | 0 (0.0%) |
| 18 to 34 Years | 6 (0.1%) | 55 (1.1%) |
| 35 to 64 Years | 37 (0.4%) | 71 (0.7%) |
| 65 to 74 Years | 32 (2.0%) | 56 (2.5%) |
| 75 Years and over | 60 (7.1%) | 80 (6.1%) |
Technology Access in Burleson
Computing Device Access in Burleson
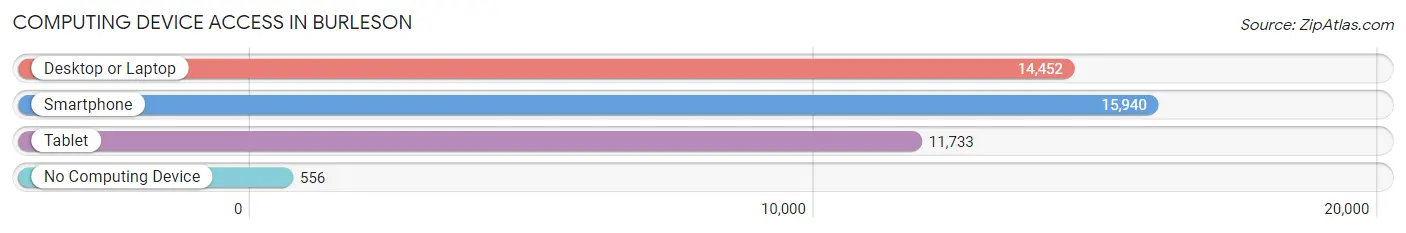
| Device Type | # Households | % Households |
| Desktop or Laptop | 14,452 | 85.0% |
| Smartphone | 15,940 | 93.8% |
| Tablet | 11,733 | 69.0% |
| No Computing Device | 556 | 3.3% |
| Total | 16,998 | 100.0% |
Internet Access in Burleson
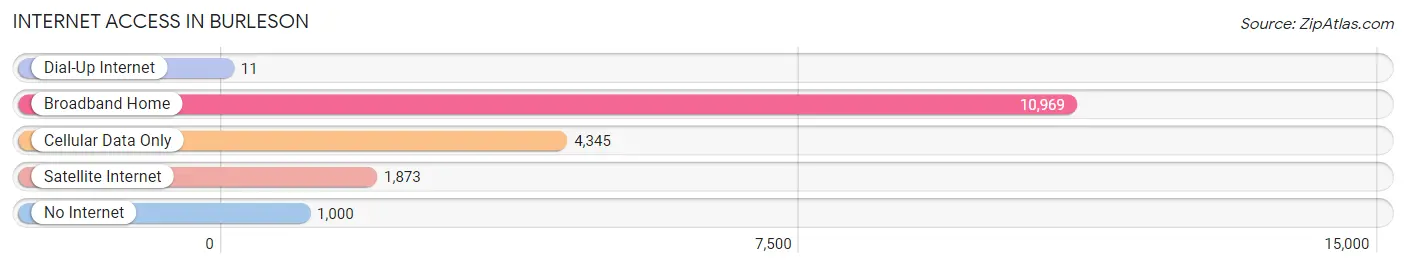
| Internet Type | # Households | % Households |
| Dial-Up Internet | 11 | 0.1% |
| Broadband Home | 10,969 | 64.5% |
| Cellular Data Only | 4,345 | 25.6% |
| Satellite Internet | 1,873 | 11.0% |
| No Internet | 1,000 | 5.9% |
| Total | 16,998 | 100.0% |
Burleson Summary
Burleson, Texas is a city located in Johnson and Tarrant counties in the U.S. state of Texas. It is part of the Dallas-Fort Worth-Arlington metropolitan area. The city is located about 20 miles south of Fort Worth and is part of the Dallas-Fort Worth-Arlington metropolitan area. As of the 2010 census, the city had a population of 36,690.
History
Burleson was founded in 1881 by Rufus Burleson, a former Confederate soldier and Methodist minister. The city was named after him. The city was incorporated in 1908 and has grown steadily since then. The city was originally a farming community, but has since become a bedroom community for Fort Worth and Dallas.
Geography
Burleson is located at 32°32'25" North, 97°19'17" West (32.540278, -97.321389). It is situated in the rolling hills of North Central Texas, about 20 miles south of Fort Worth and 20 miles north of Waco. The city has a total area of 24.2 square miles, of which 24.1 square miles is land and 0.1 square miles is water.
Economy
Burleson's economy is largely based on its proximity to Fort Worth and Dallas. The city is home to several large employers, including Lockheed Martin, Bell Helicopter, and the US Army Corps of Engineers. The city also has a thriving retail sector, with several large shopping centers and numerous restaurants.
Demographics
As of the 2010 census, there were 36,690 people, 12,945 households, and 9,717 families residing in the city. The population density was 1,517.2 people per square mile. The racial makeup of the city was 79.2% White, 8.3% African American, 0.7% Native American, 2.2% Asian, 0.1% Pacific Islander, 6.7% from other races, and 2.8% from two or more races. Hispanic or Latino of any race were 17.3% of the population.
The median income for a household in the city was $60,945, and the median income for a family was $71,845. The per capita income for the city was $25,945. About 5.2% of families and 7.2% of the population were below the poverty line, including 9.2% of those under age 18 and 6.2% of those age 65 or over.
Burleson is a diverse city with a strong sense of community. The city is home to a variety of businesses, restaurants, and entertainment venues. The city is also home to several parks and recreational facilities, making it a great place to live and work.
Common Questions
What is Per Capita Income in Burleson?
Per Capita income in Burleson is $36,700.
What is the Median Family Income in Burleson?
Median Family Income in Burleson is $97,112.
What is the Median Household income in Burleson?
Median Household Income in Burleson is $87,312.
What is Income or Wage Gap in Burleson?
Income or Wage Gap in Burleson is 23.3%.
Women in Burleson earn 76.7 cents for every dollar earned by a man.
What is Family Income Deficit in Burleson?
Family Income Deficit in Burleson is $9,957.
Families that are below poverty line in Burleson earn $9,957 less on average than the poverty threshold level.
What is Inequality or Gini Index in Burleson?
Inequality or Gini Index in Burleson is 0.38.
What is the Total Population of Burleson?
Total Population of Burleson is 48,970.
What is the Total Male Population of Burleson?
Total Male Population of Burleson is 23,762.
What is the Total Female Population of Burleson?
Total Female Population of Burleson is 25,208.
What is the Ratio of Males per 100 Females in Burleson?
There are 94.26 Males per 100 Females in Burleson.
What is the Ratio of Females per 100 Males in Burleson?
There are 106.09 Females per 100 Males in Burleson.
What is the Median Population Age in Burleson?
Median Population Age in Burleson is 35.4 Years.
What is the Average Family Size in Burleson
Average Family Size in Burleson is 3.4 People.
What is the Average Household Size in Burleson
Average Household Size in Burleson is 2.9 People.
How Large is the Labor Force in Burleson?
There are 25,142 People in the Labor Forcein in Burleson.
What is the Percentage of People in the Labor Force in Burleson?
69.9% of People are in the Labor Force in Burleson.
What is the Unemployment Rate in Burleson?
Unemployment Rate in Burleson is 3.8%.