Cities with the Most Immigrants from Japan in Colorado
RELATED REPORTS & OPTIONS
Japan
Colorado
Compare Cities
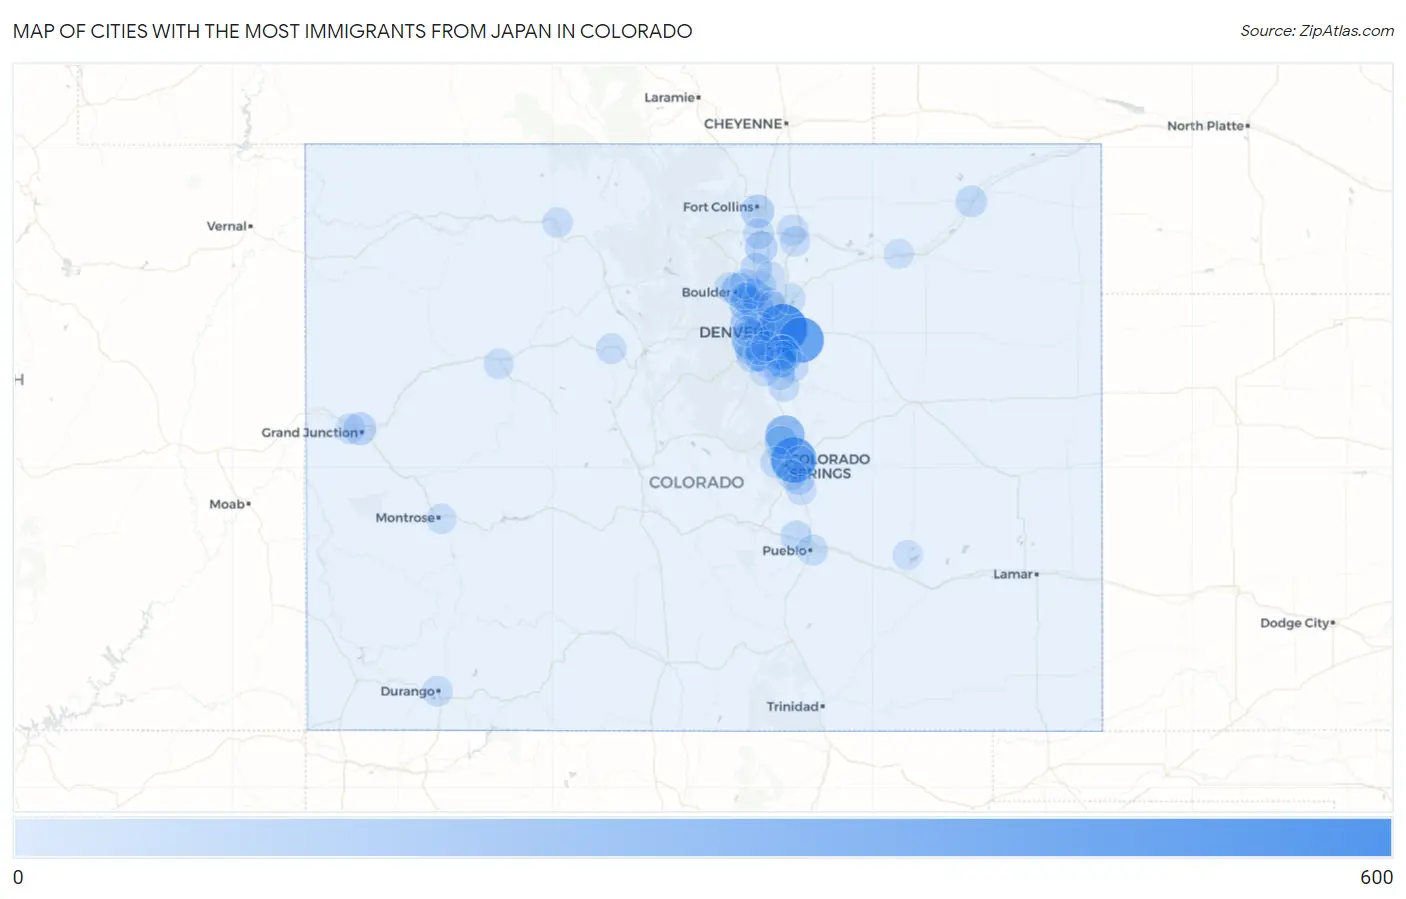
Map of Cities with the Most Immigrants from Japan in Colorado
0
600
Cities with the Most Immigrants from Japan in Colorado
| City | Japan | vs State | vs National | |
| 1. | Denver | 551 | 4,075(13.52%)#1 | 342,380(0.16%)#78 |
| 2. | Colorado Springs | 431 | 4,075(10.58%)#2 | 342,380(0.13%)#108 |
| 3. | Aurora | 427 | 4,075(10.48%)#3 | 342,380(0.12%)#109 |
| 4. | Gleneagle | 252 | 4,075(6.18%)#4 | 342,380(0.07%)#214 |
| 5. | Lakewood | 244 | 4,075(5.99%)#5 | 342,380(0.07%)#223 |
| 6. | Centennial | 126 | 4,075(3.09%)#6 | 342,380(0.04%)#436 |
| 7. | Boulder | 116 | 4,075(2.85%)#7 | 342,380(0.03%)#469 |
| 8. | Superior | 110 | 4,075(2.70%)#8 | 342,380(0.03%)#495 |
| 9. | Air Force Academy | 90 | 4,075(2.21%)#9 | 342,380(0.03%)#596 |
| 10. | Fort Collins | 89 | 4,075(2.18%)#10 | 342,380(0.03%)#597 |
| 11. | Westminster | 82 | 4,075(2.01%)#11 | 342,380(0.02%)#641 |
| 12. | Grand Junction | 74 | 4,075(1.82%)#12 | 342,380(0.02%)#692 |
| 13. | Berthoud | 70 | 4,075(1.72%)#13 | 342,380(0.02%)#722 |
| 14. | Ken Caryl | 65 | 4,075(1.60%)#14 | 342,380(0.02%)#764 |
| 15. | Louisville | 64 | 4,075(1.57%)#15 | 342,380(0.02%)#778 |
| 16. | Broomfield | 60 | 4,075(1.47%)#16 | 342,380(0.02%)#805 |
| 17. | Cherry Creek | 59 | 4,075(1.45%)#17 | 342,380(0.02%)#825 |
| 18. | Security Widefield | 53 | 4,075(1.30%)#18 | 342,380(0.02%)#908 |
| 19. | Longmont | 50 | 4,075(1.23%)#19 | 342,380(0.01%)#943 |
| 20. | Meridian | 42 | 4,075(1.03%)#20 | 342,380(0.01%)#1,079 |
| 21. | Parker | 40 | 4,075(0.98%)#21 | 342,380(0.01%)#1,108 |
| 22. | Manitou Springs | 38 | 4,075(0.93%)#22 | 342,380(0.01%)#1,161 |
| 23. | Highlands Ranch | 37 | 4,075(0.91%)#23 | 342,380(0.01%)#1,166 |
| 24. | Sterling | 37 | 4,075(0.91%)#24 | 342,380(0.01%)#1,182 |
| 25. | Pueblo West | 36 | 4,075(0.88%)#25 | 342,380(0.01%)#1,197 |
| 26. | Dove Valley | 34 | 4,075(0.83%)#26 | 342,380(0.01%)#1,240 |
| 27. | Greeley | 31 | 4,075(0.76%)#27 | 342,380(0.01%)#1,308 |
| 28. | Castle Rock | 28 | 4,075(0.69%)#28 | 342,380(0.01%)#1,416 |
| 29. | Littleton | 25 | 4,075(0.61%)#29 | 342,380(0.01%)#1,516 |
| 30. | Pueblo | 24 | 4,075(0.59%)#30 | 342,380(0.01%)#1,554 |
| 31. | Loveland | 23 | 4,075(0.56%)#31 | 342,380(0.01%)#1,591 |
| 32. | Lafayette | 22 | 4,075(0.54%)#32 | 342,380(0.01%)#1,644 |
| 33. | Lone Tree | 21 | 4,075(0.52%)#33 | 342,380(0.01%)#1,705 |
| 34. | Brighton | 20 | 4,075(0.49%)#34 | 342,380(0.01%)#1,743 |
| 35. | Pine Brook Hill | 20 | 4,075(0.49%)#35 | 342,380(0.01%)#1,783 |
| 36. | Evans | 18 | 4,075(0.44%)#36 | 342,380(0.01%)#1,854 |
| 37. | Cimarron Hills | 18 | 4,075(0.44%)#37 | 342,380(0.01%)#1,857 |
| 38. | Arvada | 17 | 4,075(0.42%)#38 | 342,380(0.00%)#1,888 |
| 39. | Northglenn | 17 | 4,075(0.42%)#39 | 342,380(0.00%)#1,896 |
| 40. | Dakota Ridge | 16 | 4,075(0.39%)#40 | 342,380(0.00%)#1,965 |
| 41. | Durango | 16 | 4,075(0.39%)#41 | 342,380(0.00%)#1,973 |
| 42. | Mountain View | 16 | 4,075(0.39%)#42 | 342,380(0.00%)#2,009 |
| 43. | Gunbarrel | 14 | 4,075(0.34%)#43 | 342,380(0.00%)#2,124 |
| 44. | Stratmoor | 14 | 4,075(0.34%)#44 | 342,380(0.00%)#2,133 |
| 45. | Vail | 14 | 4,075(0.34%)#45 | 342,380(0.00%)#2,143 |
| 46. | Inverness | 14 | 4,075(0.34%)#46 | 342,380(0.00%)#2,150 |
| 47. | Twin Lakes Cdp Adams County | 11 | 4,075(0.27%)#47 | 342,380(0.00%)#2,413 |
| 48. | Fountain | 10 | 4,075(0.25%)#48 | 342,380(0.00%)#2,475 |
| 49. | Steamboat Springs | 10 | 4,075(0.25%)#49 | 342,380(0.00%)#2,500 |
| 50. | Castle Pines | 10 | 4,075(0.25%)#50 | 342,380(0.00%)#2,505 |
| 51. | Redlands | 10 | 4,075(0.25%)#51 | 342,380(0.00%)#2,513 |
| 52. | Paragon Estates | 8 | 4,075(0.20%)#52 | 342,380(0.00%)#2,774 |
| 53. | Columbine | 7 | 4,075(0.17%)#53 | 342,380(0.00%)#2,804 |
| 54. | Fairmount | 6 | 4,075(0.15%)#54 | 342,380(0.00%)#2,943 |
| 55. | Glenwood Springs | 6 | 4,075(0.15%)#55 | 342,380(0.00%)#2,945 |
| 56. | Applewood | 6 | 4,075(0.15%)#56 | 342,380(0.00%)#2,952 |
| 57. | Louviers | 6 | 4,075(0.15%)#57 | 342,380(0.00%)#3,016 |
| 58. | Erie | 5 | 4,075(0.12%)#58 | 342,380(0.00%)#3,027 |
| 59. | Montrose | 5 | 4,075(0.12%)#59 | 342,380(0.00%)#3,034 |
| 60. | Bow Mar | 5 | 4,075(0.12%)#60 | 342,380(0.00%)#3,096 |
| 61. | Englewood | 4 | 4,075(0.10%)#61 | 342,380(0.00%)#3,131 |
| 62. | Frederick | 4 | 4,075(0.10%)#62 | 342,380(0.00%)#3,155 |
| 63. | Log Lane Village | 4 | 4,075(0.10%)#63 | 342,380(0.00%)#3,219 |
| 64. | Ordway | 3 | 4,075(0.07%)#64 | 342,380(0.00%)#3,293 |
| 65. | Thornton | 2 | 4,075(0.05%)#65 | 342,380(0.00%)#3,345 |
Common Questions
What are the Top 10 Cities with the Most Immigrants from Japan in Colorado?
Top 10 Cities with the Most Immigrants from Japan in Colorado are:
#1
551
#2
431
#3
427
#4
252
#5
244
#6
126
#7
116
#8
110
#9
90
#10
89
What city has the Most Immigrants from Japan in Colorado?
Denver has the Most Immigrants from Japan in Colorado with 551.
What is the Total Immigrants from Japan in the State of Colorado?
Total Immigrants from Japan in Colorado is 4,075.
What is the Total Immigrants from Japan in the United States?
Total Immigrants from Japan in the United States is 342,380.