Zip Codes with the Highest Percentage of Population Employed in Administrative & Support Services in Philadelphia, PA
RELATED REPORTS & OPTIONS
Administrative & Support Services
Philadelphia
Compare Zip Codes
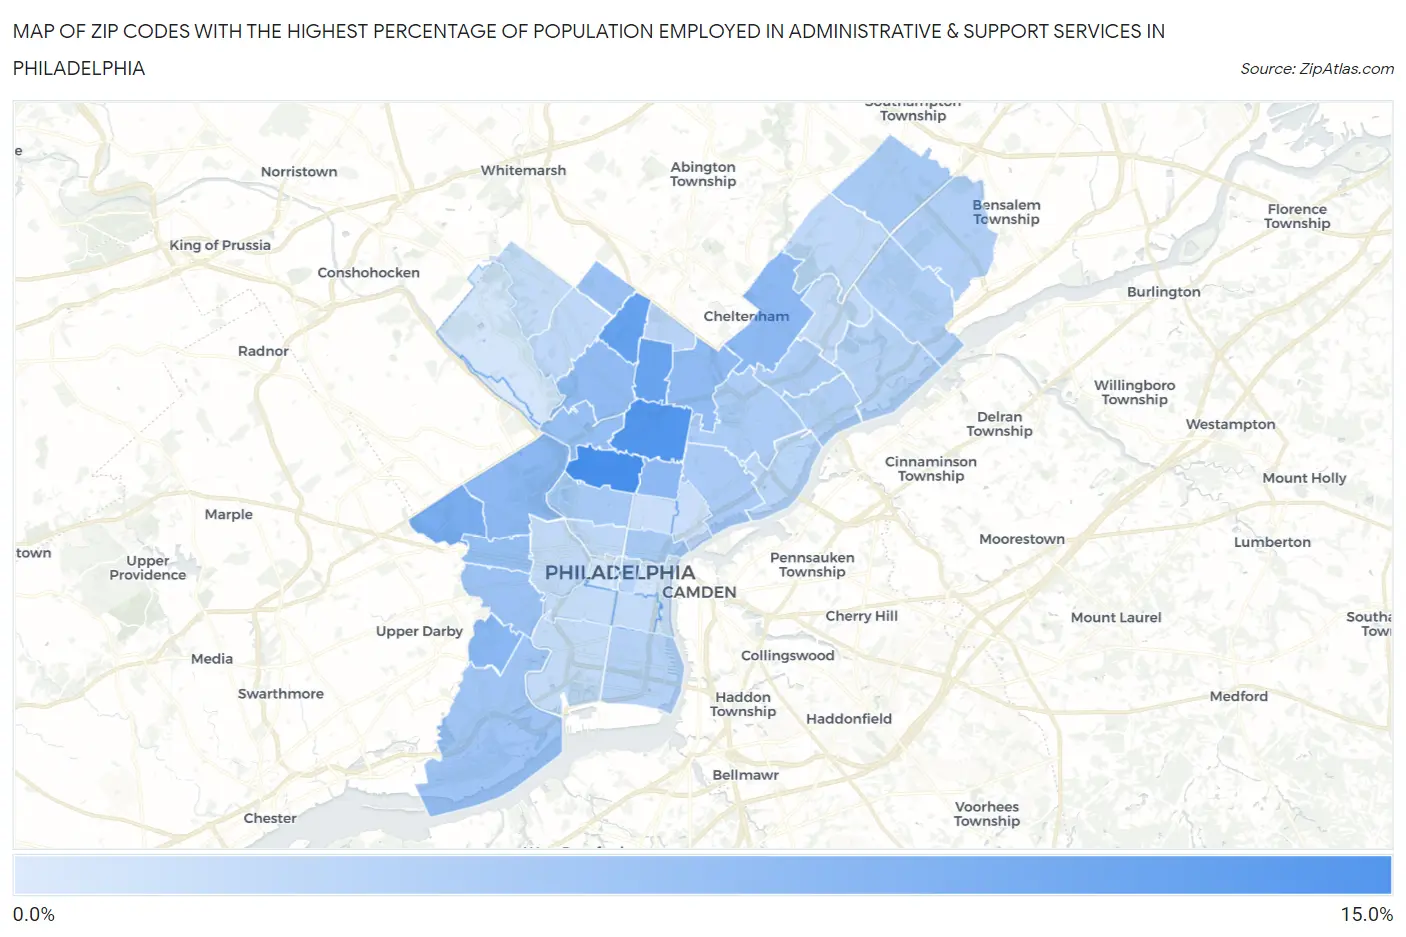
Map of Zip Codes with the Highest Percentage of Population Employed in Administrative & Support Services in Philadelphia
1.2%
10.3%
Zip Codes with the Highest Percentage of Population Employed in Administrative & Support Services in Philadelphia, PA
| Zip Code | % Employed | vs State | vs National | |
| 1. | 19132 | 10.3% | 3.6%(+6.74)#68 | 4.1%(+6.18)#1,190 |
| 2. | 19140 | 9.7% | 3.6%(+6.08)#79 | 4.1%(+5.52)#1,410 |
| 3. | 19138 | 8.5% | 3.6%(+4.87)#97 | 4.1%(+4.30)#1,991 |
| 4. | 19141 | 8.1% | 3.6%(+4.53)#102 | 4.1%(+3.96)#2,197 |
| 5. | 19151 | 7.1% | 3.6%(+3.53)#142 | 4.1%(+2.96)#3,074 |
| 6. | 19142 | 6.2% | 3.6%(+2.57)#201 | 4.1%(+2.00)#4,500 |
| 7. | 19133 | 6.0% | 3.6%(+2.42)#211 | 4.1%(+1.85)#4,780 |
| 8. | 19131 | 6.0% | 3.6%(+2.40)#212 | 4.1%(+1.84)#4,807 |
| 9. | 19111 | 5.9% | 3.6%(+2.36)#219 | 4.1%(+1.80)#4,880 |
| 10. | 19120 | 5.8% | 3.6%(+2.19)#236 | 4.1%(+1.62)#5,212 |
| 11. | 19144 | 5.7% | 3.6%(+2.15)#242 | 4.1%(+1.58)#5,289 |
| 12. | 19139 | 5.5% | 3.6%(+1.91)#274 | 4.1%(+1.34)#5,874 |
| 13. | 19129 | 5.3% | 3.6%(+1.69)#304 | 4.1%(+1.12)#6,402 |
| 14. | 19143 | 5.2% | 3.6%(+1.60)#315 | 4.1%(+1.04)#6,622 |
| 15. | 19150 | 5.1% | 3.6%(+1.54)#325 | 4.1%(+0.974)#6,785 |
| 16. | 19153 | 4.8% | 3.6%(+1.17)#368 | 4.1%(+0.601)#7,869 |
| 17. | 19116 | 4.4% | 3.6%(+0.770)#427 | 4.1%(+0.205)#9,271 |
| 18. | 19123 | 4.3% | 3.6%(+0.695)#438 | 4.1%(+0.131)#9,522 |
| 19. | 19121 | 4.3% | 3.6%(+0.682)#441 | 4.1%(+0.118)#9,568 |
| 20. | 19134 | 4.1% | 3.6%(+0.561)#465 | 4.1%(-0.004)#10,060 |
| 21. | 19124 | 4.1% | 3.6%(+0.500)#478 | 4.1%(-0.064)#10,302 |
| 22. | 19149 | 4.0% | 3.6%(+0.406)#507 | 4.1%(-0.159)#10,738 |
| 23. | 19114 | 3.7% | 3.6%(+0.152)#580 | 4.1%(-0.412)#11,829 |
| 24. | 19154 | 3.7% | 3.6%(+0.132)#584 | 4.1%(-0.433)#11,920 |
| 25. | 19135 | 3.7% | 3.6%(+0.124)#585 | 4.1%(-0.441)#11,946 |
| 26. | 19148 | 3.5% | 3.6%(-0.118)#658 | 4.1%(-0.683)#13,133 |
| 27. | 19136 | 3.5% | 3.6%(-0.134)#664 | 4.1%(-0.699)#13,208 |
| 28. | 19126 | 3.4% | 3.6%(-0.221)#686 | 4.1%(-0.785)#13,624 |
| 29. | 19107 | 3.2% | 3.6%(-0.365)#732 | 4.1%(-0.929)#14,374 |
| 30. | 19137 | 3.2% | 3.6%(-0.427)#748 | 4.1%(-0.992)#14,689 |
| 31. | 19119 | 3.0% | 3.6%(-0.600)#801 | 4.1%(-1.16)#15,544 |
| 32. | 19115 | 2.9% | 3.6%(-0.636)#818 | 4.1%(-1.20)#15,744 |
| 33. | 19130 | 2.9% | 3.6%(-0.674)#832 | 4.1%(-1.24)#15,933 |
| 34. | 19152 | 2.8% | 3.6%(-0.763)#868 | 4.1%(-1.33)#16,408 |
| 35. | 19104 | 2.8% | 3.6%(-0.829)#904 | 4.1%(-1.39)#16,804 |
| 36. | 19118 | 2.7% | 3.6%(-0.861)#916 | 4.1%(-1.43)#16,962 |
| 37. | 19145 | 2.7% | 3.6%(-0.882)#922 | 4.1%(-1.45)#17,057 |
| 38. | 19102 | 2.7% | 3.6%(-0.916)#931 | 4.1%(-1.48)#17,247 |
| 39. | 19146 | 2.5% | 3.6%(-1.08)#980 | 4.1%(-1.65)#18,120 |
| 40. | 19147 | 2.5% | 3.6%(-1.12)#996 | 4.1%(-1.69)#18,331 |
| 41. | 19125 | 2.3% | 3.6%(-1.31)#1,062 | 4.1%(-1.87)#19,278 |
| 42. | 19122 | 2.3% | 3.6%(-1.33)#1,068 | 4.1%(-1.89)#19,382 |
| 43. | 19128 | 1.7% | 3.6%(-1.86)#1,196 | 4.1%(-2.42)#21,836 |
| 44. | 19103 | 1.6% | 3.6%(-1.94)#1,215 | 4.1%(-2.50)#22,171 |
| 45. | 19106 | 1.5% | 3.6%(-2.06)#1,244 | 4.1%(-2.63)#22,662 |
| 46. | 19127 | 1.2% | 3.6%(-2.41)#1,306 | 4.1%(-2.98)#23,939 |
1
Common Questions
What are the Top 10 Zip Codes with the Highest Percentage of Population Employed in Administrative & Support Services in Philadelphia, PA?
Top 10 Zip Codes with the Highest Percentage of Population Employed in Administrative & Support Services in Philadelphia, PA are:
What zip code has the Highest Percentage of Population Employed in Administrative & Support Services in Philadelphia, PA?
19132 has the Highest Percentage of Population Employed in Administrative & Support Services in Philadelphia, PA with 10.3%.
What is the Percentage of Population Employed in Administrative & Support Services in Philadelphia, PA?
Percentage of Population Employed in Administrative & Support Services in Philadelphia is 4.3%.
What is the Percentage of Population Employed in Administrative & Support Services in Pennsylvania?
Percentage of Population Employed in Administrative & Support Services in Pennsylvania is 3.6%.
What is the Percentage of Population Employed in Administrative & Support Services in the United States?
Percentage of Population Employed in Administrative & Support Services in the United States is 4.1%.